![]()
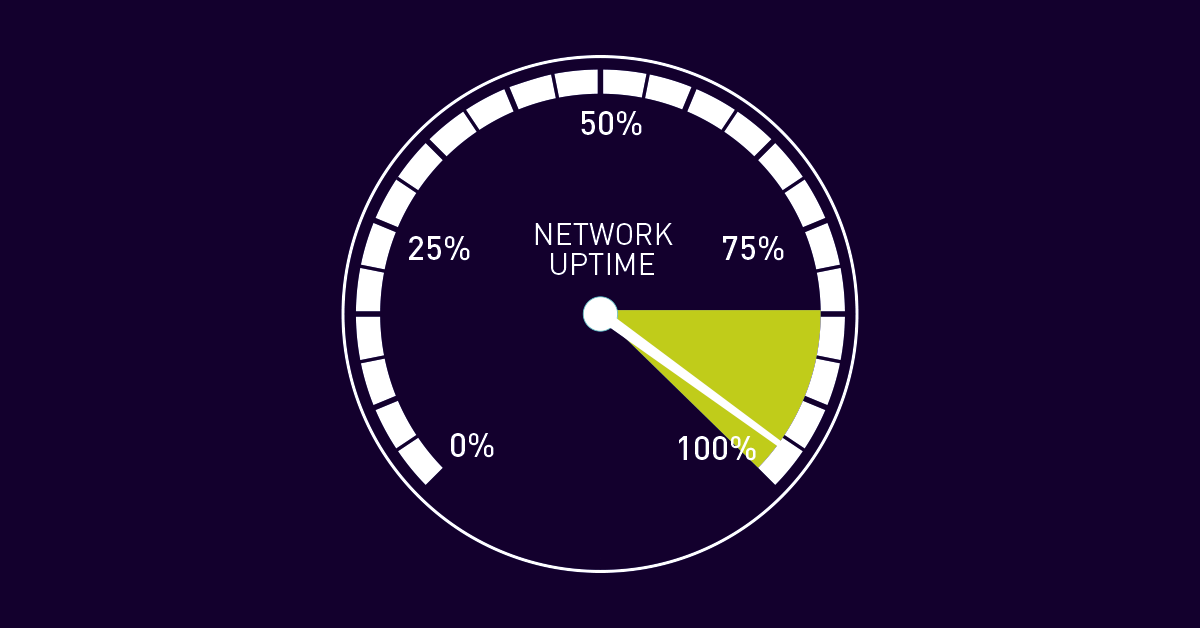
A stable SharePoint server
makes for a stable business

SharePoint servers
and applications
run according to plan
Calculate
server workload
and performance
Automatic alerts in the event
of looming malfunctions
or overloads
SharePoint data
reports over distinct
periods of time
PRTG monitoring helps you solve SharePoint problems faster
![]()
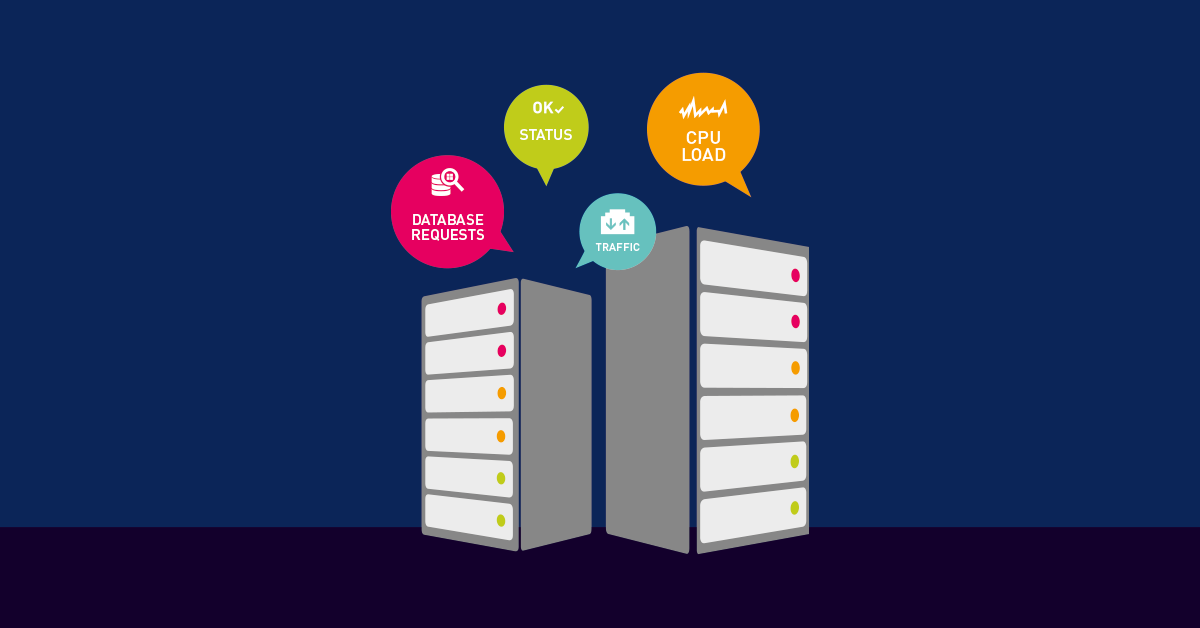
SharePoint is vital to your business
Work processes come to a halt when access to the company portal, to document management, to project administration, or to company-owed collaboration platforms is no longer available. SharePoint is a popular solution for meeting many of a company’s demands. Detailed SharePoint monitoring ensures SharePoint applications run according to plan, and that important applications always receive the capacity they need to perform at optimum efficiency.
![]()
Keep SharePoint stable
A SharePoint Server malfunction can have serious consequences. Even a slight slowdown in server processes can lead to decreased usability and sluggish work processes. In addition, tasks can no longer be coordinated and documents are no longer able to be accessed via mobile devices. Sales representatives are therefore faced with exactly the same problem as managers, who need key figures even on weekends.
![]()
Monitor all SharePoint servers
As an IT administrator, you should keep a constant eye on SharePoint Server. With the PRTG Network Monitor, you get access to all the necessary preconfigured sensors, as well as to a powerful API for customizing your monitoring with user-defined sensors. Only with professional monitoring can you make the most of improved performance and reliability and fast and well-founded decision-making processes.
With PRTG, the entire team will work like a well-oiled machine.
An introduction to SharePoint Server monitoring with PRTG
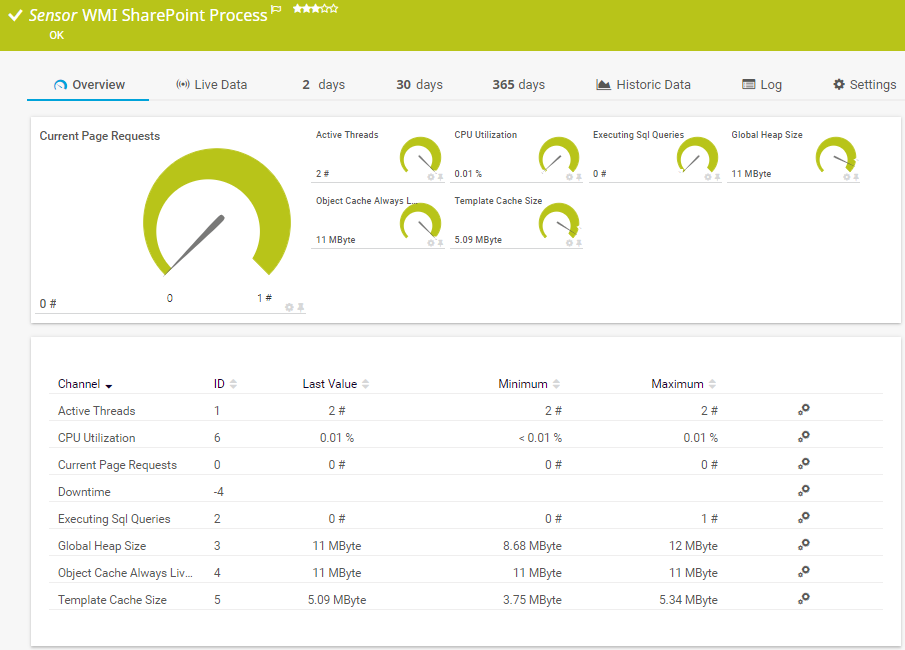
Sensor WMI SharePoint Process
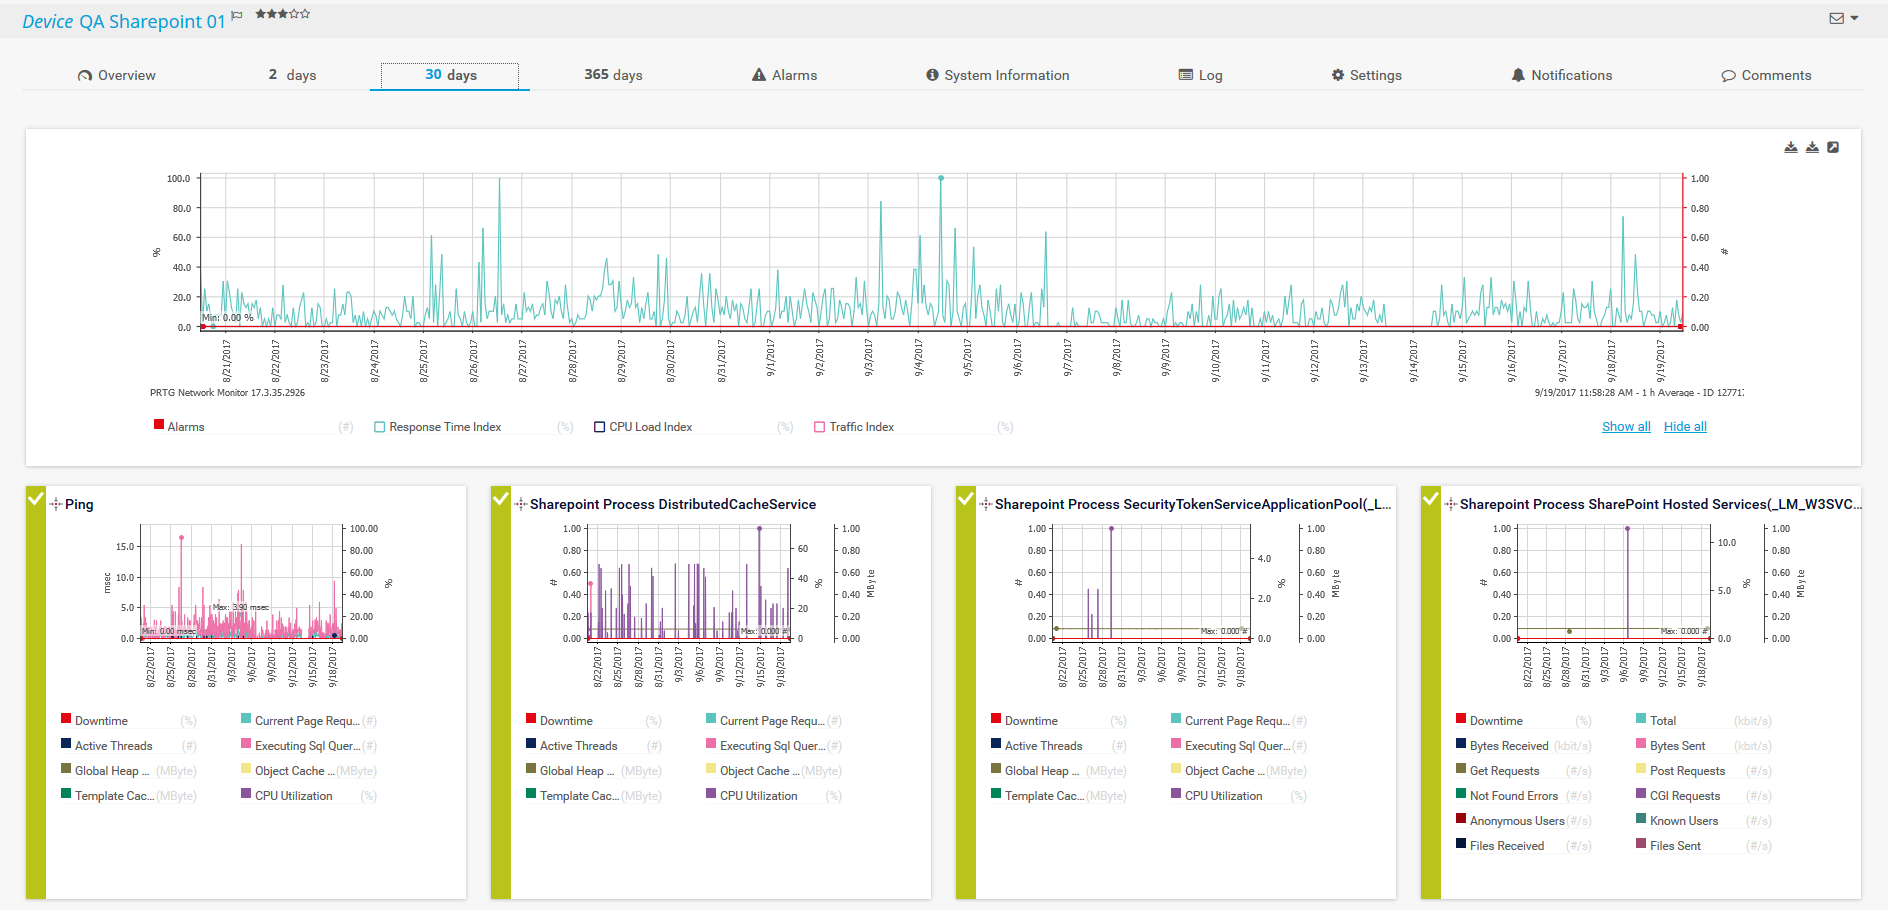
Sensor of SharePoint device

Sunburst view
How SharePoint Server monitoring with PRTG works
![]() How PRTG defines sensors
How PRTG defines sensors
In PRTG, “sensors” are the basic monitoring elements. One sensor usually monitors one measured value in your network, e.g. the traffic of a switch port, the CPU load of a server, the free space of a disk drive. On average you need about 5-10 sensors per device or one sensor per switch port.
The WMI SharePoint Process Sensor is used to monitor your SharePoint Server. The basis for this sensor (and that which allows it to query monitoring data) is the Windows Management Instrumentation (WMI) Protocol, Microsoft’s standard technology for the management and monitoring of Windows-based IT systems.
WMI provides distributed applications with a standardized management interface for Windows. It lets you access – by reading and writing, both locally and remotely – nearly all the settings of a Windows computer.
PRTG uses this technology to access the data on a variety of different parameters and status values of a Windows configuration. Sensors that use the Windows Management Instrumentation (WMI) Protocol, however, tend to affect system performance more than other monitoring technologies. We therefore recommend using less than 200 WMI sensors per probe, and deploying several remote probes so load balancing can distribute the load across various different computers.
For an introduction to WMI: Monitoring via WMI
In addition to the WMI SharePoint Process Sensor, PRTG lets you monitor SharePoint with its Windows IIS Application Sensor and PerfCounter IIS Application Pool Sensor. The former can use both WMI and Windows performance counters to query data, while the latter only uses performance counters. This technology is used via the Windows Remote Registry Service.
Data gathered by PRTG during SharePoint monitoring:
The WMI SharePoint Process Sensor delivers the following data:
- Number of current page requests
- Number of active threads
- Number of ongoing SQL queries
- Memory requirement of objects that are always active
- Template cache size
- Global heap size
- CPU usage in percent
With the Windows IIS Application Sensor, you also get SharePoint performance indicators such as data traffic volume, the number of transferred files, the number of known and unknown users, and the number of queries. Furthermore, the PerfCounter IIS Application Pool Sensor shows you the status and number of processes running in the application pool.
SharePoint Server sensor data at a glance – even while on the go
Set up PRTG in minutes and use it on almost any mobile device.


5 good reasons to choose PRTG as your SharePoint Server monitoring tool
![]()
Obtain an overview of server status and performance
Your dashboard serves as the server center. It offers a convenient overview of the status and performance of your SharePoint Server. And you can use its data to create reports and thus present others with the same overview.
![]()
Take advantage of customizable sensors
PRTG sensors can be configured in a customizable manner, in order, for example, to keep an eye on specific datasets by means of user-defined SQL queries. Custom reports based on these queries can be sent to others automatically.
![]()
PRTG automatically lightens your workload
You can count on SharePoint Server monitoring by PRTG. In the event of downtime or server problems, you'll be informed automatically, wherever you happen to be.
![]()
Stabilize your business over the long run
The constant monitoring of SharePoint Server and its databases allows for quicker troubleshooting. Malfunctions in business-critical processes are circumvented, and the company’s success is not put at risk. A stable server makes for a stable business.
![]()
Back up data and ensure compliance
SharePoint Server processes a variety of business-critical and personal data. With server problems comes the danger of data loss and compliance violations. PRTG ensures your data stays safe, even in the event of problems.

“Our top priority is to continue to develop PRTG is a constant, practical, and proactive manner. Our hope is that administrators will always be ready for any new standards which arise.”
Dirk Paessler, founder of Paessler AG in Nuremberg
Trusted by 500,000 users and recognized
by industry analysts as a leader

“Fantastic network and infrastructure monitoring solution that is easy to deploy and easier still to use. Simply the best available.”

“Software is absolutely perfect, Support is superior. Meets all needs and requirements, this is a must have solution if you are needing any form of monitoring.”

“The tool excels at its primary focus of being a unified infrastructure management and network monitoring service.”
Create innovative solutions with Paessler’s partners
Partnering with innovative vendors, Paessler unleashes synergies to create
new and additional benefits for joined customers.

Paessler is member of the mioty alliance, composed of companies that use mioty to create innovative IoT and IIoT solutions such as the retrofitting of industrial environments.
mioty alliance
PRTG makes your job easier
Our monitoring software frees you to focus on other tasks by promptly notifying you of potential issues.
![]()
Save effort
PRTG gives you one central monitoring tool for your servers and entire network. Enjoy a quick overview of your whole infrastructure via our dashboard and app.
![]()
Save time
Getting started with PRTG is a breeze. Setting up or switching from another network monitoring tool is easy thanks to the auto-discovery and pre-configured device templates.
![]()
Save money
80% of our customers report substantial cost savings with network monitoring. Your costs of licenses will likely pay for themselves within weeks.

“Our network engineers really love PRTG, because of its customization”
John Krull, CTO, Oakland Unified School District, USA
We asked: would you recommend PRTG?
Over 95% of our customers say yes!
Paessler AG conducted trials in over 600 IT departments worldwide to tune its network monitoring software closer to the needs of sysadmins.
The result of the survey: over 95% of the participants would recommend PRTG – or already have.


Want to read more? Please do!
Backup Monitoring: PRTG secures cloud and online backups, operating system backups and virtual machines. In case of incorrect backups, you get automatically notified.
Email monitoring: Here you will learn all you need to know about email monitoring with PRTG, such as how to use Round Trip sensors to monitor Microsoft Exchange Server and how to monitor your mail servers.
Syslog Monitoring: Keep an eye on all the syslog and Windows Event Log messages.
“Easy to implement and configure with good technical support.”
R. v. S., ICT Manager at Heinen & Hopman Eng BV

PRTG: The multi-tool for sysadmins
Adapt PRTG individually and dynamically to your needs and rely on a strong API:- HTTP API: Access monitoring data and manipulate monitoring objects via HTTP requests
- Custom sensors: Create your own PRTG sensors for customized monitoring
- Custom notifications: Create your own notifications and send action triggers to external systems
- REST Custom sensor: Monitor almost everything that provides data in XML or JSON format
Still not convinced?
![]()
More than 500,000 sysadmins love PRTG
Paessler PRTG is used by companies of all sizes. Sysadmins love PRTG because it makes their job a whole lot easier.
Still not convinced?
![]()
Monitor your entire IT infrastructure
Bandwidth, servers, virtual environments, websites, VoIP services – PRTG keeps an eye on your entire network.
![]()
Try Paessler PRTG for free
Everyone has different monitoring needs. That’s why we let you try PRTG for free. Start now with your trial.
|
PRTG |
Network Monitoring Software - Version 24.2.94.1400 (April 10th, 2024) |
|
Hosting |
Download for Windows and cloud-based version PRTG Hosted Monitor available |
Languages |
English, German, Spanish, French, Portuguese, Dutch, Russian, Japanese, and Simplified Chinese |
Pricing |
Up to 100 sensors for free (Price List) |
Unified Monitoring |
Network devices, bandwidth, servers, applications, virtual environments, remote systems, IoT, and more |
Supported Vendors & Applications |
|