Today we're going to evaluate Paessler PRTG and its look at some PRTG Alternatives for Network monitoring to understand its similarities and differences among its peers and competitors and how they stack up against each other. Monitoring your environment is critical if you need to ensure maximum up-time, which is why network and application monitoring software is so important.
Here is our list of the best Paessler PRTG Alternatives:


These systems are able to detect anomalies and alert the right people before anything major happens that could result in an incident.
This greatly helps to reduce downtime, and is the best proactive approach for you and your team to take when looking to keep an eye on your organization’s infrastructure.
To Start, let's see what PRTG has to offer:
PRTG has long been known for its monitoring and alerting features, and is an essential set of tools for anyone that needs to monitor network traffic and performance.
The system functions in a live state, and lets you see what is really happening on the network in real-time.
It features Network scanning, Auto Discovery, Mapping and Visualization maps. PRTG offers more than just traditional monitoring solutions for computers and servers, but emerging technologies as well. Examples include IoT, Cloud Services and even environmental monitors.
There are standard measuring tools such as packet loss detection, network traffic monitoring, webpage availability, uptime monitors, NetFlow Analyzers, LAN analyzers, Application Monitoring, ping status monitoring, Active Directory monitoring, and much more.
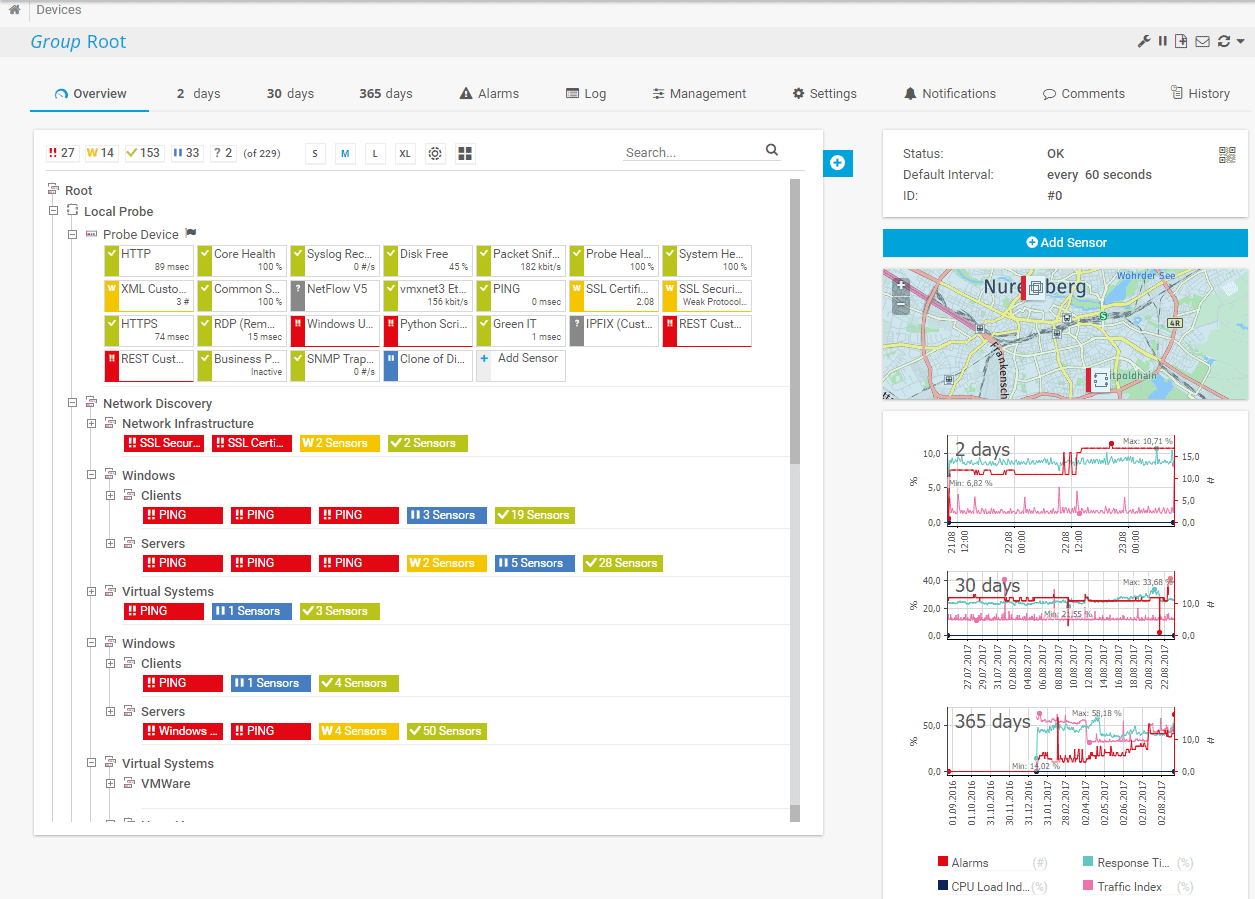
PRTG is a great solution for multiple site configurations, regardless of their geographical location.
This is a really stable tool for modern enterprises, and has made it the popular platform that it is.
PRTG offers a free version for 100 sensors or less, and is even available as a 30 day free trial with unlimited sensors. 500 sensors costs $1,600 , 1000 sensors costs $2,850, 2500 sensors costs $6,150 , 5000 sensors cost $10,500. Unlimited sensors with 1 core server installation costs $16,900 while unlimited sensors with 5 core server installations costs $60,000.
Now onto the Alternatives of PRTG and some of the best ones we've evaluated and used before.
The best Alternative to Paessler PRTG
1. AdRem NetCrunch – FREE TRIAL
AdRem NetCrunch is a strong PRTG alternative, as it offers enterprise-grade features without the complexity of agent setup. It offers real-time visibility into the status of your environment and its potential issues, so you can address them right away.

A highlight of this tool is its coverage. It comes with 680+ built-in templates that can be used for monitoring almost anything in your environment, including traffic flows, logs, and virtual machines. Besides providing detailed visibility, NetCrunch also correlates data from these different sources to provide contextual information for every alert, making it more meaningful and actionable.
We also like its dashboard, as it is clean and intuitive. In particular, we like the way information is presented through charts and displays, as this makes it easy to understand.
Pros:
- Automation: Comes with extensive automations to reduce manual effort.
- Contextual Alerts: Every alert comes with detailed information for quick troubleshooting.
- Scalable: Makes it easy to monitor your growing network.
- Integrations: Works well with most applications.
Cons:
- Learning Curve: Some users may require additional time to understand the tool.
NetCrunch offers custom pricing. Get started by registering for a 30-day free trial.
EDITOR'S CHOICE
Our editors have selected NetCrunch as the top PRTG alternative because it offers multiple capabilities through a single platform when compared to the sensor-based approach of PRTG. As a result, the tool can better correlate information from different sources to provide detailed insights into potential issues. Its intelligent alerting and automation also improve troubleshooting. Lastly, the dashboards are well-designed and present information in a way that’s easy to understand.
Download: 30-day FREE Trial
Official Site: https://www.adremsoft.com/netcrunch/demo/
OS: Cloud-based SaaS
2. Atera – FREE TRIAL
Atera is a good PRTG alternative. This is a cloud-based platform that combines multiple capabilities like remote monitoring and management, agentic AI, patch management, network discovery, and more. All these features make it a one-stop tool for managing your entire environment.

One of the highlights of this tool is its advanced AI features. It integrates with Copilot for AI-powered troubleshooting, scripting, and ticketing. Additionally, its AI technician, called Robin, can address common issues and resolve them. This is particularly critical for IT teams and MSPs that have a heavy ticketing workload.
Another notable tool is the built-in asset management and patching. Since these features work seamlessly together, you can know what endpoints connect to your network, check their security status, and even apply patches to make them secure. Such an integrated approach provides complete visibility and at the same time, eases workloads.
Atera also generates extensive reports that can be used for tracking performance and meeting compliance requirements. Its AI features also record every transaction and interaction, so you can change configurations if needed.
Pros:
- Extensive Integrations: Integrates with most popular platforms, and also works well with Zapier to reach 5000+ applications.
- Customer Support: Offers 24/7 email and live chat support along with an extensive knowledge base of articles.
- Broad Patching: Patches Windows, macOS, Linux, and third-party apps.
- Advanced AI: Comes with many AI tools for improved efficiency and reduced workloads.
Cons:
- Complex for Small Businesses: It can be too complex for small businesses that may not need all the features.
Atera offers four pricing plans (all prices are per technician per month).
- Professional – $149
- Expert – $189
- Master – $219
- Enterprise – Custom
Get started by registering for the free trial.
3. ManageEngine OpManager – FREE TRIAL
ManageEngine OpManager offers a comprehensive network management suite for total network monitoring across multiple vendors relating to enterprise grade IT networks.
It has a unified approach that allows it to scale up while still managing distributed resources across the network.
This allows you and your team to monitor fault and performance issues on the network while monitoring all of your network devices, WAN and VoIP links, servers both physical and virtual (Hyper-V and VMWare supported), your Active Directory ad monitoring software, Domain Controllers, MS Exchange, MS SQL and other IT infrastructure components that require serious monitoring.
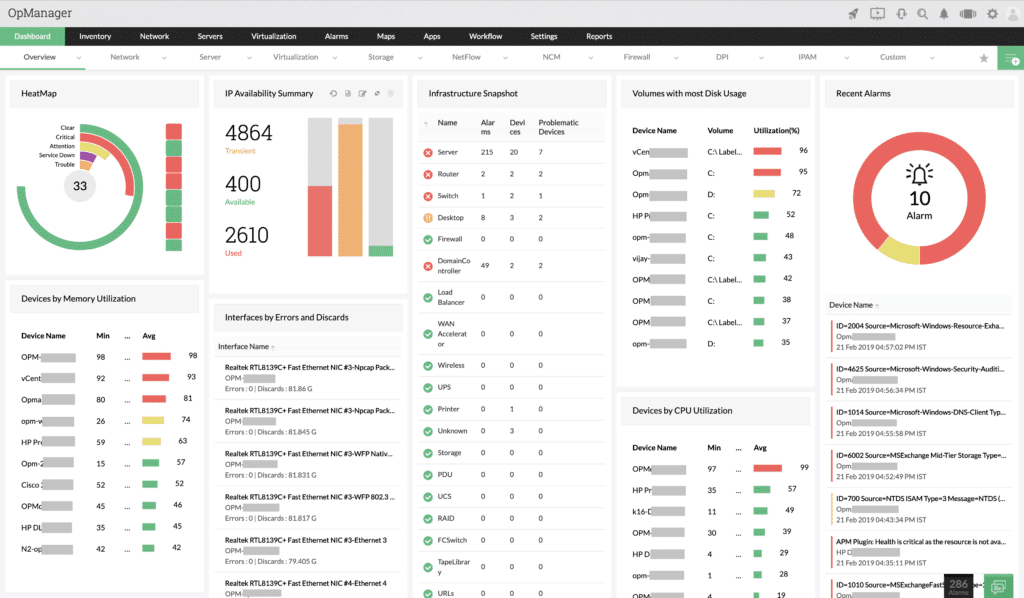
OpManager also lets you view other critical information such as CPU and memory usage, or even thread count or PGSQL database details. This lets you even track the performance of OpManager itself.
When you encounter server performance issues, you can quickly check the standard causes such as CPU utilization, memory usage and disk activity all from the same convenient application window.
Pros:
- Supports a freeware version
- Uses both SNMP and NetFlow for monitoring giving it more coverage options than other tools
- Can scale easily, Enterprise package supports up to 10,000 endpoints
- Utilizes automatic network discovery to create live inventories and network maps for administrators to track assets and network size
- Viable for both large and small networks
Cons:
- OpManager is dense with features, integrations, and settings, and may take time to fully learn
Interested in trying this out for yourself? Download Below and Get Started Immediately! Gain access to a 30-day free trial.
4. Site24x7 – FREE TRIAL
Site24x7 approaches the same problem space from a different structural model. Instead of building monitoring coverage through selectable sensors, it presents a fully formed observability platform that can then be adjusted through interface customization and extended through plug-ins. This shifts the workload from assembling monitoring components to refining how an already broad system is applied to a given environment.
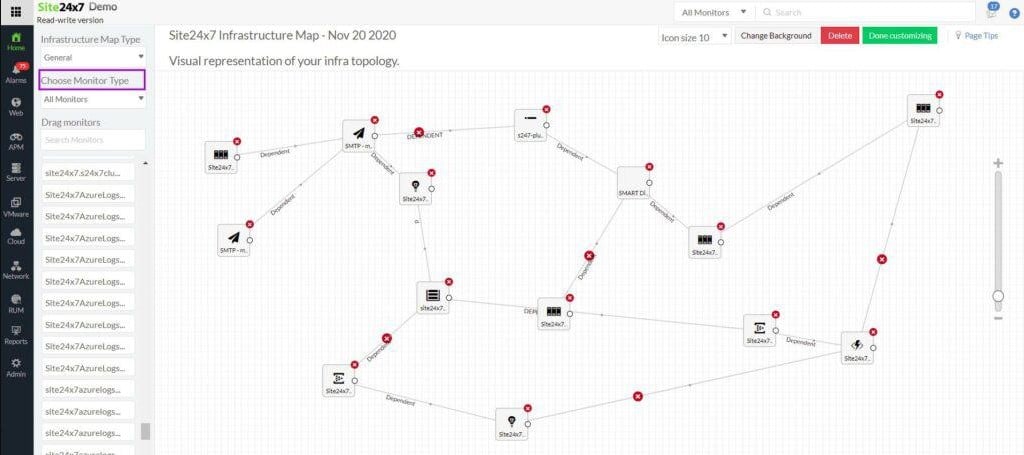
Discovery and documentation underpin that model. The platform identifies devices automatically, builds an inventory, and generates topology maps that continue to update as infrastructure changes. That continuous refresh avoids the drift that can occur when network documentation is maintained manually. Device monitoring is handled through SNMP, including the processing of SNMP traps into alerts, which can be forwarded as notifications through email and SMS.
Traffic analysis and troubleshooting tools are included, allowing administrators to examine bandwidth usage, detect bottlenecks, and assess overall network performance. The platform also extends monitoring beyond internal networks to include internet connections, which helps in diagnosing issues that sit outside the immediate infrastructure boundary.
Where Site24x7 moves further than PRTG is in its treatment of web applications, because it includes both synthetic monitoring and real user monitoring. This provides visibility into how services perform under test conditions and how they behave for actual users.
The platform also follows virtualized environments, including cloud-hosted systems, virtual networks, and VPNs, which aligns it with modern infrastructure patterns. In these areas, it matches PRTG’s ability to monitor technologies such as voice services and virtual LANs, while adding broader application-level insight.
Pros:
- Automatic discovery, documentation, and topology mapping
- Server monitoring, including storage systems
- Traffic flow analysis across network links
- Web application monitoring with code profiling and distributed tracing
Cons:
- No on-premises deployment option
Site24x7 is delivered as a SaaS platform, matching the cloud deployment model of PRTG but without offering an on-premises equivalent. Infrastructure Monitoring starts at $9 per month, and the MSP edition starts at $35 per month. Get a 30-day free trial.
5. Nagios XI
Nagios is a comprehensive IT infrastructure monitoring tool that provides you with monitoring for all of the mission critical infrastructure items that you have on your network such as applications, services, operating systems and network protocols.
This allows the system to gather system information and metrics about your environment, and lets you know how the overall health of your network infrastructure is doing.
Add to this the fact that there are hundreds of third party add-ons that have been created to provide monitoring of nearly all software applications, systems and services, and you have a monitoring solution that gives you incredibly detailed views into your infrastructure’s health.
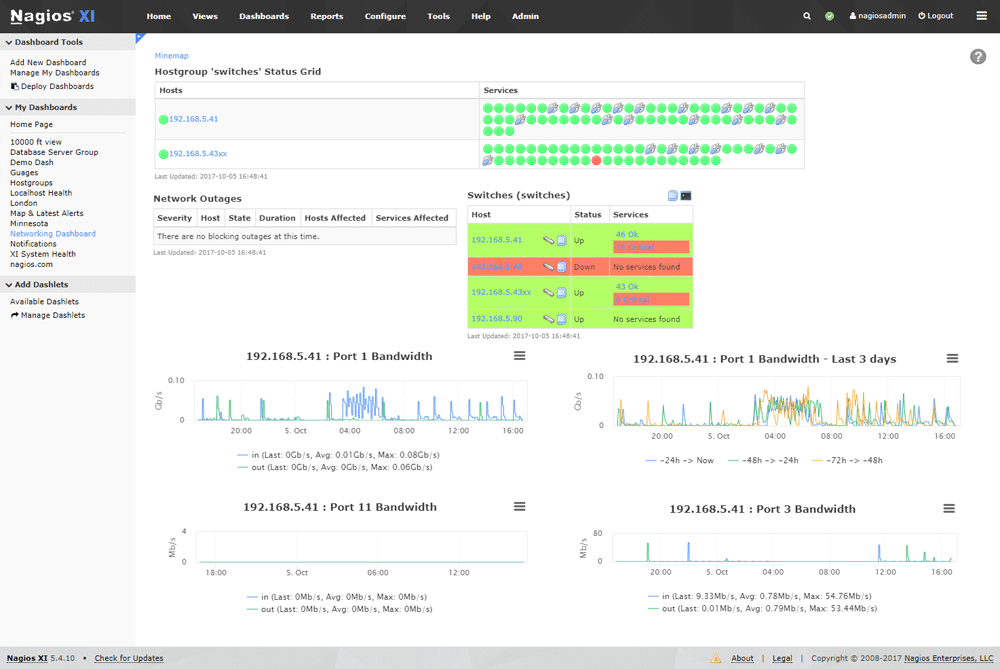
Nagios XI works really well because it has been designed with performance in mind. It runs Nagios Core 4, a monitoring engine that is powerful and efficient, giving the application enhanced performance. This also allows it to scale incredibly well, without too much performance loss.
Perhaps the greatest feature that will be appreciated by your system administrator is the visibility that Nagios XI offers. It provides a central view of the entire IT operations network, as well as the business processes.
Pros:
- Simple, yet informative interface
- Flexible alerting options support SMS and email
- A wide range of community-designed plugins are available for free
Cons:
- The open-source version lacks the support found in paid products
This is all displayed via detailed dashboards, which provide an at-a-glance perspective on how things are running at any time. A download link can be found here for anyone wanting to try it out for themselves.
Standard Edition starts at $1,995 but further pricing can be found here.
6. SolarWinds Network Performance Monitor
SolarWinds Network Performance Monitor has been designed with network administrators in mind, and helps to reduce network outages and downtime.
It offers multi-vendor support for different network hardware, network insights for deeper visibility as well as intelligent maps that highlight problem areas that need to be looked at.
SolarWinds Network Performance Monitor lets you track all of the most important metrics on the network, and will show you how transfer speeds and connections are currently performing, alerting you if there are any current issues that need your attention.
This lets you stay in control of problems, sometimes fixing them before they become a problem.
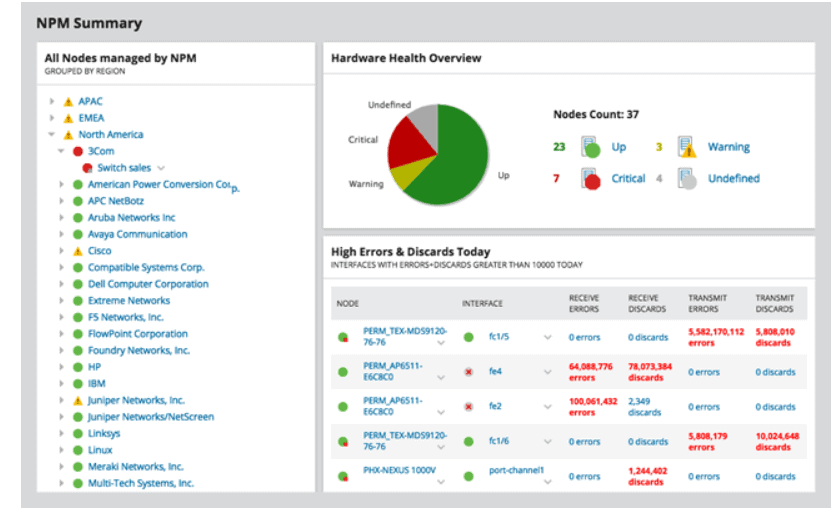
NetPath and PerfStack make the troubleshooting process that much easier, while the system is very good at scaling. As with most of SolarWinds applications, the monitoring and alerting system makes up a large part of the functionality on offer, and it works really well here.
Pros:
- Takes a holistic approach to server performance and health monitoring
- Supports auto-discovery that builds network topology maps and inventory lists in real-time based on devices that enter the network
- Supports both SNMP monitoring as well as packet analysis, giving you more control over monitoring than similar tools
- Uses drag and drop widgets to customize the look and feel of the dashboard
- Robust reporting system with pre-configured compliance templates
Cons:
- Designed for IT professionals, not the best option for non-technical users
NPM has a Fully Functioning Trial that can be Downloaded Now and get your Monitoring within a Couple minutes. You can start with a 30-day free trial.
7. Pandora FMS
Pandora FMS is an Open-source monitoring solution that seeks to offer similar functionality to commercial monitoring software products. It allows you to monitor most components on the network, including servers, switches, computers, and more.
It can monitor Windows, Unix and Linux servers, and can even monitor your virtual infrastructure as well.
Application monitoring is also possible with Pandora FMS, and configuration is not as difficult as some free and Open-source products.
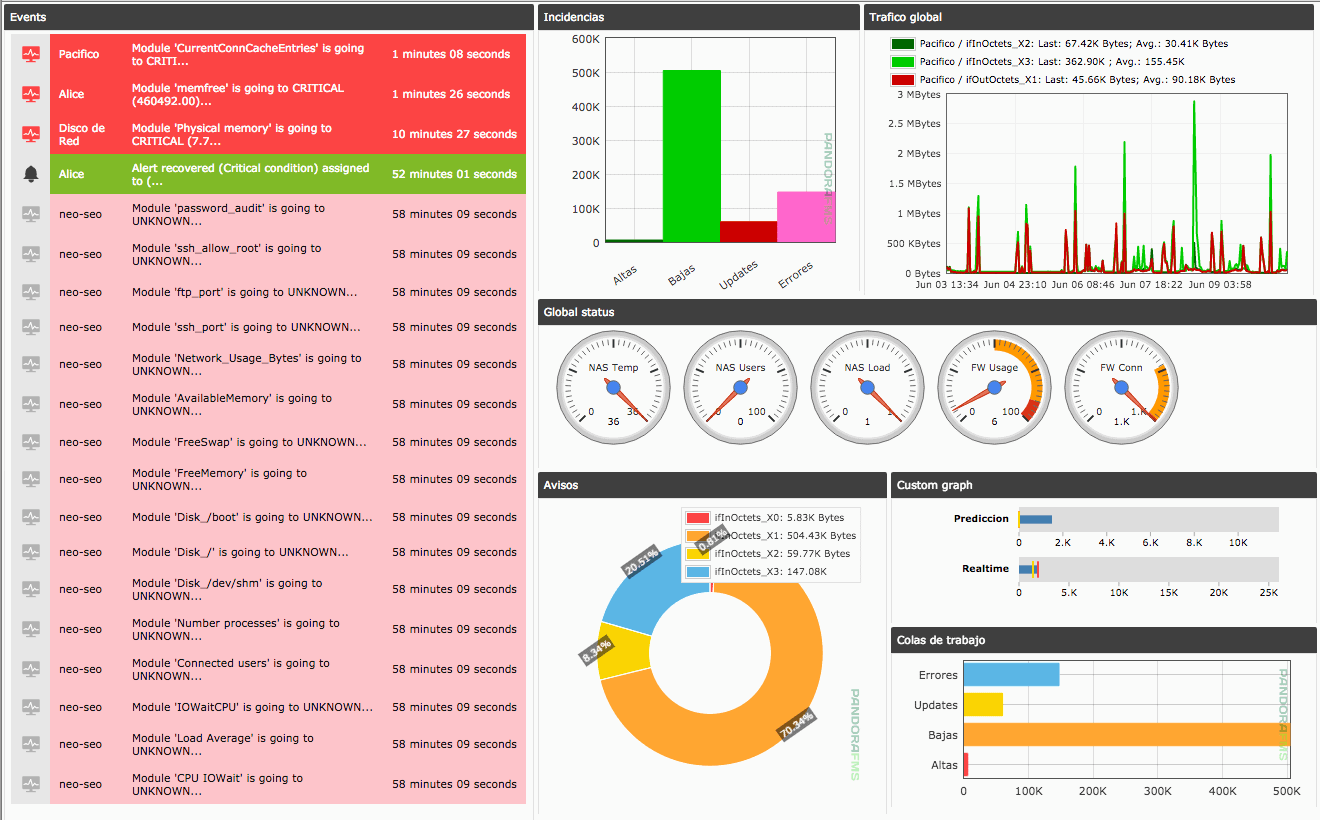
Perhaps the biggest advantage the Pandora FMS offers its users is compatibility, allowing it to work with a whole host of free tools such as NGINX, docker, MySQL, Apache and more.
Pandora FMS also has performance and availability features that make events, graphs and SLA possible, as well as full reports and dashboards for you to view.
It uses different network technologies to allow it to scan the network such as SNMP v3, SNMP Traps, WMI, Remote Plugin Execution, Network discovery and Network Maps.
There are agent and agentless monitoring tools for Windows, Linux and Unix, as well as Android.
Pros:
- Works alongside Pandora NMS for additional address management functionality
- Supports patch management, making it a more complete tool than other managers
- Can group LANs with other non-VPN WANs into a single group for easier management
- Open-source with paid version
Cons:
- Outdated interface, visualizations are lacking and nested menus can be overwhelming at scale
Application monitoring allows you to keep an eye on SAP, Oracle, Tomcat, MySQL, DB2, JMX, IIS, Hyper-V. Those wanting to download this impressive tool can find the link here. Pandora FMS is free and Open-source.