
Have you experienced computer/laptop freezes?
You're in the middle of something and your computer refuses to respond to your actions. What's the first thing you do?
Well, besides getting angry and frustrated, you will most likely restart the system if you can. Otherwise, you'd wait a few minutes and hope that the computer responds again. Essentially, what you're doing is allowing the system to cool down a bit and handle any thread conflict or other problems that may be happening in the back-end.
Here’s our list of the Best CPU Τemperature Μonitors:
- Atera – EDITOR’S CHOICE An IT management platform that includes CPU temperature monitoring, with live performance tracking and overheating alerts that help keep systems stable and avoid hardware damage. Get a 30-day free trial.
- ManageEngine OpManager – FREE TRIAL A powerful monitoring tool that allows you to stay on top of all your monitoring metrics and their performance. Get a 30-day free trial.
- Site24x7 – FREE TRIAL A monitoring platform that includes CPU temperature tracking within its broader supervision of network devices and endpoints. Get a 30-day free trial.
- Paessler CPU Monitoring – FREE TRIAL A sensor-based monitoring tool where you can add as few or as many sensors you need for monitoring a device. Get a 30-day free trial.
- SolarWinds CPU Temperature Monitoring with Engineer's Toolset The SolarWinds Engineer's Toolset comes with a CPU monitor that tracks critical metrics of your CPU to ensure that it is working at optimal levels at all times. This tool also provides historical and real-time data to better understand the patterns of your CPU usage and health, so you can plan accordingly.
- Open hardware Monitor An open-source tool that monitors fan speeds, temperatures, load, clock speeds, and other aspects of a computer.
- Core Temp A small and powerful program for monitoring temperature and other vital information that can come in handy for staying on top of your devices' health and performance.
- HWMonitor A useful tool for monitoring your hardware and for handling sensor chips.
- NZXT CAM Software An all-in-one solution for monitoring the different aspects of your computer including the performance of CPU, memory, and more.
- HWiNFO A hardware monitoring and analysis tool for Windows and DOS platforms.
- SpeedFan A specialized tool for reading the temperatures, voltages, and fan speeds for Microsoft Windows systems.
- Speccy A freeware utility that gives pertinent information about a computer's hardware and software, so you can stay on top of their performance at all times.
- Rainmeter An open-source desktop customization utility to monitor different metrics, so you can take action accordingly.
- AIDA64 Extreme A hardware detection engine that provides detailed information about installed software and the underlying hardware.
- Real Temp A temperature monitoring program designed to monitor all Intel single-core, dual-core, quad-core, and Core i7 processors.
Most of us don't realize that excess usage can heat the CPU that in turn, can cause the hardware parts, especially the silicon soldered joints to get damaged. It reduces the life of the system and makes it unstable for use.
Generally speaking, around 50 degrees is the ideal temperature for your computer and this could increase to up to 80 degrees when you do CPU-intensive tasks such as gaming, programming, or graphic editing. But anything beyond this is dangerous and could melt your hardware parts. So, you must take a break when your CPU's temperature exceeds about 80 degrees Fahrenheit.
A good way to avoid this overheating is to stay on top of your CPU's temperature, so you can give the system a break before it gets too hot. Besides relying on your hand to monitor the temperature, you can also use CPU temperature monitoring tools that can send warnings when the temperature exceeds the threshold limits.
Our methodology for selecting the best CPU temperature monitor tool:
- Prioritize tools that provide real-time and historical CPU temperature data for comprehensive monitoring.
- Look for solutions with effective auto-discovery features to monitor multiple devices across the network.
- Ensure the tool offers customizable threshold settings for personalized alerts.
- Select tools that reduce manual monitoring efforts through automatic alerts via SMS or email.
- Prefer platforms that offer detailed, customizable reports for better insight into CPU performance.
Let's take an in-depth look into what each of the above mentioned tools offers.
The Best CPU Τemperature Μonitors
1. Atera – FREE TRIAL

Atera is a comprehensive monitoring tool that gives all the insights you need about the performance of CPUs and other devices on your network to help you plan better and to avoid costly downtime and performance issues.
Key features:
- Simple to set up
- Can be customized to meet your needs
- Allows you to define threshold settings
- Gives you the option to run auto-healing scripts as a response to triggered alerts
- Gives a bird's eye view of the entire monitoring activity
- Automatically creates tickets when needed
- Provides the flexibility to snooze alerts

Why do we recommend it?
Atera is recommended for its ease of setup and customization. It allows for automated responses to alerts and provides a comprehensive overview of network monitoring activities, making it a practical tool for managing CPU temperatures.
Who is it recommended for?
Atera is particularly suitable for Managed Service Providers (MSPs) due to its built-in Remote Monitoring and Management (RMM) and Professional Services Automation (PSA) tools. It's also flexible and scalable for multi-tenant environments.
Pros:
- Lightweight cloud-based tool
- Built with MSPs in mind, and includes RMM and PSA tools built-in
- The framework is highly customizable, making Atera extremely flexible
- Can scale and support multiple databases in a multi-tenant environment
- Packaged pricing makes Atera accessible to any size business
Cons:
- Atera is MSP focused, smaller organizations may not use all multi-tenant features
Atera comes in three plans, namely,
- Pro ($79/month)
- Growth ($119/month)
- Power ($149/month)
Get started by registering for a 30-day free trial.
EDITOR'S CHOICE
Atera is our top choice for CPU temperature monitoring because it brings heat tracking into a wider IT management platform instead of treating it as a standalone task. It watches CPU temperatures continuously across devices and warns technicians when readings move past defined limits, giving them time to act before overheating causes crashes, throttling, or hardware damage. The platform also shows how CPU temperature behaves over time, which helps teams spot recurring stress or inefficiencies that affect stability. Because it is cloud-based, administrators can monitor remote systems without being on site, and temperature monitoring sits alongside the rest of Atera’s performance and management tools in one service.
Download: Get a 30-day FREE Trial
Official Site: https://www.atera.com/signup/
OS: Cloud-based
2. ManageEngine OpManager – FREE TRIAL
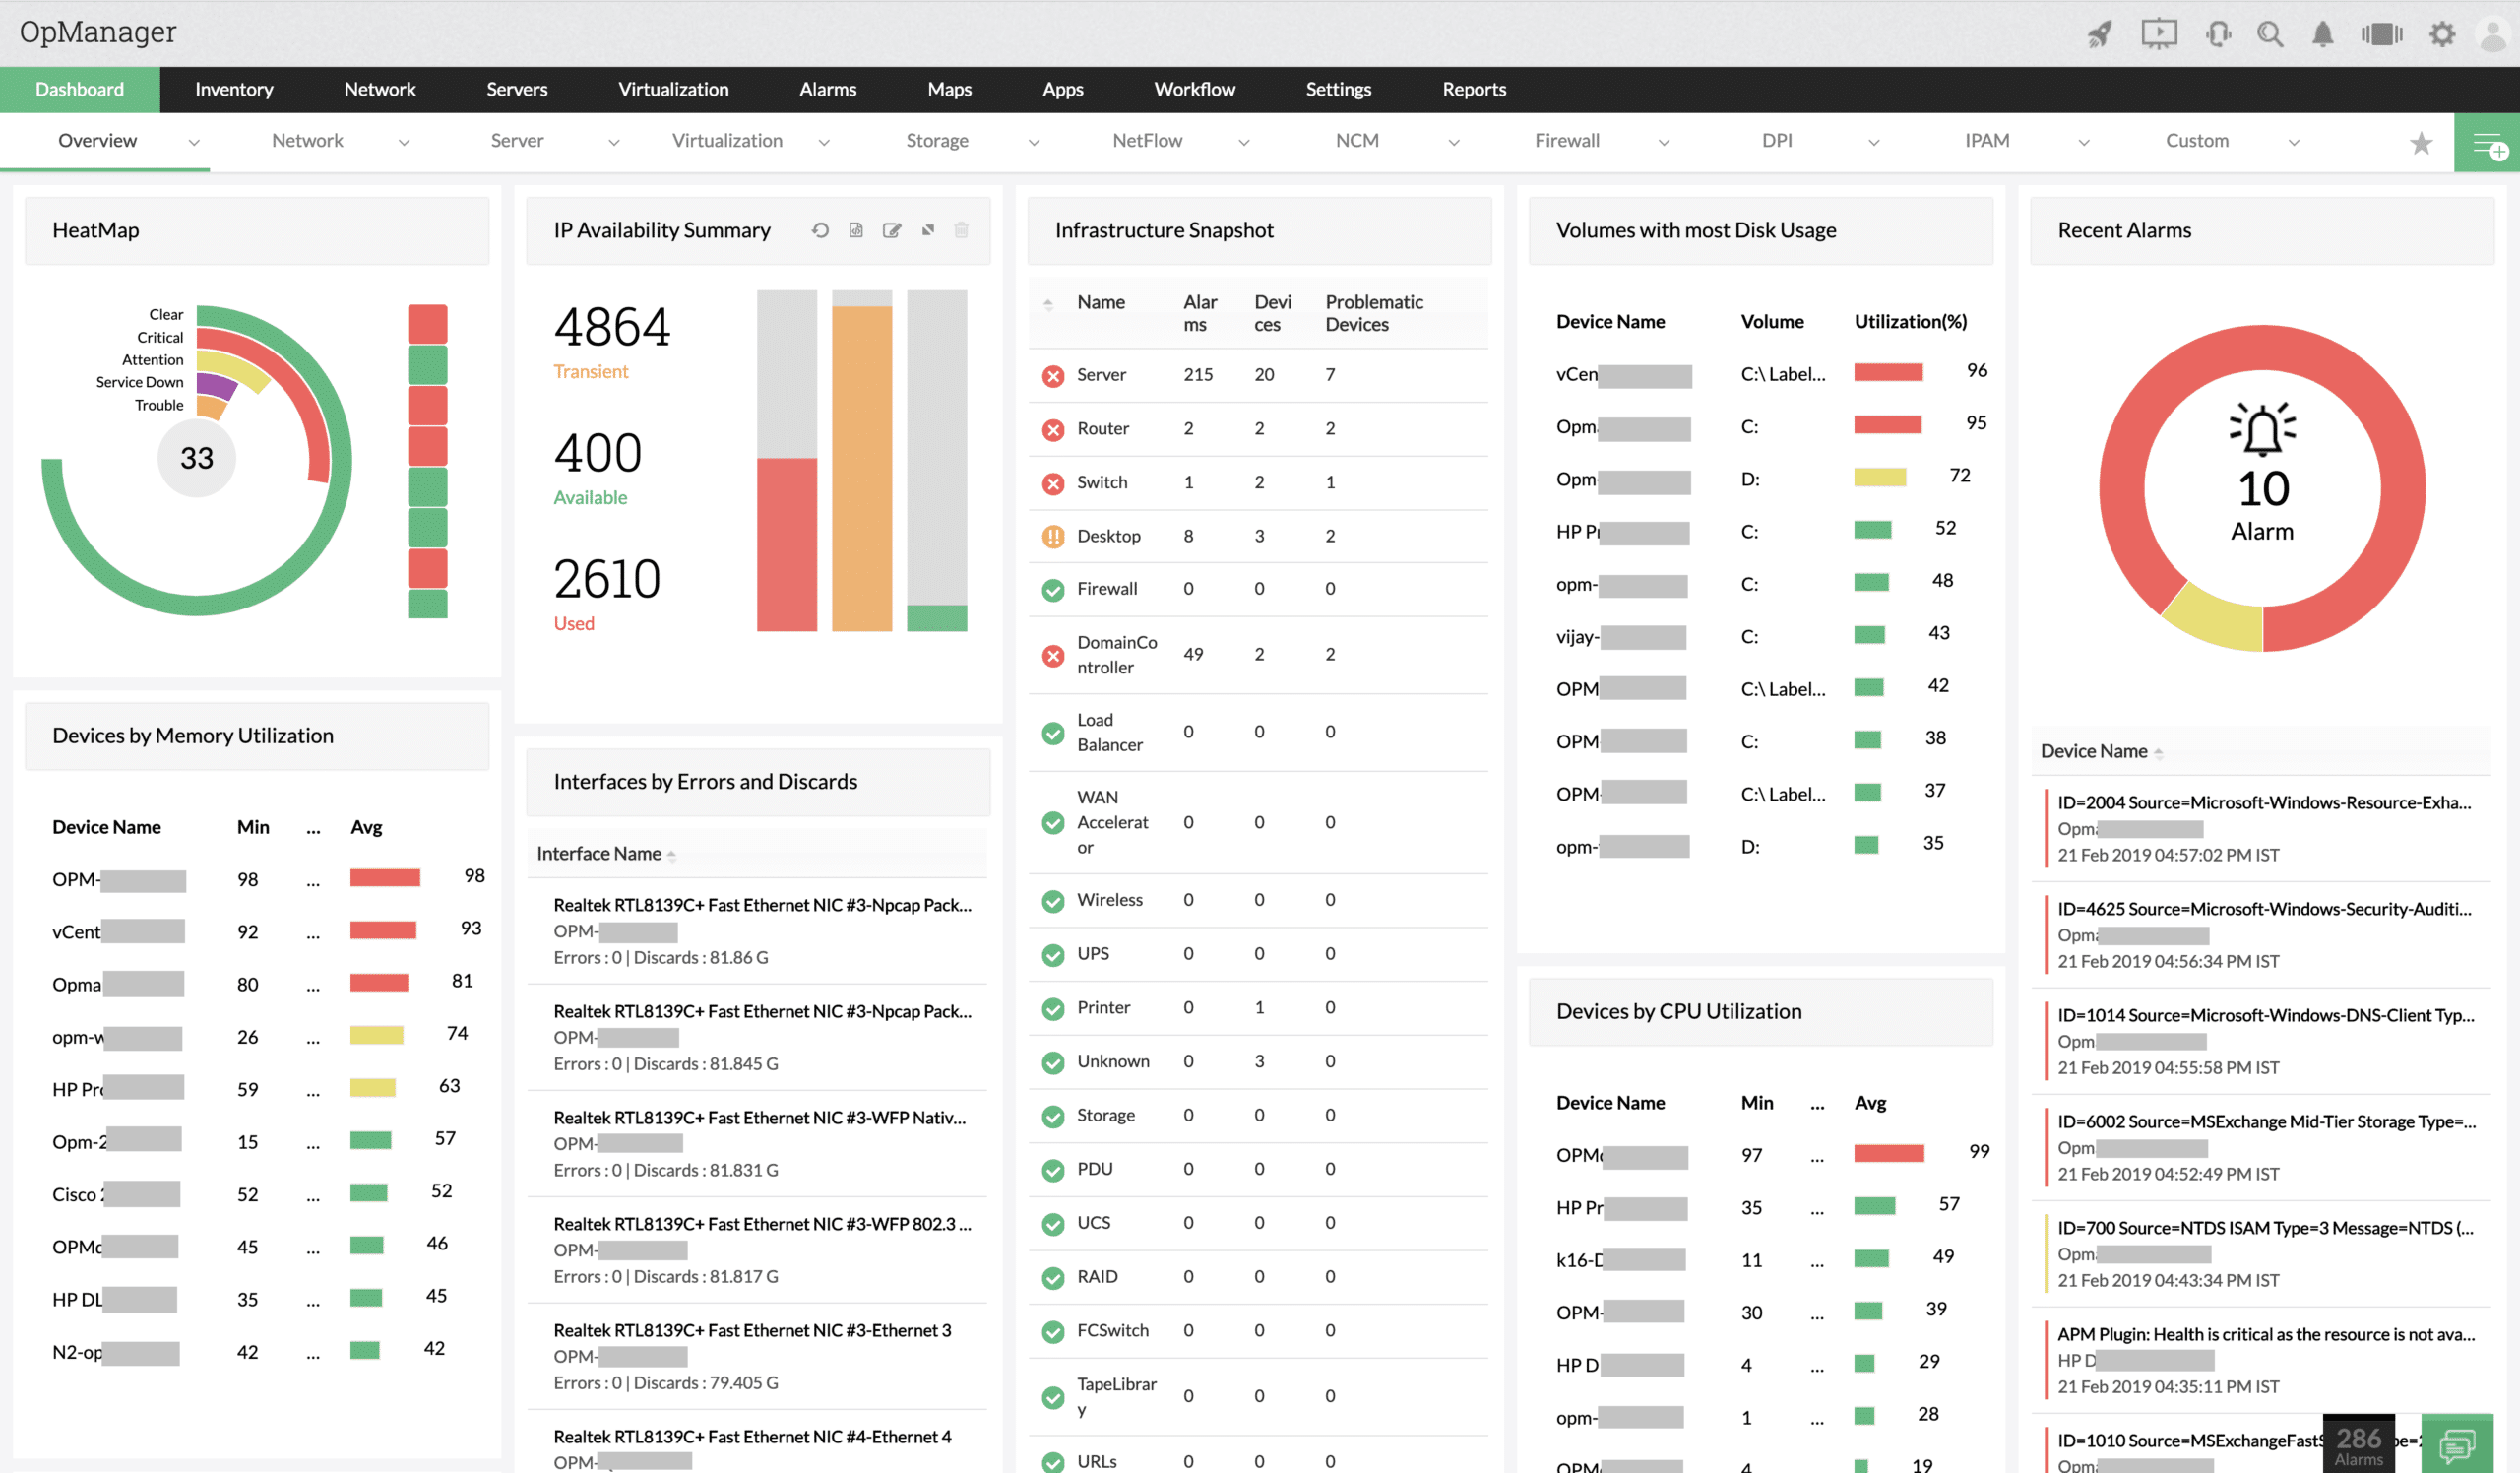
ManageEngine OpManager is a powerful monitoring tool that allows you to stay on top of all your monitoring metrics and their performance. In particular, it monitors the CPU temperature of all devices and sends instant alerts.
Key features:
- Continuously monitors the temperature of all devices in a network
- Sends instant alerts across many channels when the temperature exceeds the established thresholds
- Allows you to remotely kill the background processes to control the CPU temperatures
- DIsplays the temperatures of all devices on the dashboard
- Generates customizable reports to give you a better understanding of the trends
- Supports the creation of a custom SNMP monitor.
- The built-in hardware health report provides a quick view of the overall status
- Available for both iOS and Android devices

Why do we recommend it?
ManageEngine OpManager is an excellent tool for its continuous monitoring of CPU temperature and instant alert system. The tool's ability to remotely control CPU temperatures and its comprehensive dashboard make it a standout choice.
Who is it recommended for?
This tool is ideal for IT professionals managing medium to large networks, thanks to its scalability and automatic network discovery. Its dense feature set also makes it suitable for environments where detailed monitoring and customization are required.
Pros:
- Has a freeware version for testing and smaller network to utilize
- Uses both SNMP and NetFlow for monitoring giving it more coverage options than other tools
- Can scale easily, Enterprise package supports up to 10,000 endpoints
- Utilizes automatic network discovery to create live inventories and network maps for administrators to track assets and network size
- Freeware and paid versions allow for both small and large size networks to effectively use this tool
Cons:
- OpManager is dense with features, integrations, and settings, and may take time to fully learn
Get started with a 30-day free trial.
3. Site24x7 – FREE TRIAL

In Site24x7 CPU temperature monitoring is folded into a broader infrastructure monitoring service rather than treated as a narrow standalone function. The platform follows the condition of servers, workstations, and network devices continuously, which means temperature data is gathered as part of the wider view of equipment health. This gives administrators immediate visibility into thermal conditions and makes it easier to see when hardware is operating safely and when it is starting to move toward risk.
Key features:
- Continuous hardware observation
- CPU temperature tracking alongside other chipset metrics
- Configurable threshold-based alerts
- Support for multi-vendor environments
- Automatic network discovery, documentation, and mapping
- Ongoing performance monitoring
Why do we recommend it?
Site24x7 is recommended because it combines temperature monitoring with automated response. Site24x7 allows administrators to define acceptable temperature thresholds and raises alerts as soon as readings move beyond those limits. That gives teams a chance to deal with overheating before it causes hardware damage, service instability, or system crashes. Site24x7 also places temperature data alongside memory usage, processor load, and disk health, so heat issues can be judged in the context of broader system behavior rather than on their own.

Who is it recommended for?
Site24x7 suits organizations that need to supervise mixed infrastructure without splitting monitoring across multiple tools. It supports a range of server types and network device brands, covers both local and cloud-based systems, and extends beyond physical hardware into virtual systems, applications, and web assets. Because of that breadth, the package is suitable for many different business sizes and operating models rather than a narrow specialist use case.
Pros:
- Delivered as a cloud-hosted service
- Browser-based console available from anywhere
- Retains statistics for historical analysis
- Covers networks, endpoints, and applications in the same platform
- Compatible with many hardware brands and models
- Monitors local, remote, and cloud environments together
Cons:
- No self-hosted deployment option
Pricing varies according to the selected edition and the amount of required capacity. As one example, the Infrastructure Monitoring edition starts at $9 per month. A 30-day free trial is available for evaluation.
4. Paessler's PRTG CPU Monitoring – FREE TRIAL
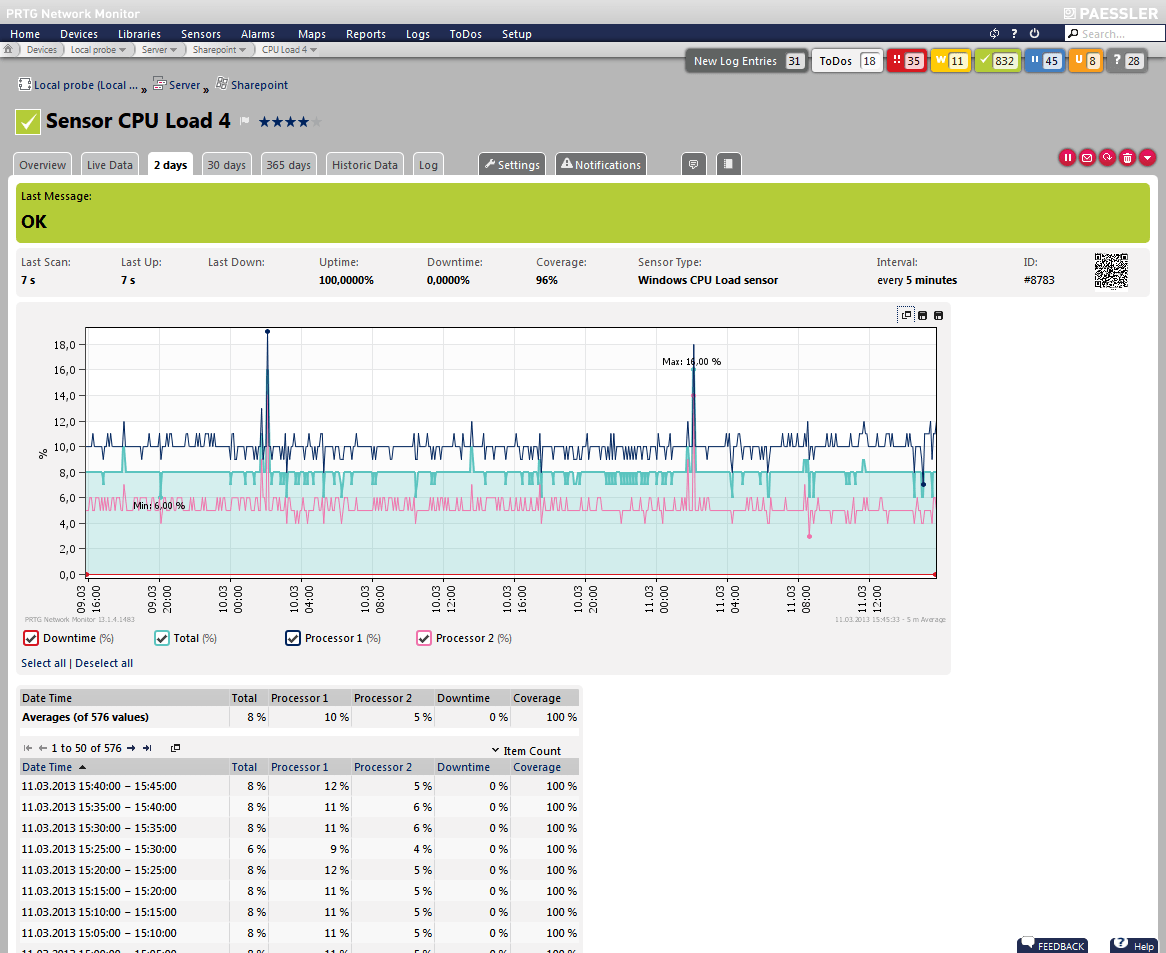
Paessler's PRTG is a sensor-based monitoring tool where you can add as few or as many sensors as you need for monitoring a device. This flexibility to choose what you want at any given time is the hallmark of this tool. For example, you can choose to add a sensor for monitoring CPU temperature and a few days later, can add a sensor for monitoring memory usage.
Key features:
- Helps you to track all CPU and memory metrics
- Ensures the availability and performance of your CPU at all times
- Monitors your CPU's temperature even if the underlying hardware is not conducive for it,
- Gets information about CPU usage and temperature through WMI
- Available in more than 9 languages
- You can monitor Vista computers as well
Why do we recommend it?
Paessler's PRTG is favored for its sensor-based approach, allowing customizable monitoring of various CPU and memory metrics. Its capability to monitor CPUs even in non-conducive hardware environments is a significant advantage.

Who is it recommended for?
This tool is ideal for network professionals who need a customizable and scalable monitoring solution. Its freeware version is especially suitable for small businesses, while its sensor-based pricing makes it a good fit for larger networks.
Pros:
- Offers hardware monitoring as well as network and application monitoring
- Sensors are highly configurable, allowing for monitoring of custom-built devices
- The Freeware version supports 100 sensors, great for small businesses
- Pricing is based on sensors in use, making it a good fit for both small and large networks
- Autodiscovery makes mapping large networks with lots of devices fast and efficient
- Great options for companies looking to monitor all aspects of their IT system
Cons:
- Is designed for network professionals, can take time to learn all features offered on the platform
The cost depends on the number of sensors you use, and the first 100 are free. Click here for a free download for 30 days, after which it reverts to the free version.
5. SolarWinds CPU Temperature Monitoring with Engineer's Toolset
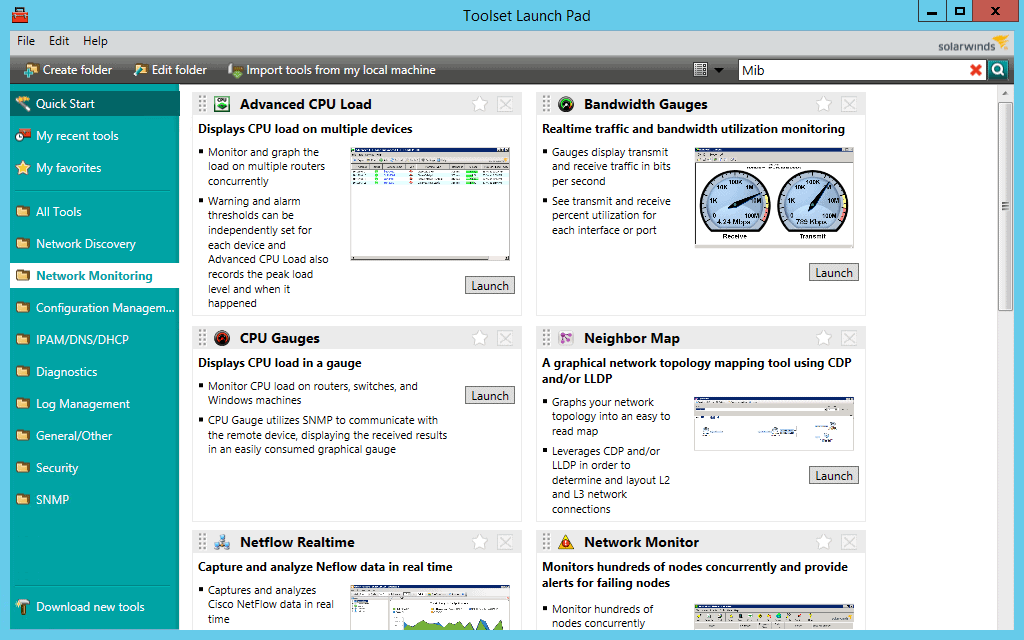
The SolarWinds CPU Temperature Monitoring with the Engineer's Toolset tracks critical metrics of your CPU to ensure that it is working at optimal levels at all times. This tool also provides historical and real-time data to better understand the patterns of your CPU usage and health, so you can plan accordingly.
Key features:
- Provides critical metrics about your CPU
- Points to the root cause of the problem, so you can fix it at the earliest
- Comes with powerful autodiscovery features to extend the usage of this tool across the entire network
- Reduces configuration time
- Allows you to define the thresholds
- Sends alerts via SMS or emails
- Eliminates the need for round-the-clock monitoring
- Prevents overload and the resultant damage.
- Offers customizable reports
- Makes it easy to examine granular metrics

Why do we recommend it?
We recommend SolarWinds CPU Temperature Monitoring for its comprehensive tracking of CPU metrics, ensuring optimal performance. Its ability to provide both historical and real-time data helps in understanding CPU usage patterns and preemptively addressing issues.
Who is it recommended for?
This tool is particularly recommended for network administrators and on-site technicians who require a detailed understanding of CPU health and performance. Its powerful auto-discovery feature makes it suitable for monitoring an entire network.
Pros:
- Easy to use, tools are self-explanatory and designed to get the job done quickly
- Includes a suite of other helpful tools, specifically designed for network administrators and on-site technicians
- Aids in device discovery and testing
- Can help verify temperature, functionality, another metrics for different devices
- Can easily export or import results from previous scans
Cons:
- Would like to see a longer 30-day trial time
Contact sales or build your own online quote. You can test out SolarWinds Engineer's Toolset that comes with a CPU monitor free through a fully functional 14-day trial.
6. Open Hardware Monitor

The Open Hardware Monitor is an open-source tool that monitors fan speeds, temperatures, load, clock speeds, and other aspects of a computer.
Key features:
- Supports most hardware monitoring chips
- Reads the core temperature sensors of AMD and Intel processors
- Displays the temperatures of ATI and Nvidia video cards and SMART hard drives
- The values are shown on the main window of the tool and in a format that's easy to understand
- Comes with a customizable desktop gadget
- Runs on 32 and 64-bit Windows
- Supports Windows XP, Vista, 7, 8, 8.1, and 10, besides any x86-based Linux operating systems.
Why do we recommend it?
Open Hardware Monitor is recommended for its comprehensive monitoring capabilities, including fan speeds, temperatures, and load, across various components. Being open-source and supporting a wide range of hardware makes it an accessible choice.
Who is it recommended for?
This tool is best suited for home PC users and enthusiasts who need a straightforward and transparent monitoring solution. However, it may not be ideal for business environments due to its lack of a management console.
Pros:
- Is a free open-source transparent project
- Can measure other metrics like fan speed, clock speed, and voltage alongside temperature readings
- Better suited for home PCs and enthusiasts
Cons:
- Only available for Windows
- No management console, cannot monitor multiple machines at the same
- Not ideal for a business environment
This software is 100% free. Click here to download.
7. Core Temp
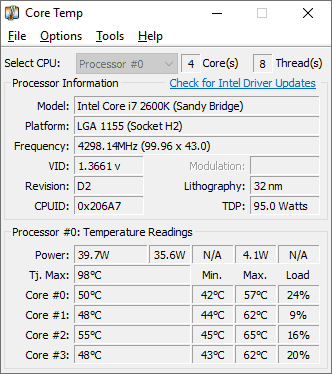
Core Temp is a small and powerful program for monitoring temperature and other vital information that can come in handy for staying on top of your devices' health and performance.
Key features:
- Displays the core temperature of every individual core of every processor
- Shows the temperature fluctuations in real-time
- It works well on all motherboards
- Easy to use
- Enables high levels of customization and expandability
- Provides a platform for plug-ins
- Comes with a color-coded graphical view
Why do we recommend it?
Core Temp is recommended for its ability to display real-time temperature fluctuations of each core in a processor. Its high customization and expandability make it a useful tool for personal use.
Who is it recommended for?
This tool is ideal for individual users or home environments, offering an easy-to-use interface and lightweight design. However, its lack of alerting features may limit its use in larger, more complex networks.
Pros:
- Supports an Android and iPhone app for remote monitoring
- Is completely free for personal use
- Barebones interface makes the tool very lightweight and resources conservative
Cons:
- Relies on a plugin for additional functionality for visuals, would like to see this built into the product itself
- Great for home use, but not detailed enough to support a large network
- Lack alerting features
Click here to download Core Temp for free.
8. HWMonitor
HWMonitor, as the name suggests, is a useful tool for monitoring your hardware and for handling sensor chips. This tool gleans information from these chip sensors and displays them in a way you can understand and make relevant decisions.
Key features:
- Can read voltages, temperatures, and fan speeds of computers
- Handles most of the common chips and sensors like ITE IT87 Series
- It reads temperature's from smart hard drives and most modern CPU versions
- Easy to set up and remove
- Supports Intel Alder Lake and DDR5 memory
- Supports both 32 and 64-bit versions of Windows
- The PRO version supports remote monitoring, graph generator, and even comes with an improved interface.
Why do we recommend it?
HWMonitor is recommended for its ability to read a wide range of metrics including voltages, temperatures, and fan speeds. It’s particularly valuable for its compatibility with a variety of chips and sensor types, making it versatile for different hardware setups.
Who is it recommended for?
This tool is ideal for home labs and smaller networks where detailed hardware monitoring is required. Its freeware nature and the availability of a paid version for remote monitoring make it accessible for a variety of users.
Pros:
- Freeware, with paid options for remote monitoring
- Open-source transparent project
- A great option for home labs and smaller networks
- Available for both Linux and Windows
Cons:
- Interface isn’t customizable making it difficult to track only the metrics you want
- Could use better visualization features when reporting over longer periods of time
HWMonitor comes in free and paid versions. If you choose the one-year plan, it costs 19.95 Euros while the two-year plan costs 34.95 Euros. Click here to download the free version.
9. NZXT CAM Software
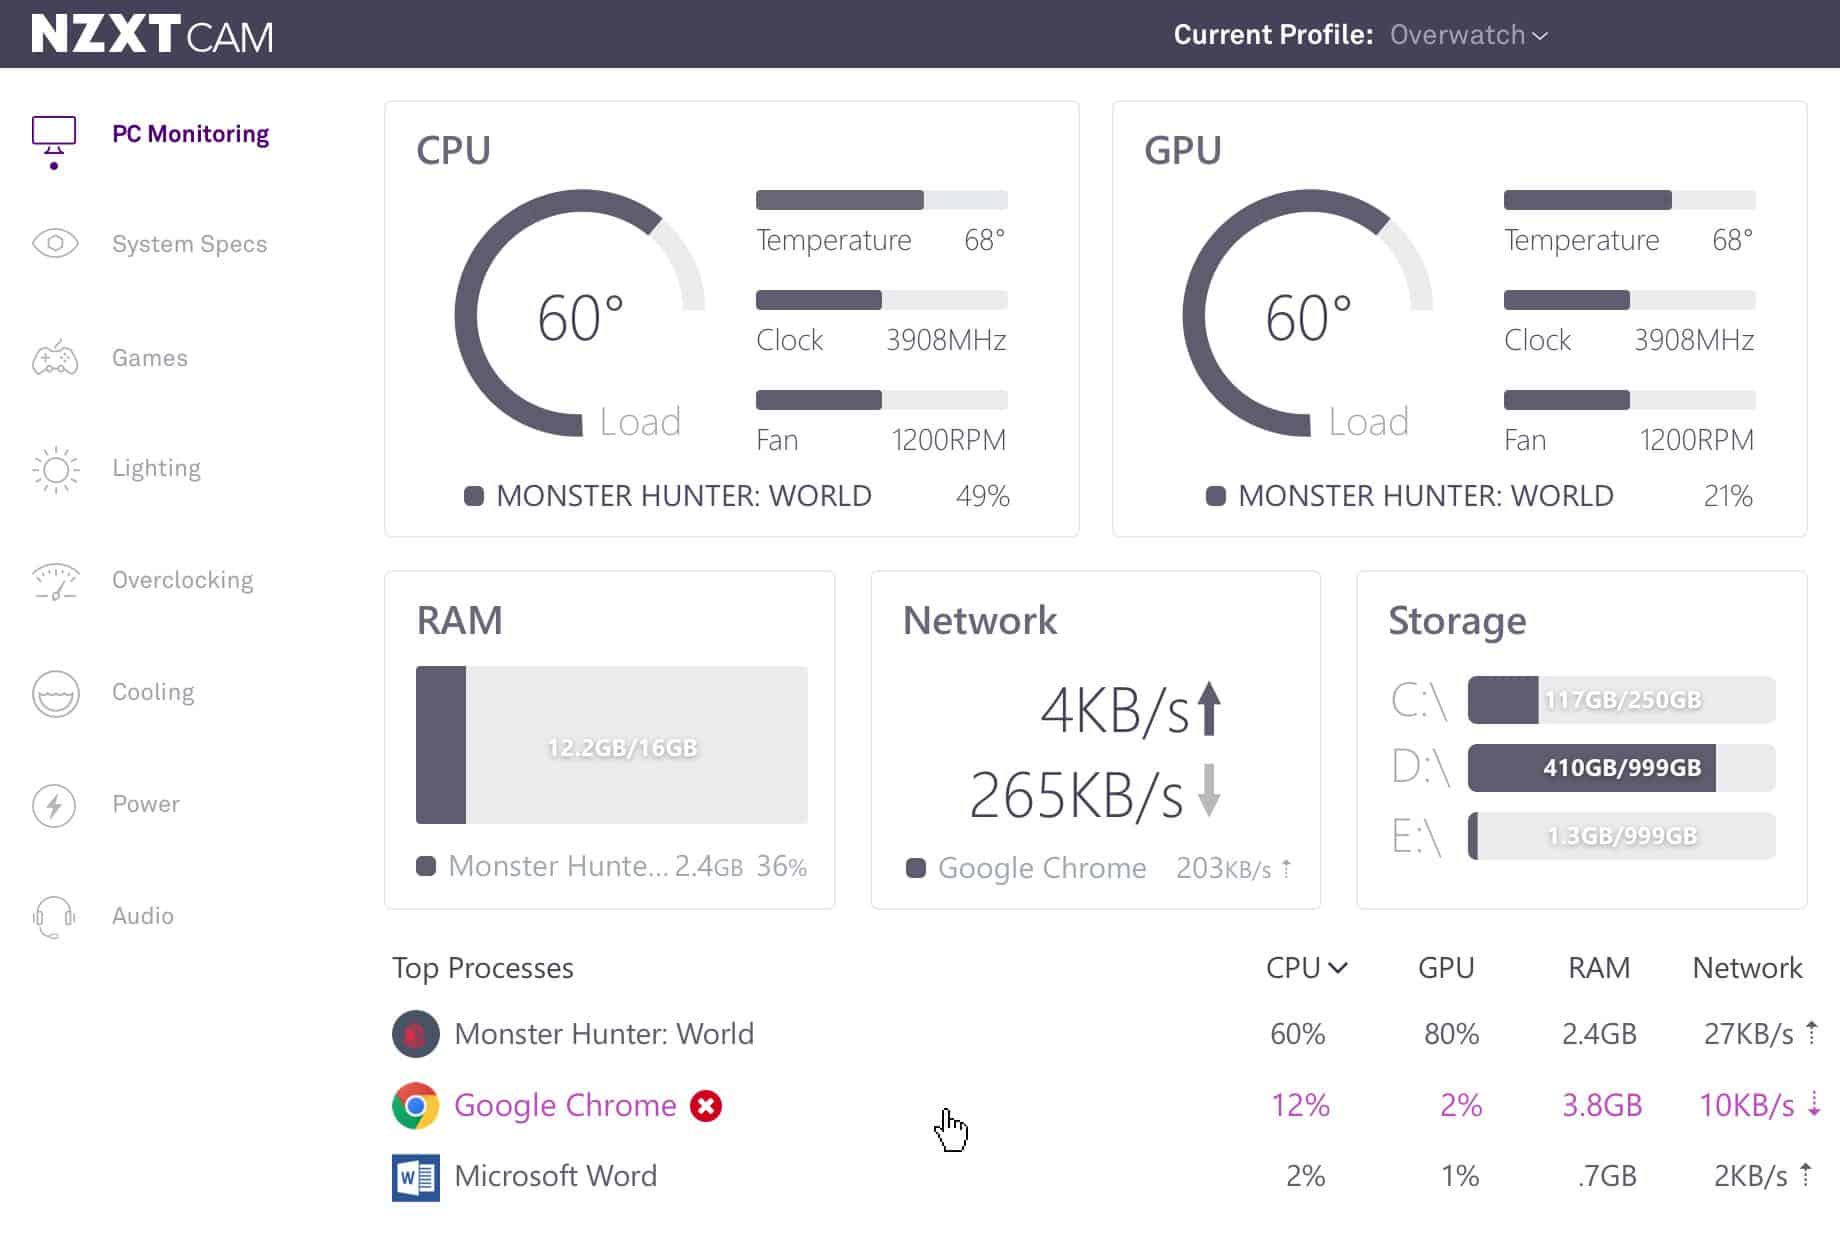
NZXT CAM is an all-in-one solution for monitoring the different aspects of your computer including the performance of CPU, memory, and more. These insights allow you to have maximum control over your computer's health and performance.
Key features:
- Automatically alters the behavior of your computer's lights or fan speed depending on the usage. For example, cooling devices can be ramped up when you're playing a demanding game
- Allows you to schedule CPU resources smartly
- It tracks down issues and performance metrics
- Customizes your settings and syncs them with your profile
- Generates detailed reports that provide a ton of insights

Why do we recommend it?
NZXT CAM is recommended for its comprehensive monitoring capabilities that extend beyond temperature to include fans, voltage, and overall hardware performance. Its automated adjustments based on usage patterns offer a unique and proactive approach to system management.
Who is it recommended for?
This software is particularly suited for users who want an all-in-one solution for monitoring various aspects of their computer, including gaming enthusiasts who need to manage resources during high-demand activities.
Pros:
- Great for monitoring temperature, fans speed, voltage, and other hardware metrics
- Simple yet highly informative dashboard
- Shows top processes that could be contributing to higher CPU usage/temperature
Cons:
- Not ideal for automated monitoring
For now, you can get it for free. Click here to download.
10. HWiNFO
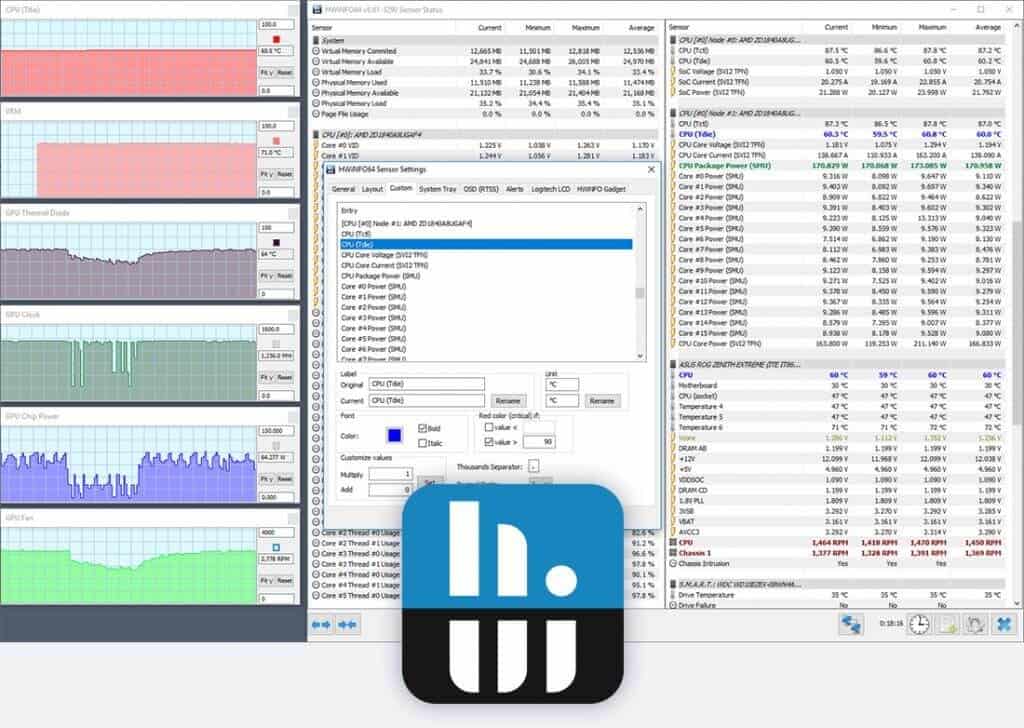
HWiNFO is a hardware monitoring and analysis tool for Windows and DOS platforms. In particular, it's a popular choice for computers in high radiation fields.
Key features:
- Predicts failure with constant monitoring
- Sends alerts in real-time
- Monitors all hardware components in depth
- Supports the latest technologies and standards
- The interface can be customized to meet your needs
- Generates reports in different formats
- Accurately monitors all system components
- Supports all Microsoft operating systems, starting from DOS.
- Displays information in a hierarchical format for easy reading
- Gives a detailed inventory report for capacity planning

Why do we recommend it?
HWiNFO stands out for its extensive detail, including metrics not commonly found in other tools. Its customizability and built-in visualizations are key strengths, making it a comprehensive solution for hardware monitoring.
Who is it recommended for?
HWiNFO is best suited for users who require in-depth hardware analysis, such as IT professionals and enthusiasts. Its detailed reporting capabilities also make it a great choice for users in high radiation fields or other specialized environments.
Pros:
- Extremely detailed, includes metrics not found in other tools like cache sizes, ratio, clocks speed per core, and timing information
- Can track other metrics such as GPU and disk utilization
- Is fully customizable
- Offers built-in visualizations
Cons:
- Lack of proactive features like robust alerting options and inventory management
A pro license is necessary for using this tool in commercial environments and this costs $25. No payment is necessary when used non-commercially. Click here to download HWiNFO.
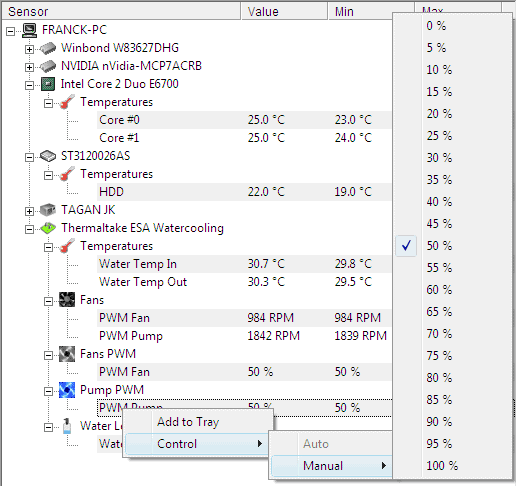
11. SpeedFan
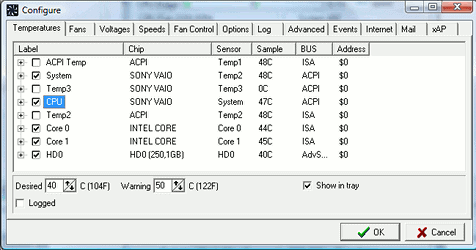
SpeedFan is a specialized tool for reading the temperatures, voltages, and fan speeds for Microsoft Windows systems. It can even alter fan speeds based on your configuration.
Key features:
- Works well on Windows 95 and later versions
- Monitors SMART and SCSI hard disks as well
- Can change the fan speeds on some devices
- Allows you to define threshold values for each device
- Displays a graph of the values to give you a better understanding of the sensor movements.
Why do we recommend it?
SpeedFan is recommended for its specific focus on monitoring temperatures, voltages, and fan speeds. Its ability to alter fan speeds and correlate these with temperature changes makes it a practical tool for individual machine monitoring.
Who is it recommended for?
SpeedFan is ideal for individual users or small networks where detailed monitoring of fans and temperatures is necessary. Its simple installation and immediate metric pulling make it user-friendly, though it may not be suitable for larger networks.
Pros:
- Simple installation that begins pulling metrics immediately
- Built for individual machine monitoring with a simple interface
- Collects S.M.A.R.T data as well as detailed metrics about the status of your machine's fans
- Helps users correlate fans speed with temperature
Cons:
- Not for larger networks
- Lacks long-term monitoring features
- Reporting features could use improvement
Click here to download for free.
12. Speccy
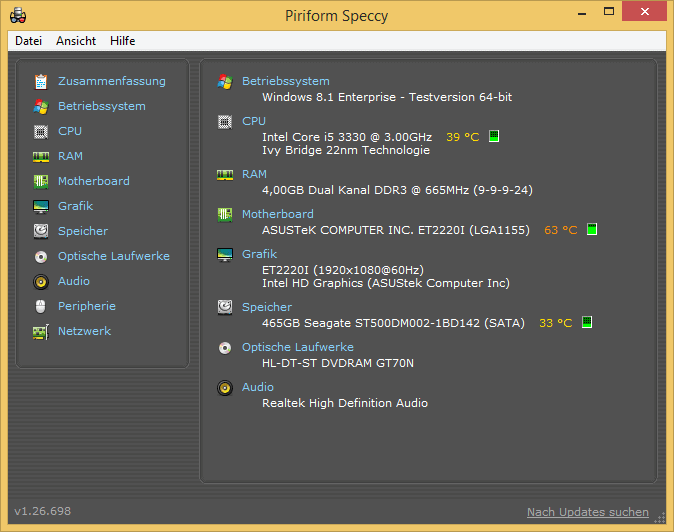
Speccy is a freeware utility that gives pertinent information about a computer's hardware and software, so you can stay on top of their performance at all times.
Key features:
- Fast and lightweight
- Gives detailed reports of all aspects of your hardware
- Provides real-time temperatures of critical components, so you can handle failures before they occur
- Allows you to save the scan results as an XML or text file that can be shared easily
- Gives you the option to have a glance or do a deep dive.
Why do we recommend it?
Speccy is a great tool for quickly gathering detailed information about a computer’s hardware and software. Its ability to provide real-time temperatures of critical components is particularly valuable for preempting failures.
Who is it recommended for?
This tool is recommended for home users or IT professionals who need quick and detailed insights into their hardware. Its freeware nature and the availability of a more feature-rich professional version offer flexibility for different user needs.
Pros:
- Great for quick metrics and manual hardware troubleshooting
- Displays CPU temp alongside other usage metrics
- Displays temperature of other components like hard drives
- Completely free
Cons:
- Lacks automated and continuous monitoring features
Speccy comes in two versions – Free and Paid called Speccy Professional.
The PRO version provides automatic updates and premium support along with advanced PC insights. The company recommends it for home users and it costs $19.95. Click here to download the free version.
13. Rainmeter
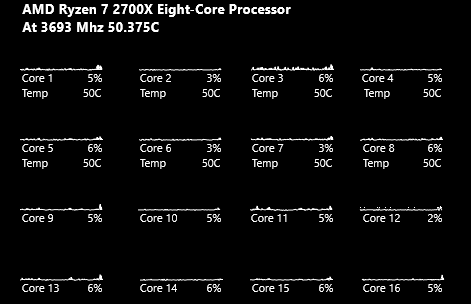
Raimneter is an open-source desktop customization utility to monitor different metrics, so you can take action accordingly.
Key features:
- Uses minimal hardware resources
- Runs on Windows 7 through Windows 10
- Highly customizable
- Measures different metrics such as CPU and memory
- The value of a CPU is shown as a percentage from 0 to 100.
- Generates valuable reports
Why do we recommend it?
Rainmeter is recommended for its minimal resource usage and high customizability. It's particularly useful for tracking CPU, RAM, and disk metrics with a sleek and minimalist design.
Who is it recommended for?
Rainmeter is ideal for users who want a visually appealing and lightweight tool for monitoring basic system metrics on Windows-based systems. Its open-source nature and customization options make it a favorite among enthusiasts.
Pros:
- Sleek minimalist design is both lightweight and nice to look at
- Completely free, open-source, and transparent
- Track temperature, CPU, RAM, and disk metrics
- Can apply custom skins via plugin or premade start pack
- Uses drag and drop menus to customize your dashboard
Cons:
- Lacks a robust reporting feature for long-term monitoring
- Lacks device management capabilities for bigger networks
Click here to download Rainmeter for free.
14. AIDA64 Extreme
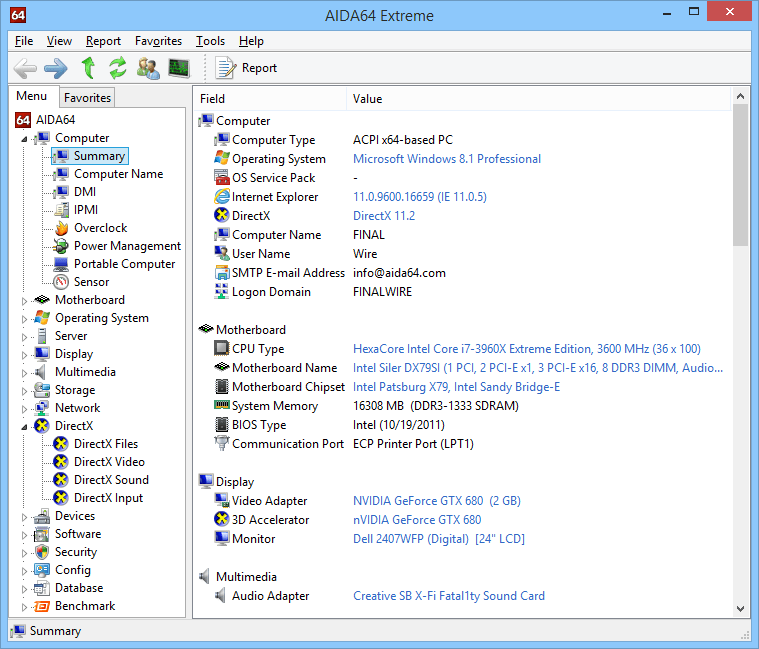
AIDA64 Extreme is a hardware detection engine that provides detailed information about installed software and the underlying hardware.
Key features:
- Monitors temperatures and their fluctuations in real-time
- Identifies diagnostic issues
- Measures individual hardware components or the entire system
- Compatible with all 32 and 64-bit versions
- Provides over 50 pages of information on hardware configurations
- Uses stress testing extensively to monitor different metrics
- Has accurate hardware detection capabilities
- Allows you to build custom panels
- Supports more than 250 devices

Why do we recommend it?
AIDA64 Extreme is recommended for its extensive monitoring capabilities, covering over 250 sensors and providing detailed information about hardware and software. Its stress testing feature is a unique addition for monitoring under extreme conditions.
Who is it recommended for?
This tool is ideal for technicians and advanced users who require highly detailed measurements and diagnostics. Its support for external displays and smartphone apps make it versatile for various monitoring setups.
Pros:
- Monitors temperature as well as virtually all aspects of a devices performance and hardware specifications
- Designed for technicians, outputs very detailed measurements and incredibly detailed with over 250 sensors
- Supports external displays, ideal for network operation centers, or smartphone apps
Cons:
- Would like to see better alerting features with more options
AIDA64 Extreme starts from $39.95 for 3 PCs. Click here to download a trial version.
15. Real Temp
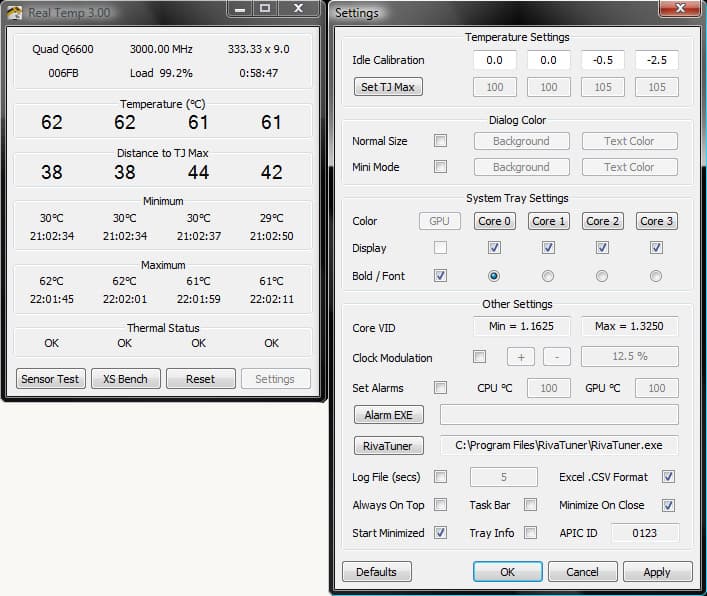
Real Temp is a temperature monitoring program designed to monitor all Intel single-core, dual-core, quad-core, and Core i7 processors. Since each of these cores comes with a digital temperature system, real temp uses this DTS to efficiently monitor the temperature in real-time and give the insights you need.
Key features:
- Reads temperatures from all core processors
- Can individually calibrate for each core
- Uses a Fluke 62 IR thermometer.
- Constantly checks the DTS for any signs of problems
- Quick and accurate
- Sends alarms when temperatures exceed a threshold
- Comes with a shutdown feature
- Doesn't require installation or registry modifications
- Reports and logs thermal activity
- Supports Windows operating systems
Why do we recommend it?
Real Temp is a specialized tool for Intel processors, offering detailed temperature readings and alarms for threshold breaches. Its individual core calibration and real-time monitoring capabilities are particularly notable.
Who is it recommended for?
This tool is best suited for users with Intel single-core, dual-core, quad-core, and Core i7 processors who need precise temperature monitoring. Its lightweight design makes it suitable for smaller networks or individual use.
Pros:
- Simple lightweight tools
- Offers simple logs and reports
- Supports simple alarms for temperature thresholds
- Better suited for smaller networks
Cons:
- Interface could use improvement
Contact the support team for pricing. Click here to download.
Conclusion
CPU monitoring tools are a must-have to ensure that your computer is in optimal health at all times. It becomes all the more important when you use CPU-demanding applications and games that can quickly increase its temperature. Instead of facing freezes and frustrations, install one of the above-mentioned tools to proactively stay on top of CPU temperatures and to prevent them from damaging your hardware.


