
Data centers are complex, and maintaining them requires a team of experts supported with the best monitoring tools. Such a combination can help to proactively identify issues and address them before it impacts the end-users.
Also, they can prevent security lapses and the ensuing financial loss that could potentially run into thousands of dollars.
That said, choosing the right tool is not easy, with the abundantly available choices. Further, you need to pick a tool that best fits your data center setup and business needs. This is why we have come up with some of the best tools available in the market today. Also, these tools tend to be comprehensive and come with a host of features that make them a good fit for most situations.
Here’s our list of the best data center monitoring tools:
- ManageEngine OpManager – FREE TRIAL This comprehensive monitoring software comes with the capability to monitor a wide range of devices in your IT infrastructure and, through it, provide detailed visibility and control over their working. Get a 30-day free trial.
- Site24x7 – FREE TRIAL This cloud platform of monitoring system provides plans that include full stack monitoring tools that makes it an ideal service for data center monitoring. Get a 30-day free trial.
- Paessler PRTG Network Monitor – FREE TRIAL Α powerful monitoring tool that helps you stay ahead of infrastructure issues. It's suitable for businesses of all sizes and requires no additional plugins or downloads. Download a 30-day free trial.
- Datadog Α monitoring and security platform design for modern applications and infrastructure. Hence, it comes with a host of features to efficiently monitor and manage different environments and the applications that run on them.
- SolarWinds Data Center Monitoring This combination of tools is built on a common platform, which enables them to fit together into a complete solution. All modules install on Windows Server.
- NLyte Software Α data center infrastructure management tool that can optimize your critical infrastructure and reduce disruptions through it.
- Kaseya VSA Α unified remote monitoring and management tool that automates management for improved efficiency and gives complete visibility into the working of your IT infrastructure.
- Optimum Path Visual Data Center This unified platform from Appsilan aggregates different data sources to give you insights into the performance of your data center.
- Device42 Αn agentless hybrid cloud dependency and discovery mapping platform that gives a comprehensive view of the state of your infrastructure.
- Zabbix Α free and open-source platform that can be used for monitoring anything such as networks, devices, services, the cloud, and more.
Let's do a deep dive into each of these tools, so you can decide the one that best fits your needs.
The Best Data Center Monitoring Tools
Our methodology for selecting data center monitoring tools and software
We reviewed various data center monitoring tools and analyzed the options based on the following criteria:
- Support for both small and large data center operations
- Support for a variety of common data center servers, hardware, and infrastructure
- A facility to analyze network performance over time
- Alerting and reporting capabilities
- Graphical interpretation of data, such as charts and graphs
- A free trial period, a demo, or a money-back guarantee for a no-risk assessment
- A good price that reflects value for money when compared to the functions offered
1. ManageEngine OpManager – FREE TRIAL
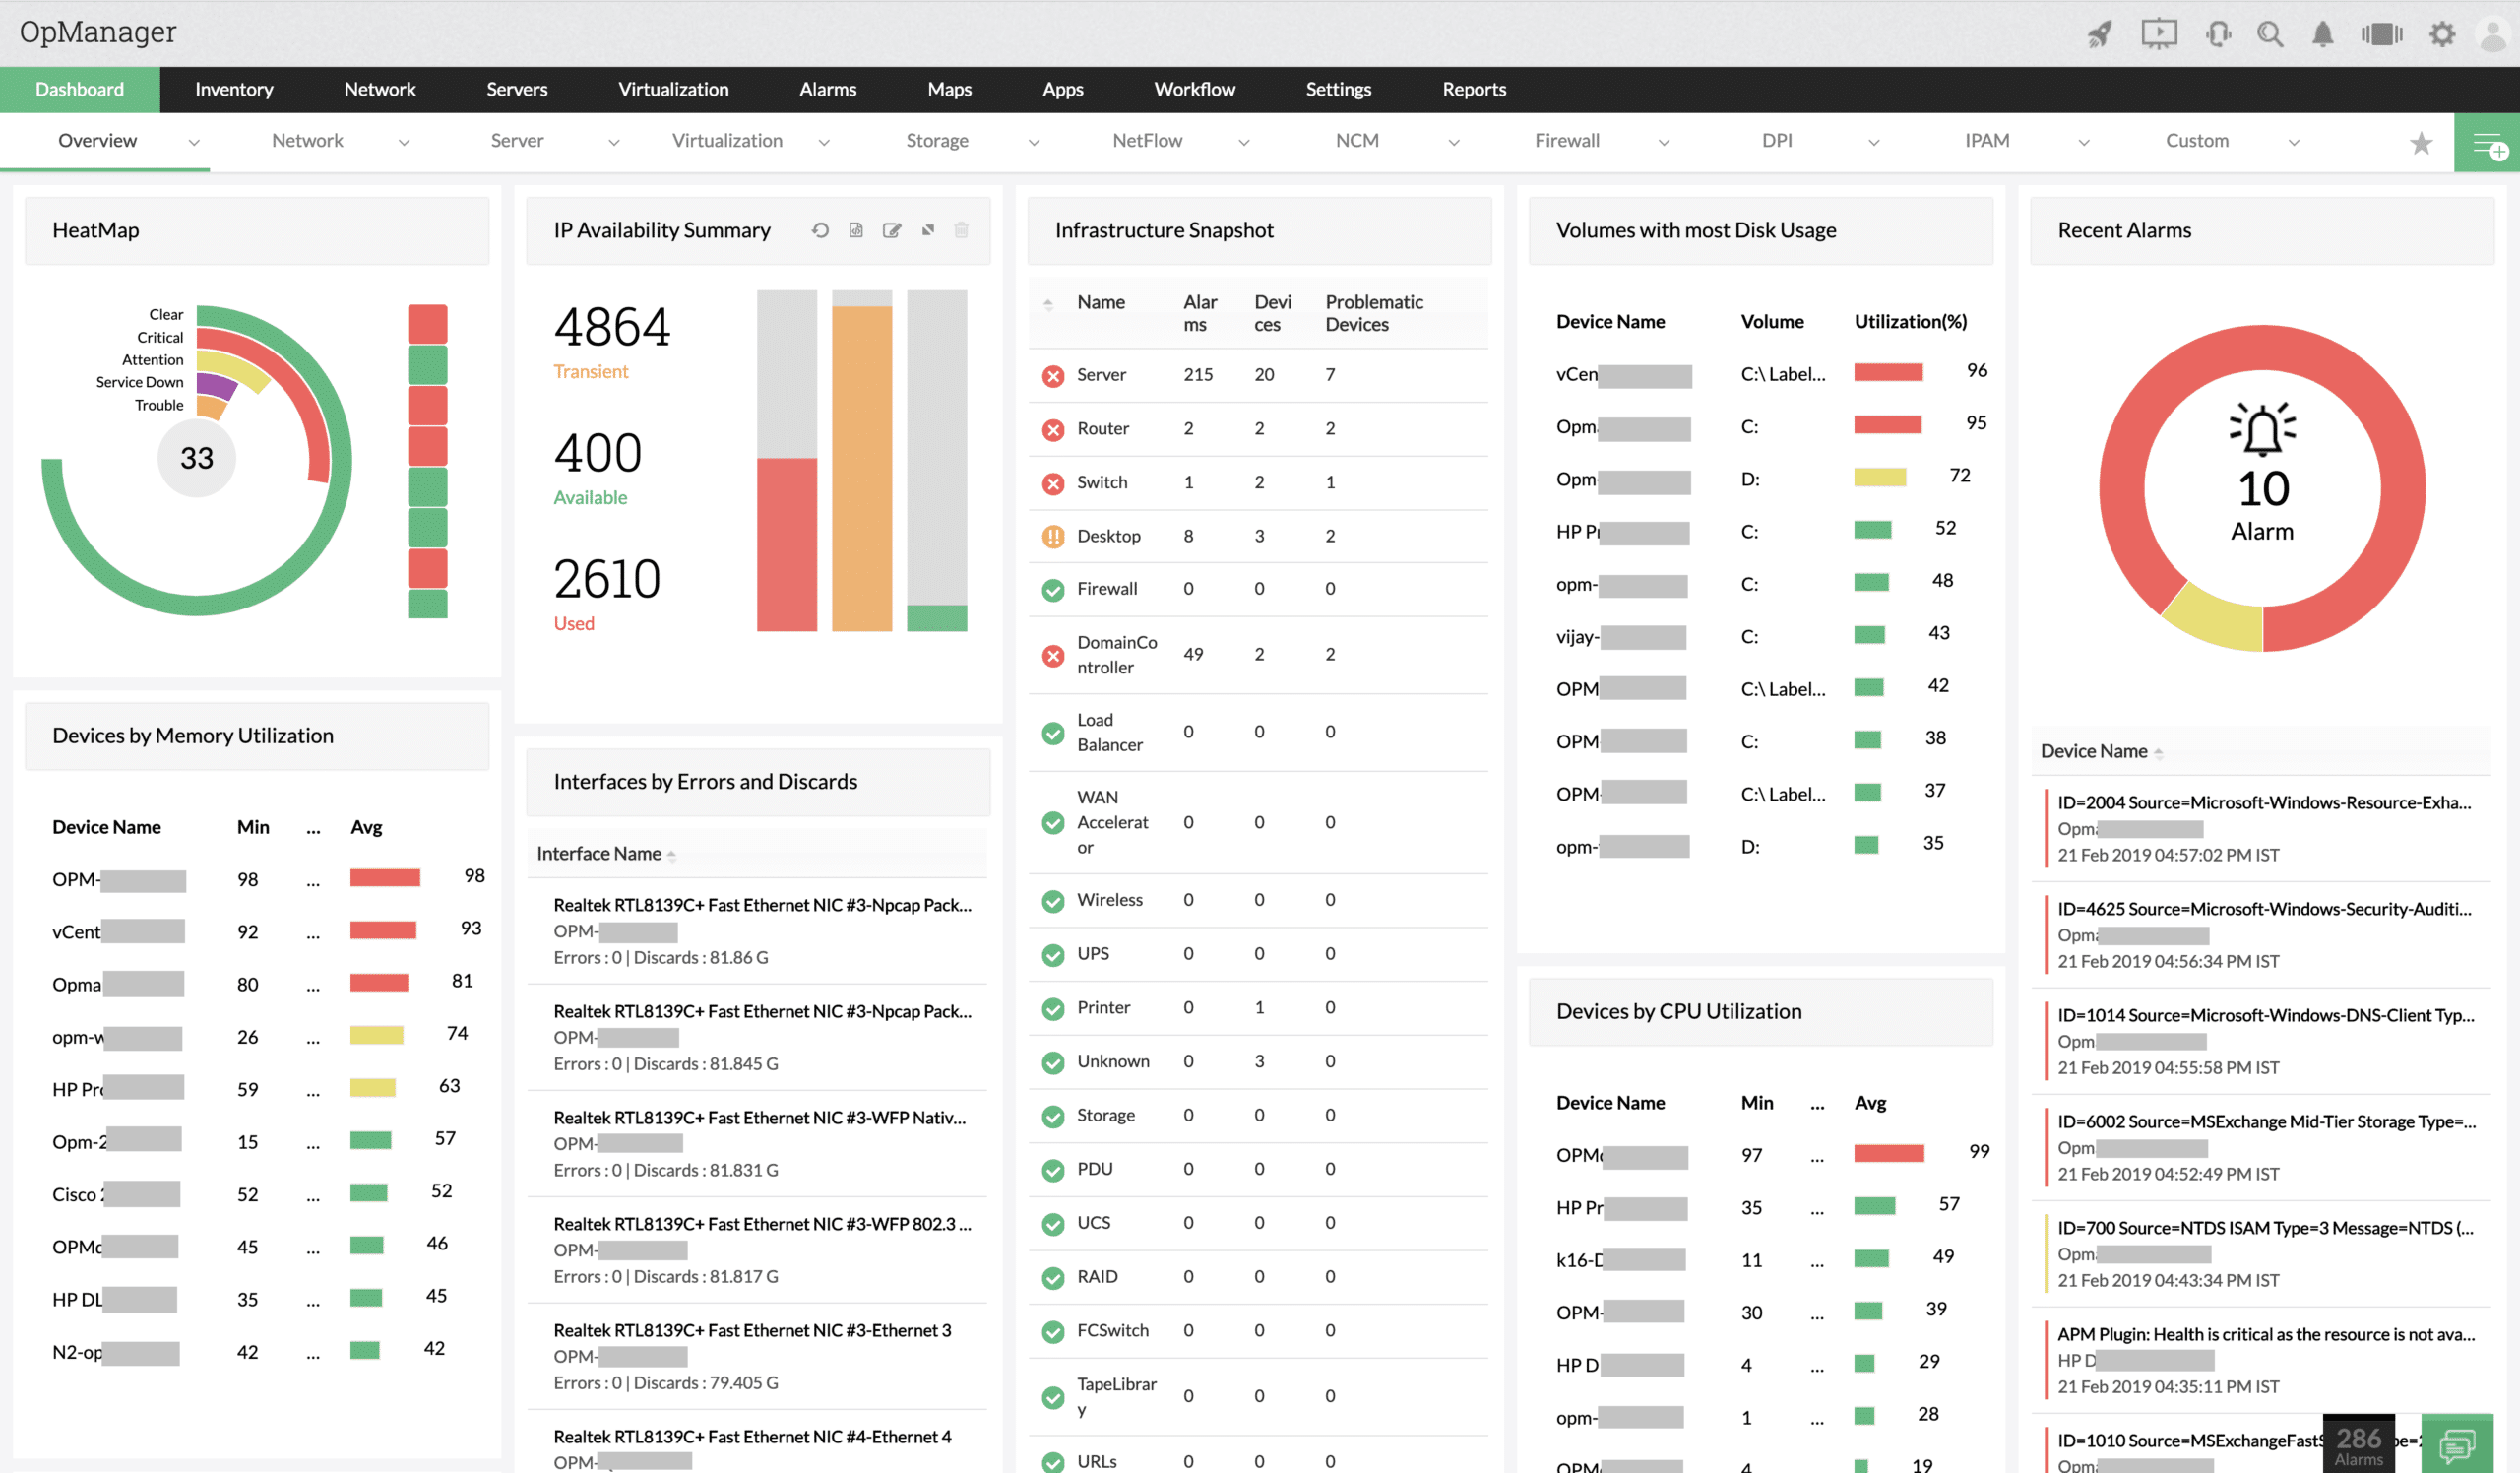
ManageEngine OpManager is a network monitoring software that continuously scans the network to provide in-depth visibility and control over the health and performance of different devices such as routers, switches, workstations, servers, firewalls, and more.
Key Features:
- Monitors critical metrics such as packet loss, latency, speed, and performance bottlenecks
- Works well on Windows and Linux servers and also on virtual servers
- Has multi-level thresholds to stay on top of the performance of your network and all the devices on it
- Comes with customizable dashboards. You can even create one with more than 200 performance widgets, so you can view the metrics just the way you want
- Identifies the root cause of the problem and makes appropriate suggestions for a fix
- No training or additional installations are required
- Send alerts through emails and SMS messages
- Automates the network troubleshooting process
- Uses a rule-based method for analyzing incoming syslogs
- Provides insights into storage capacity and performance for improved optimization
- Integrates well with many plugins and APIs
- Ensures high availability of your network and its devices

Why do we recommend it?
ManageEngine OpManager is recommended for its robust network monitoring capabilities, particularly its use of both SNMP and NetFlow for monitoring, providing extensive coverage options. Its scalability and automatic network discovery features make it a versatile tool for diverse network environments.
Who is it recommended for?
OpManager is suitable for both small and large networks, thanks to its scalability. IT professionals seeking detailed insights into network performance, including packet loss, latency, and speed, will find it highly beneficial.
Pros:
- Supports a freeware version
- Uses both SNMP and NetFlow for monitoring giving it more coverage options than other tools
- Can scale easily, Enterprise package supports up to 10,000 endpoints
- Utilizes automatic network discovery to create live inventories and network maps for administrators to track assets and network size
- Viable for both large and small networks
Cons:
- OpManager is dense with features, integrations, and settings, and may take time to fully learn
OpManager comes in two editions – Standard and Professional. Here's a quick look at the pricing.
Devices and Users | Standard (Perpetual license) | Standard (AMS) | Professional (Perpetual license) | Professional (AMS) |
|---|---|---|---|---|
| 10 devices, 2 users | $245 | $49 | $345 | $69 |
| 25 devices, 2 users | $595 | $119 | $795 | $159 |
| 50 devices, 2 users | $1,095 | $219 | $1,545 | $309 |
| 100 devices, 2 users | $1,995 | $399 | $2,845 | $569 |
| 250 devices, 2 users | $4,545 | $909 | $6,595 | $1,319 |
| 500 devices, 2 users | $7,195 | $1,439 | $9,595 | $1,919 |
| 1000 devices, 2 users | $10,095 | $2,019 | $14,995 | $2,999 |
Get started with a 30-day free trial.
2. Site24x7 – FREE TRIAL
Site24x7 is a cloud platform of monitoring tools that includes coverage for all the different types of assets that a data center would use. The system is delivered as subscription plans that combine all of the units on the platform. You get network, server, application, cloud, and website monitoring plus log management.
Key Features:
- Network discovery, hardware inventory, and topology mapping that repeats continuously to provide up-to-date system information.
- Network device monitoring that tracks the availability and capacity of switches, routers, and network appliances.
- Network traffic statistics extraction from network devices with NetFlow, J-Flow, sFlow, CFlow, IPFIX, NetStream, and AppFlow.
- Network configuration management.
- Software inventory and sever process scanning from a unit that alerts if system resources are insufficient to keep the software running.
- Log collection, consolidation, and filing.
- Server availability and capacity monitoring for processors and file storage systems.
- Application Performance Monitoring (APM) with distributed tracing and code profiling.
- Cloud platform monitoring and management with cost tracking and maintenance scripts
- Service Level Agreement tracking
- Website monitoring with real user monitoring (RUM) and synthetic monitoring

Why do we recommend it?
Site24x7 is recommended for its comprehensive coverage of all types of assets in a data center. Its continuous network discovery, hardware inventory, and topology mapping provide up-to-date system information, making it an efficient monitoring solution.
Who is it recommended for?
This cloud-based platform is ideal for businesses needing to monitor a mix of network, server, application, and website performance. It's especially suited for those requiring integrated log management and application performance monitoring.
Pros:
- Full network performance monitoring traffic analysis
- Server monitoring that identifies resources shortages
- Website monitoring with linked APM and service monitors for root cause analysis
- Subscription plans that combine all of the platform’s modules
- Integrations to provide monitoring for specific asset brands
Cons:
- No self-hosting version
Site24x7 is offered in packages, each of which includes some services of each module in different capacities. Each plan has its own pricing structure with some being offered in many editions. An example package is the Infrastructure plan, which has a starting price of $9 per month when paid annually. Register for a 30-day free trial.
3. Paessler PRTG Network Monitor – FREE TRIAL
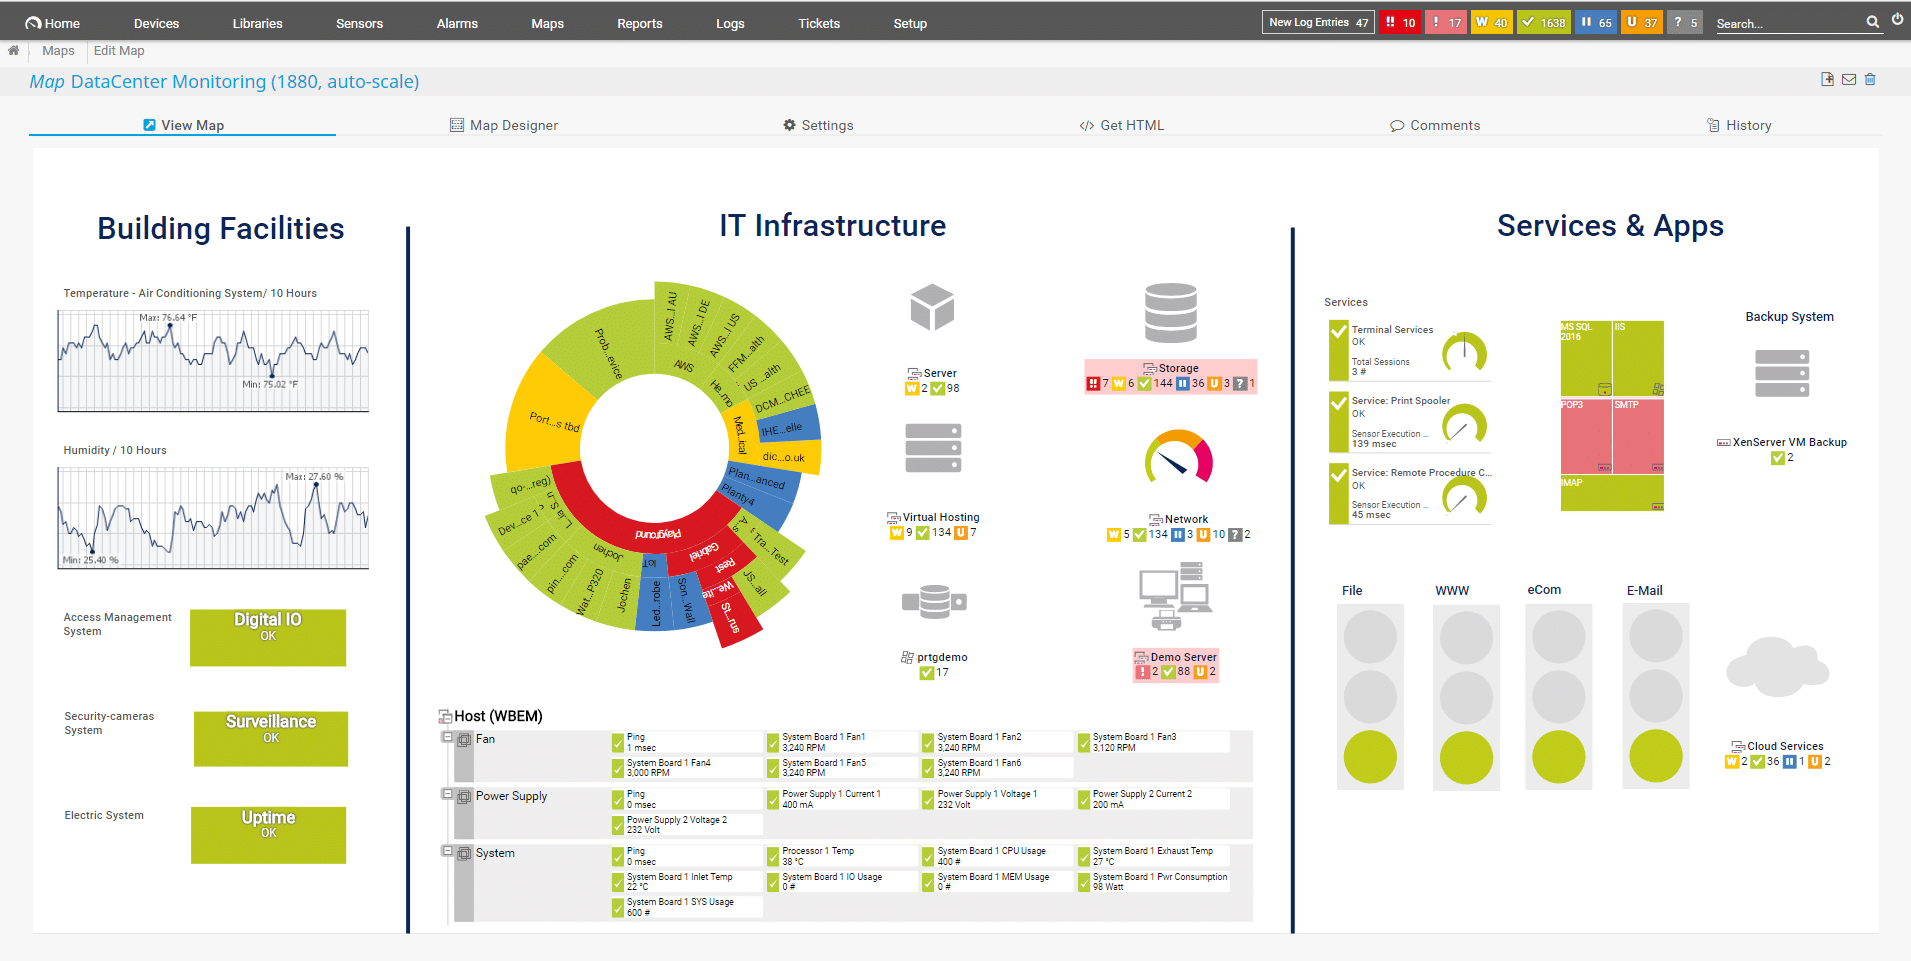
Paessler PRTG Network Monitor is a powerful tool that helps you stay on top of your IT infrastructure at all times. It comes with advanced capabilities to monitor all the systems, devices, applications, and traffic sources on your IT system to ensure that you're aware of all that's happening with your tech stack.
Key Features:
- Provides information on bandwidth usage so that you can plan accordingly. You can also use this information to formulate usage policies, set priorities for applications, and do whatever else is needed to optimize your bandwidth. You can use this information to identify and fix bottlenecks as well
- Monitors data sets from PRTG sensors and SQL queries
- Manages applications and provides detailed information about the working of every application in your infrastructure
- Monitors your cloud resources located worldwide
- Stays on top of the performance, capacity, reliability, and accessibility of all types of servers
- Makes it easy to track your LAN and the various devices that operate in it
- Integrates well with different technologies such as SMTP, HTTP, WMI, REST APIs, and more
- Visually represents all the collected information for easy understanding
- The map designer creates intuitive dashboards with more than 300 different map objects
- Sends alerts when PRTG finds any problems with any application. Specifically, it compares the collected metrics with baseline values and sends a notification of wide discrepancies in values.
- The API can be extended to write your custom notifications

Why do we recommend it?
PRTG Network Monitor is recommended for its advanced monitoring capabilities, including bandwidth usage, server performance, and application management. Its use of packet sniffing, WMI, and SNMP provides a comprehensive view of IT infrastructure health.
Who is it recommended for?
This tool is best suited for IT professionals who need a detailed, real-time overview of their IT systems. Its sensor-based approach is ideal for monitoring specific aspects of network and application performance.
Pros:
- Uses a combination of packet sniffing, WMI, and SNMP to report network performance as well as discover new devices
- Autodiscovery reflects the latest inventory changes almost instantaneously
- Drag and drop editor makes it easy to build custom views and reports
- Supports a wide range of alert mediums such as SMS, email, and third-party integration
- Supports a freeware version
Cons:
- Is a very comprehensive platform with many features and moving parts that require time to learn
Since PRTG is a sensor-based platform, the cost depends on the number of sensors you use, where one sensor is used to monitor a single aspect like memory, CPU usage, etc., of a device.
The current pricing structure is,
- First 500 sensors cost $1,750
- 501 to 1000 sensors cost $3,200
- 1001 to 2500 sensors cost $6,500
- 2501 to 5000 sensors cost $11,500
- Unlimited sensors in one installation cost $15,500
Contact the sales team if you want to have unlimited sensors across multiple installations. Start by registering for a 30-day free trial.
4. Datadog
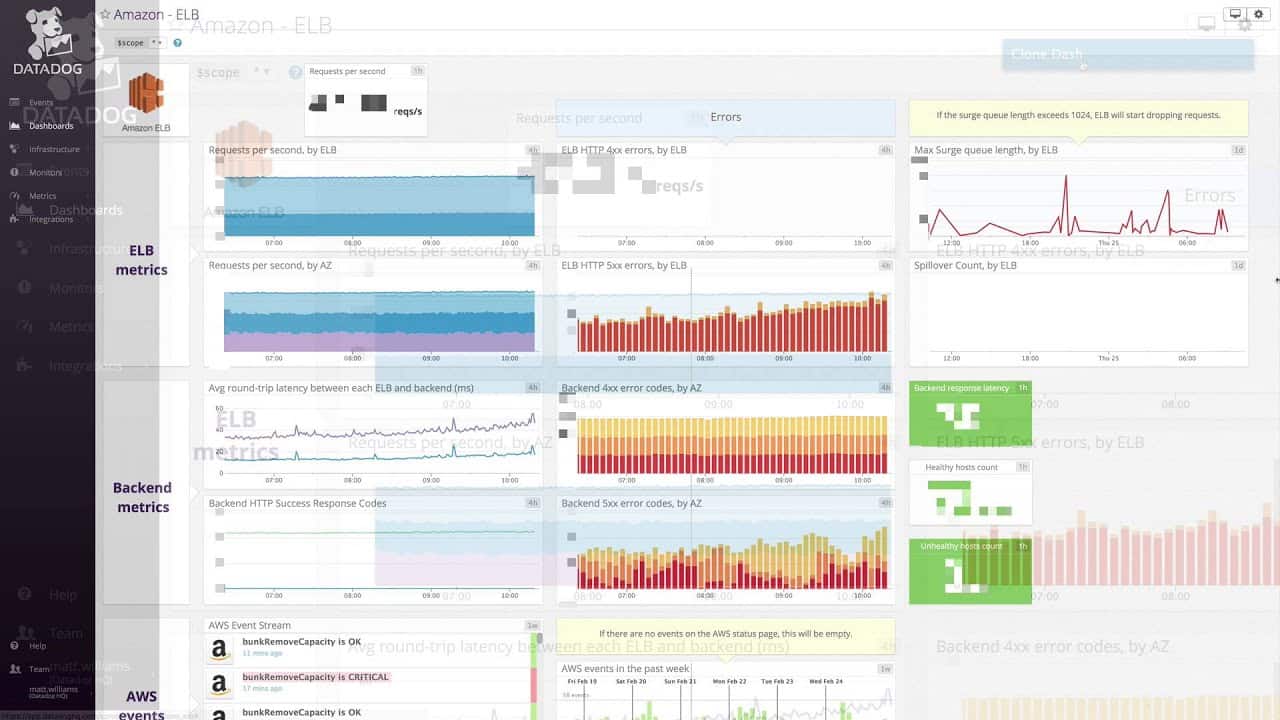
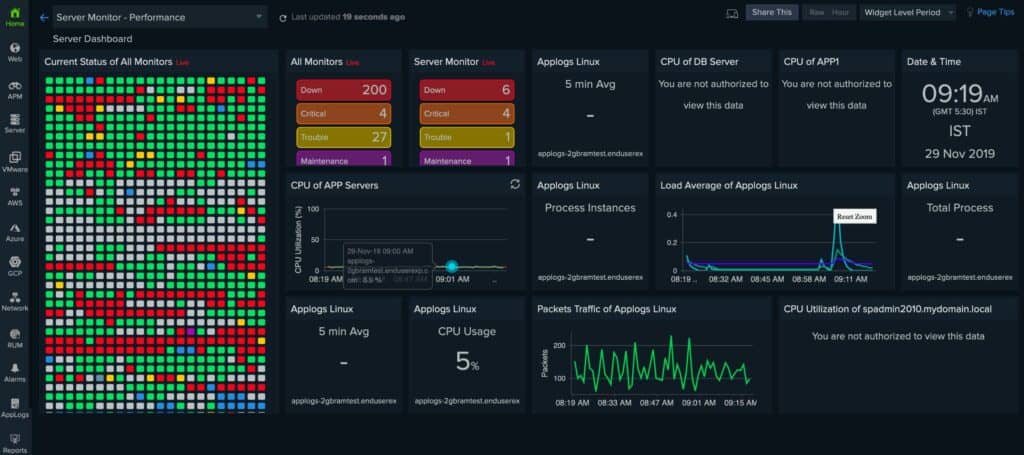
Datadog is an advanced monitoring tool that provides end-to-end visibility across on-prem, cloud, and hybrid environments. Its real-time interactive dashboard and notification systems add to the output efficiency as well.
Key Features:
- Seamlessly integrates metrics and events across the complete tech stack
- Trace requests across distributed systems
- Instruments the code using open source libraries
- Tracks app performance with service overviews
- Collects logs from all applications and devices
- Creates a context for log data
- Detects performance issues and sends alerts on the same when it exceeds established thresholds
- Manages your SLAs and SLOs
- Correlates the frontend performance with business goals
- Visualizes traffic flow in cloud environments
- Reports key metrics
- Enables you to build interactive dashboards in real-time
- Sends a snapshot of potential issues, notifies your team, and helps you have discussions in the proper context
- Provides Restful APIs to extend its functionality

Why do we recommend it?
Datadog is recommended for its end-to-end visibility across various environments, including on-premises, cloud, and hybrid. Its interactive dashboards and efficient notification system make monitoring and responding to issues straightforward.
Who is it recommended for?
Datadog is suitable for network administrators needing both internal and external monitoring of network performance and accessibility. It's also beneficial for businesses looking to scale their monitoring efforts.
Pros:
- Offers numerous real user monitors via templates and widgets
- Can monitor both internally and externally giving network admins a holistic view of network performance and accessibility
- Changes made to the network are reflected in near real-time
- Allows businesses to scale their monitoring efforts reliably through flexible pricing options
Cons:
- Would like to see a longer trial period for testing
There are three editions – Free, Pro, and Enterprise.
The Free plan offers core collection and visualization features, while the Pro plan, priced at $15 per host per month, centralizes the monitoring of systems and services. Finally, the Enterprise plan, priced at $23 per host per month, offers advanced features and administrative controls that are not available in the other plans. Click here to get started for free.
5. SolarWinds Data Center Monitoring
SolarWinds produces a range of system monitoring and management tools. By combining these, you can get a complete system to monitor a data center. This is an on-premises package, so you need to install and maintain the software on your own servers.
The important features of SolarWinds Data Center Monitoring system are:
- Modules that work together while each offering specialized system monitoring services
- Network Performance Manager for constant network device health tracking with alerts for when problems arise
- Automatic network device discovery and asset inventory creation
- A live network topology map
- Tracking for wireless and virtual systems as well as LANs
- Network Configuration Manager for device configuration standardization
- Automated device onboarding
- Security monitoring to prevent configuration tampering
- Virtualization Manager to watch over virtual, hybrid, and cloud systems
- Monitors Hyper-V, VMWare, and Nutanix
- Virtual infrastructure mapping
- Tracking of the CPU and memory used by VMs
- Virtualization capacity management
- Storage Resource Monitor to watch over storage devices
- Manages storage server clusters
- Plans capacity requirements for storage
- Cross-stack correlation

Why do we recommend it?
SolarWinds Data Center Monitoring is recommended for its comprehensive integration of various system monitoring tools, offering a complete solution for data center management. Its ability to automatically discover network devices and create real-time topology maps and inventory lists makes it a powerful asset for IT professionals.
Who is it recommended for?
This tool is ideal for IT professionals managing large-scale data centers. Its detailed monitoring capabilities, including network performance, virtualization, and storage resource monitoring, make it well-suited for environments where maintaining server performance and health is critical.
Pros:
- Takes a holistic approach to server performance and health monitoring
- Supports auto-discovery that builds network topology maps and inventory lists in real-time based on devices that enter the network
- Supports both SNMP monitoring as well as packet analysis, giving you more control over monitoring than similar tools
- Uses drag and drop widgets to customize the look and feel of the dashboard
- Robust reporting system with pre-configured compliance templates
Cons:
- Designed for IT professionals, not the best option for non-technical users
Click here for a 30-day free trial.
6. NLyte Software
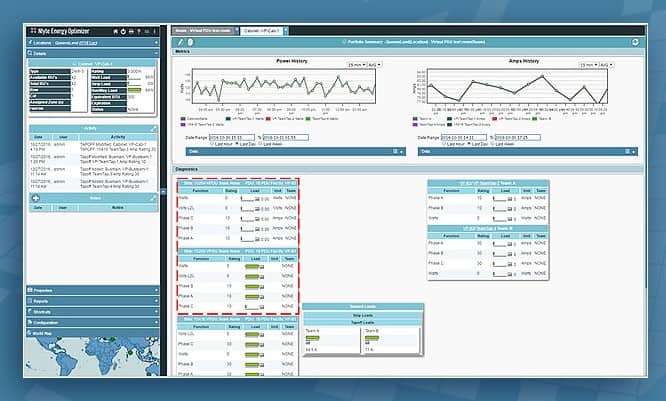
NLyte Software is a complete data center infrastructure management tool that can optimize your critical infrastructure, including your data center, hybrid environment, and cloud and edge computing resources.
Key Features:
- Monitors telemetry points to optimize power and thermal efficiencies
- Reduces disruptions from the maintenance cycles of your network resources
- Predicts disruptions to help you plan for them
- Optimizes the placement of application workloads
- Provides complete visibility into the health and performance of all devices
- Unifies the data center ecosystem
- Reduces costs and resource usage
- Balances critical infrastructure maintenance with workload availability
- Identifies anomalies in the performance of your devices
- Gives transparency across the entire facility infrastructure

Why do we recommend it?
Nlyte Software is recommended for its comprehensive data center infrastructure management capabilities, particularly in optimizing power and thermal efficiencies. Its predictive analytics for planning disruptions is a key feature.
Who is it recommended for?
This tool is ideal for larger enterprises or data centers focused on optimizing critical infrastructure, including data center, hybrid, cloud, and edge computing resources.
Pros:
- Sleek user interface
- Offers capacity planning tools
- Collects and displays metrics in real time
- Ideal for larger enterprises or data centers
Cons:
- Would like to see a longer trial period
For pricing, call 650-642-2700 or email sales@nlyte.com Click here for a demo.
7. Kaseya VSA
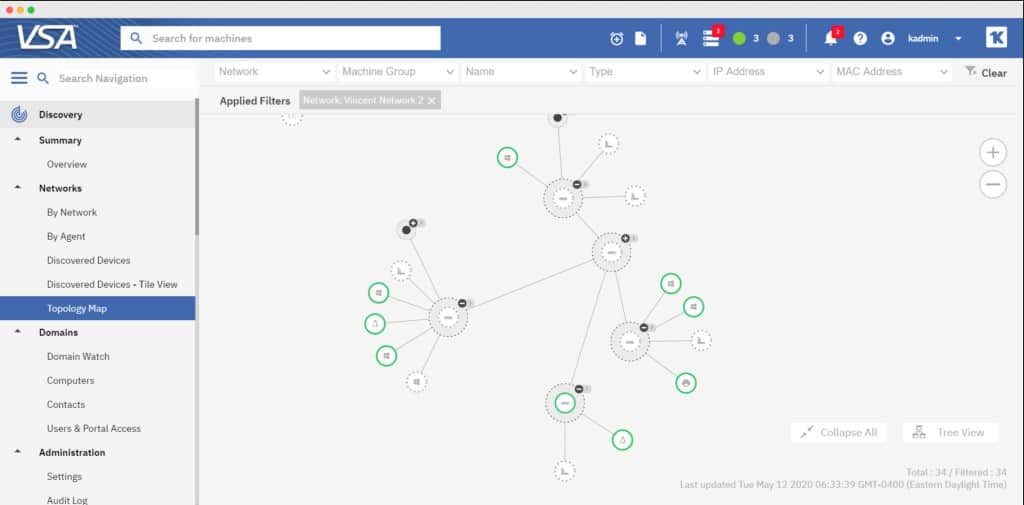
Kaseya VSA is a unified monitoring and management tool that comes loaded with features for comprehensive monitoring of your IT infrastructure. It also comes with a bunch of automation options to reduce workload and improve the efficiency of operations.
Key Features:
- Monitors and manages all traditional endpoints like servers, desktops, laptops, SNMP network devices, and printers
- Provides visibility into your entire IT infrastructure
- Generates reports and dashboards to help visualize your IT data
- Boosts efficiency through automation
- Remotely manages endpoints to identify and resolve issues quickly
- Automates IT processes such as patch and vulnerability management
- Manages backups
- Eliminates processes that are not relevant to your IT infrastructure and suggests removing unused tools to boost the overall efficiency
- Discovers new devices and maps them

Why do we recommend it?
Kaseya VSA is recommended for its unified monitoring and management capabilities, especially its automation options that reduce workload and improve operational efficiency.
Who is it recommended for?
It's well-suited for IT teams needing to monitor and manage traditional endpoints, such as servers and network devices, while also wanting to automate IT processes like patch management.
Pros:
- Automated software deployments can help streamline adding new machines to the client network
- Does a good job at monitoring overall health and resource consumption of devices
- Interface is simple and customizable
Cons:
- The free trial could be longer
Contact the sales team for pricing. Click here to get started.
8. Optimum Path Visual Data Center
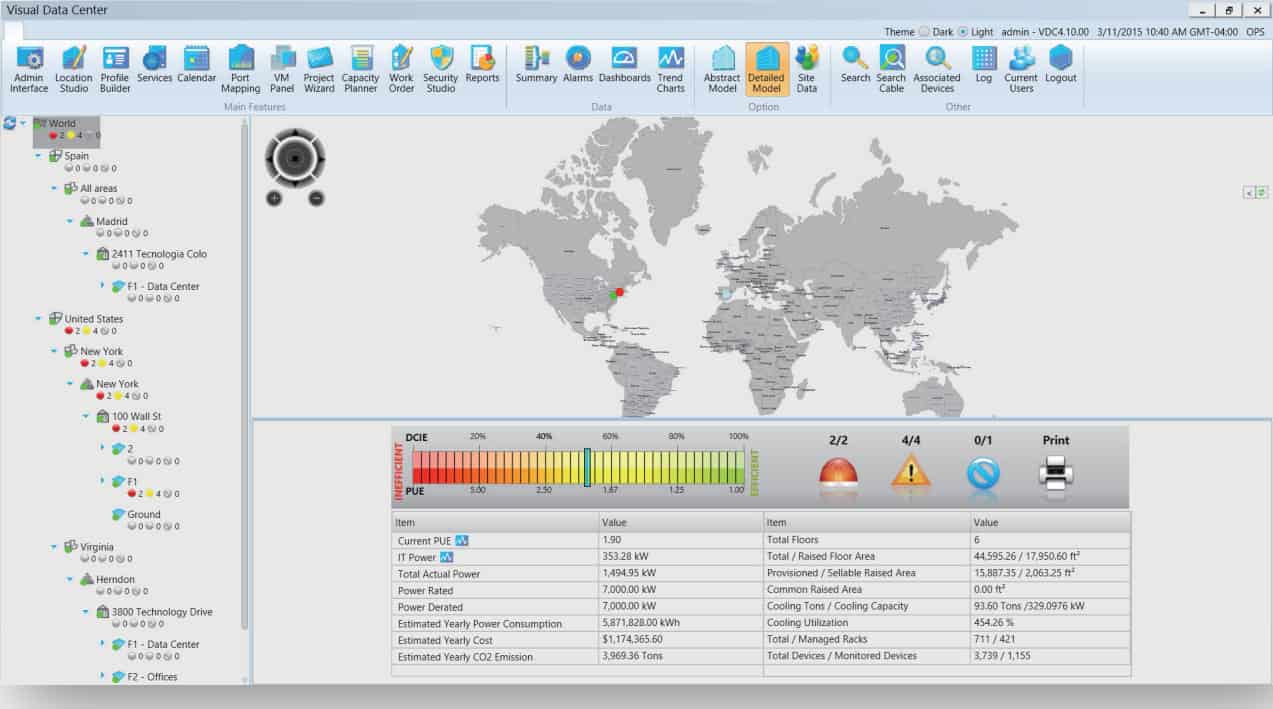
Optimum Path Visual Data Center is a unified platform that aggregates data from multiple sources to help you understand the performance of your IT infrastructure at any time. In the process, it reduces operating expenses and improves the overall reliability of applications.
Key Features:
- Displays 3D visualization of the entire infrastructure to give you an idea of the devices and their operations within the larger context of your IT operations
- Helps with capacity planning and forecasting
- Creates models and simulations to give a more predictable touch to your deployments
- Tracks the performance of processes and their associated tickets.
- Maps devices and their interdependencies for impact analysis and root cause failures
- Its intuitive dashboard displays KPIs and other metrics
- Monitors environmental aspects such as temperature, humidity, etc., so you can make changes as needed for the longevity of your devices
- The interface is intuitive and straightforward
Why do we recommend it?
Optimum Path Visual Data Center is recommended for its ability to aggregate data from multiple sources, offering a unified platform for IT infrastructure performance analysis. Its capacity planning and forecasting capabilities are standout features.
Who is it recommended for?
This tool is ideal for larger data centers requiring holistic views of their environment, including 3D visualizations and performance tracking of processes and tickets.
Pros:
- Ideal for larger data centers
- Can consolidate your data sources for a holistic view of the health of your environment
Cons:
- The free trial could be longer
Contact the customer team for pricing. Enter your details in the “Get Demo” form for a free demo.
9. Device42
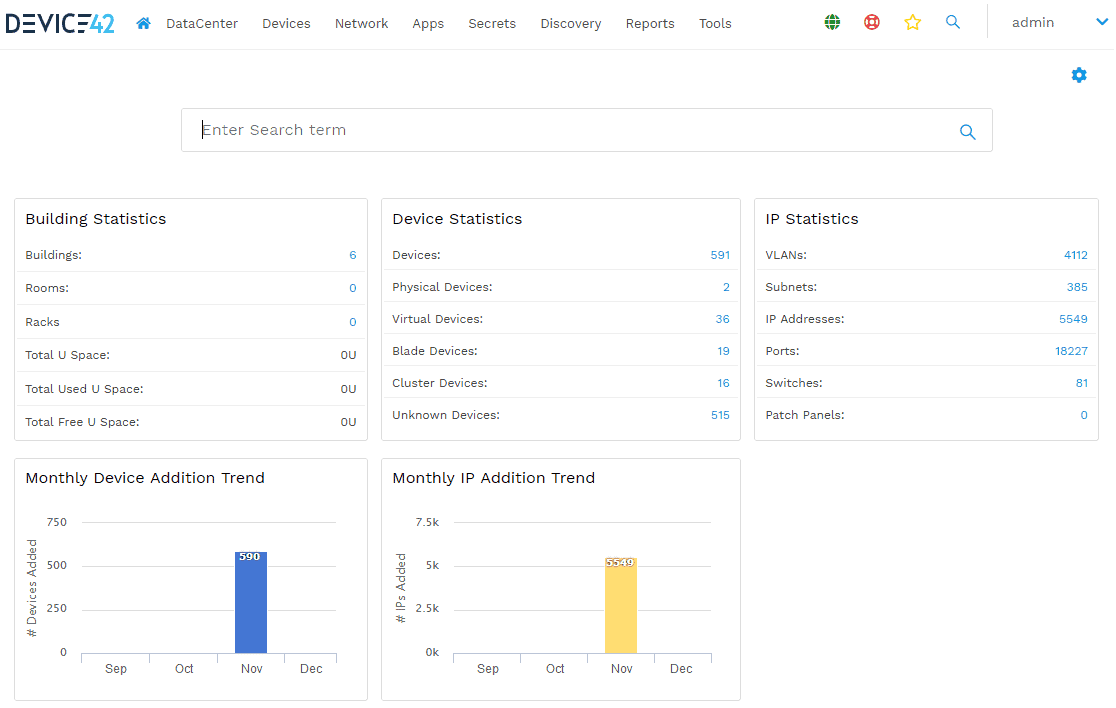
Device42 is an advanced hybrid cloud discovery and dependency mapping platform that provides comprehensive visibility into your data center, along with its dependencies and connected resources.
Key Features:
- Provides accurate visibility across the entire IT stack
- Meets internal and external compliance
- Identifies dependencies across environments
- Automatically discovers infrastructure and applications across the data center and cloud
- Works well for large organizations handling complex IT infrastructure
- Integrates with most ITSM and SIEM tools
- Reduces downtimes and improves the overall operational efficiency
- Enhances provisioning and automation and optimizes the existing workload
- Provides detailed root cause analysis and a single source of truth within your organization
- Discovers and maps application dependencies
- Centrally manages all shared passwords between different teams

Why do we recommend it?
Device42 is recommended for its detailed hybrid cloud discovery and dependency mapping. It provides comprehensive visibility and integrates well with ITSM and SIEM tools, enhancing operational efficiency.
Who is it recommended for?
It's suitable for large organizations managing complex IT infrastructures and needing accurate visibility and automatic discovery of infrastructure and applications across data centers and clouds.
Pros:
- Can produce automatic topology maps as well as dependency mapping
- Offers a unique rack-level visualization to help on-site technicians map physical infrastructure to certain services
- Designed to scale in enterprise environments
Cons:
- Initial configuration can be complex and time-consuming
- Would like to see it easier to create custom affinity groups
The pricing depends on the number of devices and IP addresses in use. The cost includes annual maintenance and upgrades charges, and the cost per device will go down when you have more devices.
Click here to build your online quote. Click here to try Device42 for free.
10. Zabbix
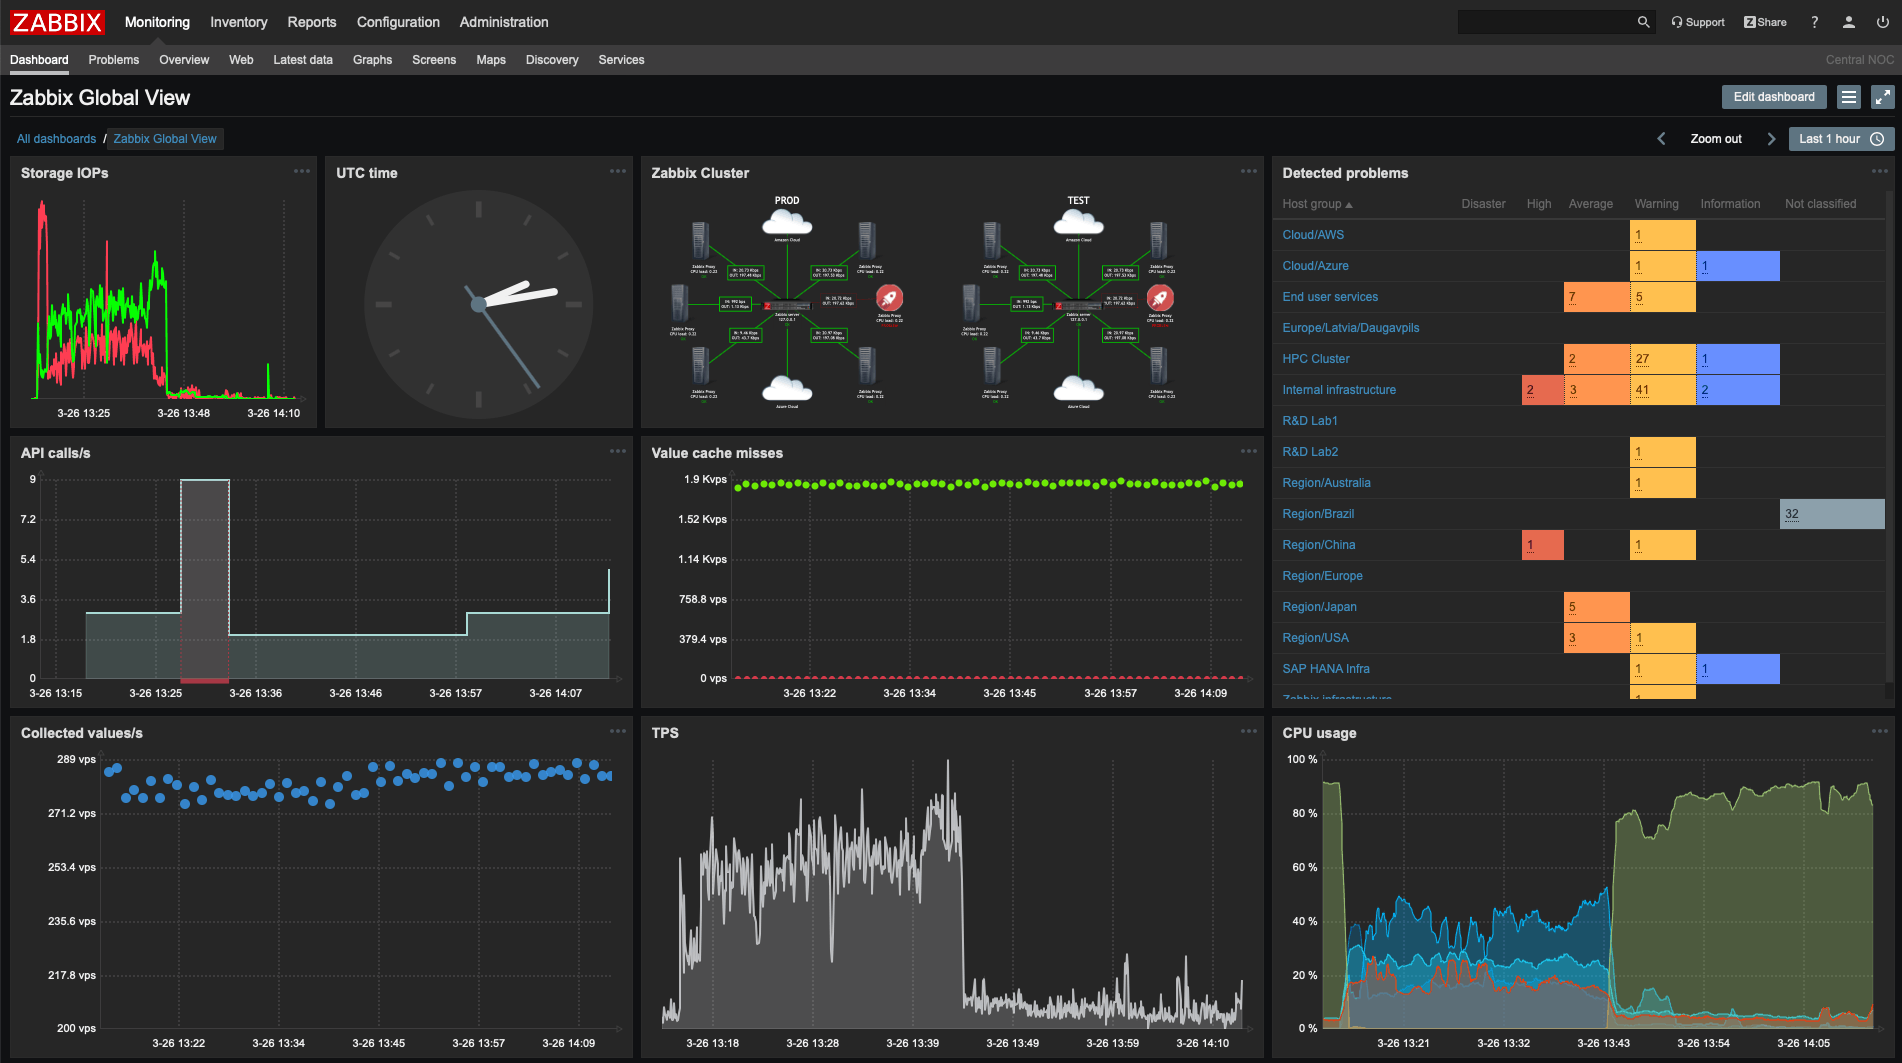
Zabbix is an open-source tool used for monitoring a wide range of devices and environments. It works well for both small and large enterprise-scale IT environments.
Key Features:
- It has virtually unlimited scalability as it can monitor 100,000+ hosts and metrics
- Supports distributed monitoring for helping you stay on top of applications across geographies
- Comes with strong end-to-end encryption and out-of-the-box templates
- Auto discovers devices and maps them automatically
- Predicts trends and anomalies so that you can get to the issues right away
- Has intelligent alert and remediation capabilities
- Collects metrics from all the devices, services, and applications
- Defines smart thresholds
- Displays all the pertinent information on a single pane
- You have the option to allow Zabbix to fix issues automatically
- Protects data at all levels
- Ideal for monitoring large and diverse environments
- Integrates well with all parts of an environment
Why do we recommend it?
Zabbix is recommended for its scalability and ability to monitor a wide range of devices and environments. Its open-source nature and support for SNMP and ICMP make it a versatile and transparent monitoring tool.
Who is it recommended for?
This tool is ideal for both small and large enterprise-scale IT environments, particularly those seeking a broad monitoring range and immediate detection of new devices and configuration changes.
Pros:
- Open-source transparent tool
- Uses both SNMP and ICMP for a broader monitoring range
- Can detect new devices and configuration changes immediately
- Offers useful templates for quick insights
- Robust notification system supports SMS, email, custom script, and webhook
Cons:
- The interface isn’t as intuitive as solutions such as DataDog or Site24x7
- Would like to see better-alerting features, specifically related to reducing false positives
Click here to download Zabbix for free.
Which Tool Should You Choose?
Now that you've seen the best data center monitoring tools, the big question is, which of these should you choose?
Before embarking on this decision-making process, make a list of the devices and networks you want to monitor, to get an estimate of the size, nature, and diversity of your tech stack. Next, note down any specific features you want, such as automating the workflow, supporting particular operating systems, and more. Finally, have a budget in mind.
Run each of these aspects against the tools mentioned earlier to see which fits your needs well. In case of any questions, never hesitate to reach out to the customer service representatives of these companies. Most of them have a chat feature right on the website, while others have an email option. All the companies mentioned in this article have good quality customer support and respond quickly to your questions.
Based on all these aspects, pick the tool that would work best for your organization.
Data Center Monitoring Tools FAQs
What types of data center infrastructure can be monitored?
Data center infrastructure that can be monitored includes servers, storage systems, networking equipment, power and cooling systems, and other critical components.
What are some common data center monitoring tools?
Common data center monitoring tools include SolarWinds Data Center Monitoring, Nagios, Zabbix, PRTG, and Datadog.
How can I monitor server performance in a data center?
Server performance can be monitored in a data center using tools such as CPU and memory monitoring software, performance monitoring tools, and log analysis tools.
How can I monitor storage systems in a data center?
Storage systems in a data center can be monitored using tools that monitor disk usage, file system performance, and storage capacity.
How can I monitor networking equipment in a data center?
Networking equipment in a data center can be monitored using tools that monitor network traffic, network utilization, and network performance.
How can I monitor power and cooling systems in a data center?
Power and cooling systems in a data center can be monitored using tools that monitor power usage, temperature, humidity, and other environmental factors.
What are some best practices for data center monitoring?
Best practices for data center monitoring include establishing a monitoring plan, using a centralized monitoring platform, setting up alerts and notifications, performing regular maintenance and updates, and analyzing data to identify trends and potential issues.


