
Databases lie at the core of most business workflows, especially today when the datasets are so sophisticated and diverse. As your business-critical applications scale with time, the IT infrastructure becomes more complicated to monitor and manage. Sure the IT world is evolving rapidly, but this also challenges our ability to troubleshoot and resolve issues faster.
Finding the root cause of an issue can be overwhelming across large databases. That’s when your best database monitoring tools come in!
Here’s our list of the Best Database Monitoring Tools:
- ManageEngine Applications Manager – EDITOR'S CHOICE This performance tracking package watches over software and services, including databases. Runs on Windows Server, Linux, AWS, and Azure. Get it on a 30-day free trial.
- Paessler PRTG – FREE TRIAL A professional-grade database monitor that provides an all-in-one view at a glance into your entire tech stack. Download a 30-day free trial.
- Site24x7 – FREE TRIAL Proactive SQL database performance monitoring to keep track of system performance and manage resource utilization
- ManageEngine OpManager Nexus – FREE TRIAL A comprehensive monitoring tool that offers real-time visibility into database health and performance. It also finds and fixes issues before it impacts applications. Start a 30-day free trial.
- SolarWinds Database Performance Monitor (DPM) Τhe top-rated tools used to monitor and optimize open-source, traditional, and modern cloud-native databases.
- SentryOne SQL Sentry A powerful, all-in-one SQL server monitoring tool for faster resolution of performance problems.
- Datadog A modern database monitoring tool to keep track of critical metrics, logs, and traces throughout the stack.
- dbWatch Modern, intuitive tools to monitor and manage each instance in your entire database ecosystem.
- SQL Power Tools Industry-leading “Zero-impact Data Monitoring” with the help of non-intrusive network sniffing.
- Nagios One of the top-rated database monitoring solutions for complete monitoring of your databases and database servers.
- Redgate’s SQL monitor One of the popular solutions used today to manage your entire SQL server state.
- Percona A high-rated, open-source database monitoring solution that is best for people who dislike vendor lock-ins.
Why do you need Database Monitoring?
Database monitoring tools help businesses monitor and track the performance and health of their databases. This allows them to find out and resolve potential issues as well as make changes to the database’s function. The database monitoring software extracts critical performance metrics such as connectivity, query execution time, and so on and then correlates them to the set benchmark.
DBAs use database monitoring tools to retain optimal database performance and pinpoint issues to prevent downtimes. Often, these tools integrate with log analysis software, alerting software, or other resolution tools to build a powerful IT infrastructure ecosystem.
Best database monitoring tools will help DBAs (database administrators) with the following:
- Monitor health and performance of the databases
- Extract real-time metrics to identify and resolve issues
- Provide reporting features for database performance
- Automate alerting feature to immediately resolve issues
- Achieve streamlined and uninterrupted performance
- Better capacity planning
Methodology for The Best Database Monitoring Tools:
We've broken down our analysis for you based on these key criteria:
- The capability to monitor databases in various environments: cloud, hybrid, and local.
- Features for historical and real-time data analysis to quickly identify performance issues.
- Compliance with major data protection regulations like GDPR and SOC2.
- Advanced functionalities such as query analysis and adaptive fault detection.
- Alert systems to manage and resolve database anomalies effectively.
- The tool's ability to handle large datasets and complex database structures.
The Best Database Monitoring Tools
1. ManageEngine Applications Manager – FREE TRIAL
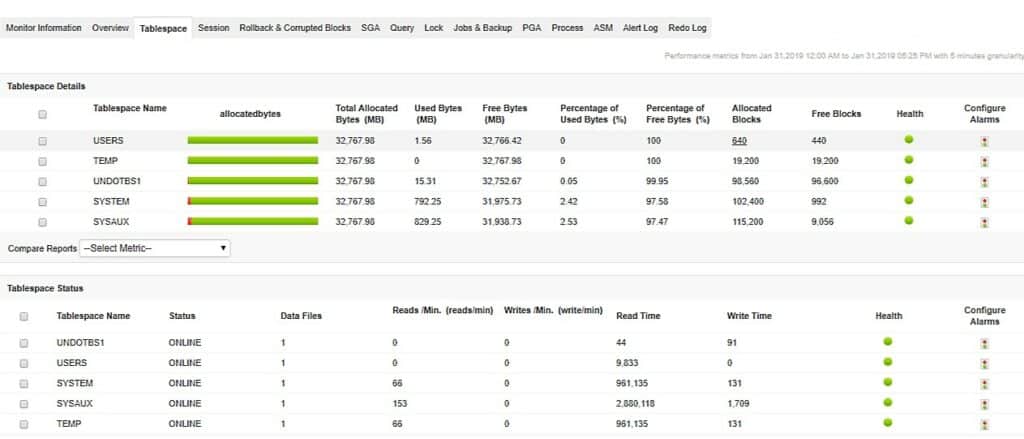
ManageEngine Applications Manager tracks all of your software and services. The tool is able to discover all components of each application, which could be hosted on different servers. It is also able to monitor middleware, such as databases, virtualizations, and Web servers. The system can monitor relational databases, NoSQL databases, and big data systems.
Key Features
- Live database performance tracking
- Scrutiny for slow-running queries
- Database growth tracking and capacity planning
- Correlation between database resource requirements and supporting platform service availability
- Performance graphs and charts
Feature distinction
This tool takes a proactive approach to detecting problems, so they can be fixed before they impact our users. These insights also reduce the time to repair.

Why do we recommend it?
ManageEngine Applications Manager is recommended for its comprehensive monitoring capabilities that extend beyond databases to include middleware, virtualizations, and web servers. Its live performance tracking and ability to manage a variety of database types make it a versatile tool.
Who is it recommended for?
This tool is ideal for organizations that need a broad monitoring solution covering not just databases but also associated middleware and services. It's suitable for those who manage complex application environments including relational, NoSQL, and big data systems.
Pros:
- Monitoring for Oracle, SQL Server, MySQL, and PostgreSQL
- Tracks NoSQL systems, including Couchbase, Cassandra, and MongoDB
- In-memory databases and key-value stores
- Cloud database tracking on AWS, Azure, and Oracle Cloud
- Will install on cloud platforms or on-premises servers
Cons:
- Not a SaaS package
Click here for a 30-day free trial.
EDITOR'S CHOICE
ManageEngine Applications Manager is our top pick for a database monitoring tool because this package will discover all of your database instances and implement monitoring in the context of the systems that access them and the services that support them. The Applications Manager assembles an application dependency map. That map provides a method to forecast resource requirements because the system knows that if a specific application launches, within a short while another system will run. The tool records the resource requirements of each package and knows the total capacity of each service on a server. Thus, it can raise an alert that warns of upcoming problems rather than waiting for them to occur. The database monitoring system can interface with SQL Server, MySQL, Oracle, PostgreSQL, DB2, and Sybase, among other DBMSs. The package is also able to monitor No-SQL, in-memory, and big data systems. The package is able to forward alerts to technicians by email or SMS, so they don’t need to watch the monitoring console all the time. The screens of the dashboard can be customized, as can the alert thresholds.
Download: Get a 30-day free trial
Official Site: https://www.manageengine.com/products/applications_manager/download.html
OS: Windows Server, Linux, AWS, and Azure
2. Paessler PRTG Network Monitor – FREE TRIAL
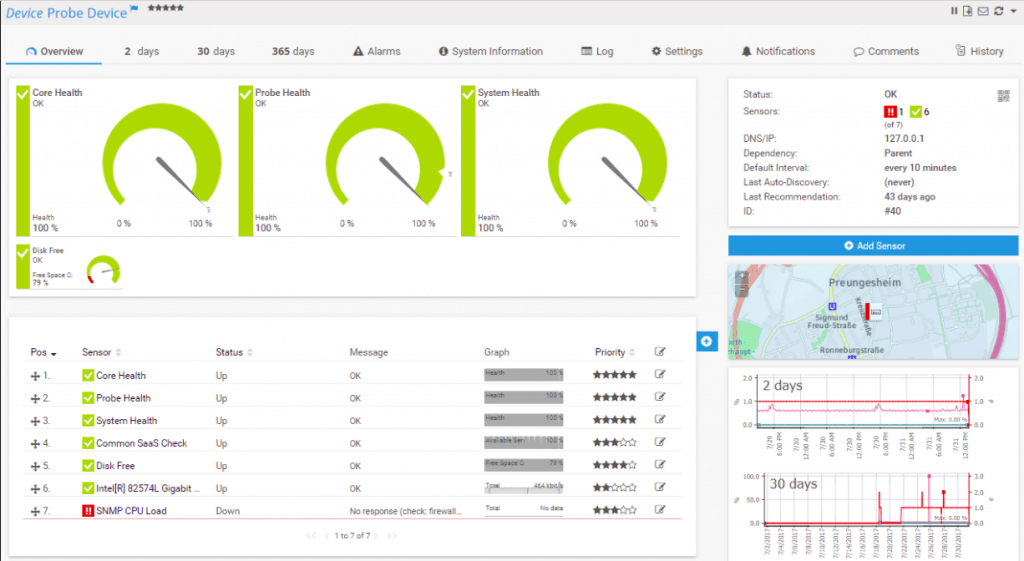
Paessler PRTG is a professional-grade database monitor that provides an all-in-one view at a glance into your entire tech stack. The main highlight about PRTG is that it leverages sensors as its basic monitoring tools. One sensor keeps an eye on one measure value within a network such as the free space in the disk drive, server’s CPU load, and so on. You will require one sensor per switch port or 5-10 sensors/device.
Key Features
- It queries data from your database, making sure there’s no lengthy connection, query, or return times.
- Monitors specific datasets in your databases with the help of individually configured PRTG sensors and SQL queries that you can define.
- Customizable reports can be sent to managers automatically.
- Predefined sensors for various databases including PostgreSQL, Oracle SQL v2, MySQL, and Microsoft SQL v2.
- Offers global monitoring to keep an eye on your entire network and all databases.
Feature distinction
It uses predefined SQL queries to monitor the health and performance of all database types.

Why do we recommend it?
Paessler PRTG is recommended for its all-in-one monitoring capabilities, leveraging sensors to monitor various aspects of network and database performance. Its support for customizable reports and predefined sensors for various databases make it a comprehensive monitoring solution.
Who is it recommended for?
PRTG is ideal for organizations looking for a professional-grade database monitor that provides detailed insights into their entire tech stack, including network performance and device discovery.
Pros:
- Uses a combination of packet sniffing, WMI, and SNMP to report network performance as well as discover new devices
- Autodiscovery reflects the latest inventory changes almost instantaneously
- Drag and drop editor makes it easy to build custom views and reports
- Supports a wide range of alert mediums such as SMS, email, and third-party integration
- Supports a freeware version
Cons:
- Is a very comprehensive platform with many features and moving parts that require time to learn
Click here for a fully functional 30-day free trial.
3. Site24x7 – FREE TRIAL
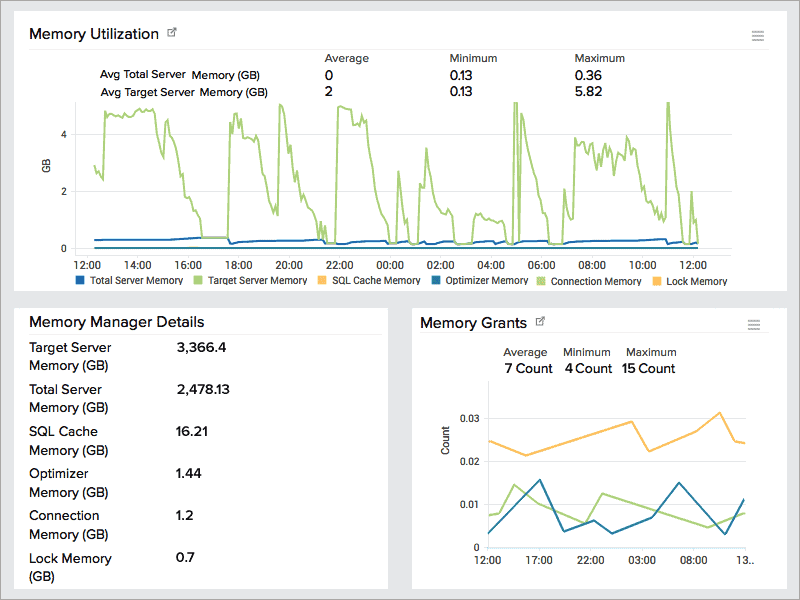
Site24x7 executes proactive SQL database performance monitoring to keep track of system performance and manage resource utilization. Detecting database issues as they occur leads to faster troubleshooting and retaining the health of the application. With Site24x7, you can maintain high SQL server performance and availability. Plus, the tool also helps you mitigate server sprawls.
Key Features
- Alerts on failover amongst active and passive nodes.
- Get buffer manager, memory, page reads, and page writes details for enhanced capacity planning.
- Extract SQL operations metrics such as the number of active connections, replications, errors, longest transaction time of SQL instances, SQL compilations, and so on. It also has threshold settings for each of these performance metrics.
- Derive database attributes such as log cache hit ratio, data file size used log file size, and more.
- Helps DevOps team to focus on critical elements of SQL servers such as latch, lock, and job details.
- Provides real-time SQL server status along with cache hit ratio, the number of downtimes, and more.
- Find and analyze slow-loading SQL queries amongst large datasets with the help of pre-defined search fields such as user, event ID, date & time, log level, and message.
- The single dashboard shows the dynamic memory usage of the server for query and cache optimization, and maintaining connections to a number of pages within the buffer pool.
Feature distinction
Site24x7 is your go-to tool to avoid real-time server performance issues that can impact end-user experience.

Why do we recommend it?
Site24x7 is recommended for its proactive SQL database performance monitoring capabilities. It offers a flexible cloud-based monitoring option with a host of out-of-box monitoring options and dashboard templates.
Who is it recommended for?
This tool is well-suited for DevOps teams focusing on critical SQL server elements. It's also beneficial for organizations that need a cloud-based monitoring solution with AI-enhanced root cause analysis.
Pros:
- Flexible cloud-based monitoring option
- Offers a host of out-of-box monitoring options and dashboard templates
- Allows administrators to view dependencies within the application stack, good for building SLAs and optimizing uptime
- Offers root cause analysis enhanced by AI to fix technical issues faster
Cons:
- Site24x7 is a feature-rich platform with option that extended beyond databases management, may require time to learn all options and features
You can start the 30-day free trial.
4. ManageEngine OpManager Nexus – FREE TRIAL

ManageEngine OpManager Nexus, formerly OpManager Plus, can monitor a wide range of databases, including relational, NoSQL, cloud, legacy, and more. It even correlates data from multiple databases and combines them with the metrics gathered from other infrastructure layers to provide comprehensive visibility into your infrastructure’s operations.
Key Features;
- Tracks multiple KPIs, like CPU, memory, I/O, sessions, connections, and more.
- Identifies performance issues, including slow SQL queries and latency errors.
- Uses static and dynamic thresholds to send alerts.
- Comes with automated workflows to trigger remediation actions.
- Generates insightful reports.
Feature Distinction
Supports a wide range of databases from multiple vendors, making it a good choice for different organizations.

Why do we recommend it?
OpManager Nexus offers deep visibility into the health and performance of databases. It also shows how resources are utilized by every database, so you can make informed capacity planning decisions. It also offers anomaly detection and root cause analysis to support quick troubleshooting. Its reporting and dashboards are a big plus as well.
Who is it recommended for?
A good choice for enterprises and large organizations that have one or more databases in the environment. Also, works well for database engineers and administrators.
Pros:
- Monitors cloud, legacy, NoSQL, and relational databases.
- Offers deep visibility into multiple related KPIs.
- Displays insights on intuitive dashboards for easy understanding.
- Sends alerts across multiple channels.
- Supports automated workflows to trigger actions.
Cons:
- May take time to fully understand the tool.
The starting price of OpManager Nexus is $1,233 for the Professional edition and $19,995 for the Enterprise edition. These are annual prices for 50 and 1000 devices, respectively. Start a 30-day free trial.
5. SolarWinds DPM
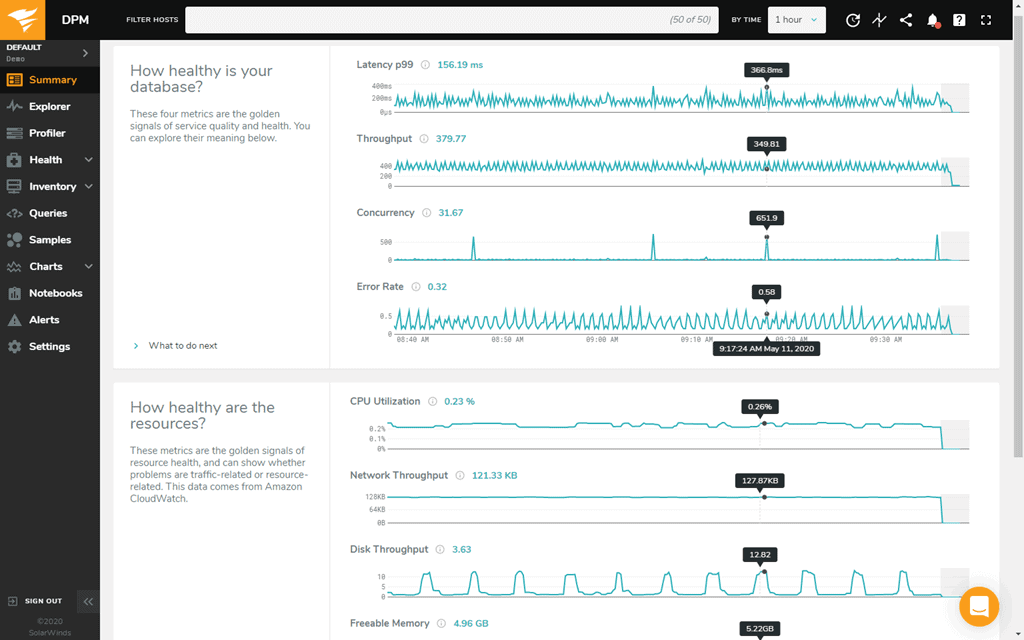
SolarWinds Database Performance Monitor (DPM) is the top-rated tool used to monitor and optimize open-source, traditional, and modern cloud-native databases.
Key Features
- Monitors databases in the cloud, hybrid environments, or locally.
- Historical and real-time data helps to identify performance issues faster.
- Complies to GDPR and SOC2.
- Profiler feature compares time ranges to help you deploy code efficiently. Custom time frames provide you with insights regarding whether query responses changed after new deployments and how they changed.
- Explorer feature provides a deeper view into queries, their impact, and their performance across databases.
- Dashboards visualize thousands of critical metrics related to databases, queries, and infrastructure.
- Adaptive fault detection is able to spot the smallest of interruptions to service or server availability, thus, avoiding major failures.
- Filter queries based on host, query text, and timeframe to get deeper insights into specific queries.
- Alerts and events help you resolve abnormalities in a timely manner.
Feature distinction
Works well with all databases like Oracle, SQL Server, ASE, DB2, and non-SQL databases.

Why do we recommend it?
We recommend SolarWinds Database Performance Monitor (DPM) for its ability to monitor databases across various environments efficiently. It provides historical and real-time data, which is crucial for faster identification and resolution of performance issues. The tool's compliance with major data protection standards, combined with its advanced profiling and exploration features, make it an excellent choice for organizations needing detailed insights into their database performance.
This powerful SaaS platform features a web-based UI and provides a visual overall view of your database’s performance and health. Further, it also offers suggestions to run your database more efficiently.
Who is it recommended for?
SolarWinds DPM is ideal for medium to large-sized organizations that require comprehensive monitoring of their database environments, whether in the cloud, hybrid, or on-premises. Its features cater to businesses that need to comply with data protection regulations and those who seek in-depth analysis and efficient code deployment in their database operations.
Pros:
- Highly intuitive DB management system tailored for medium to large size database implementations
- Monitors in real-time, offering a number of alert and notification options that can integrate into popular helpdesk solutions
- Threshold monitoring helps keep teams proactive, and fix issues before they impact performance
Cons:
- Could use a longer trial period
You can try SolarWinds Database Performance Monitor (DPM) through a free fully functional 14-day free trial.
6. SentryOne SQL Sentry
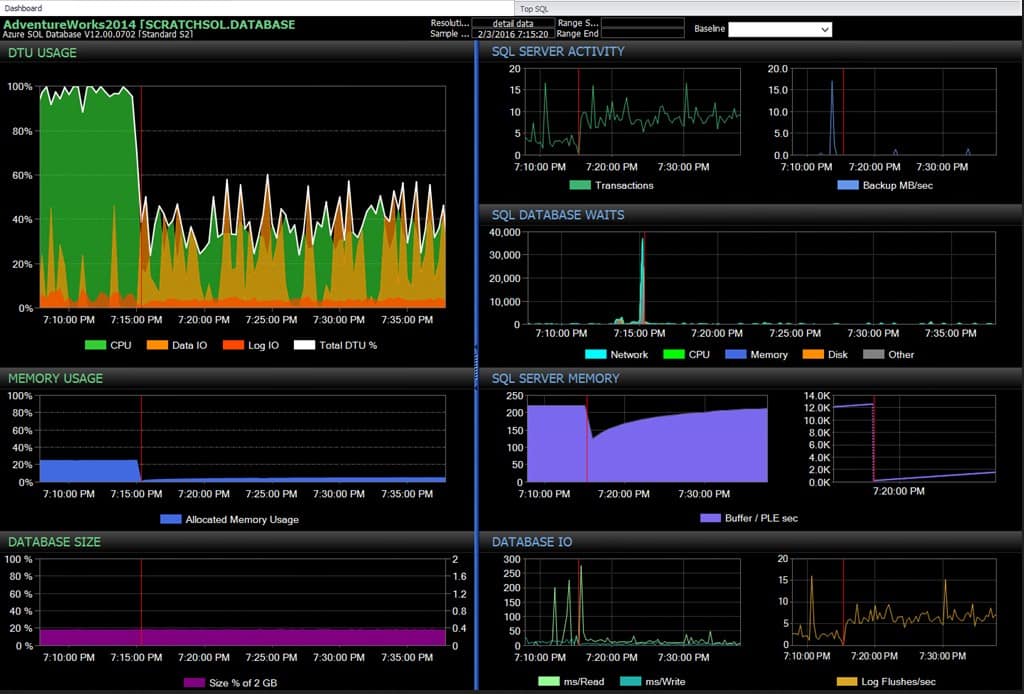
SentryOne SQL Sentry is a powerful, all-in-one SQL server monitoring tool for faster resolution of performance problems. The tool helps you find the root cause of SQL server slowdowns with the right, accurate and detailed metrics.
Key Features
- The intuitive dashboard provides an at-a-glance view of your entire data stack and its health. You can drill down into the critical metrics for thorough analysis.
- Shows detailed performance metrics.
- Fixes high-impact SQL queries through “Top SQL view” which shows query history, execution plan diagrams, and much more.
- Set automated alerts for specific conditions and eliminate alert fatigue with the Advisory Conditions feature. These specific conditions can be a WMI query, a T-SQL query, another combination of values, or a performance counter value.
- Uses SentryOne Portal to see crucial performance data in a web browser. The portal can be linked to your existing SentryOne database and it offers core capabilities such as Top SQL, deadlocks analysis, blocking analysis, Environment Health Overview, and Performance Analysis Dashboard.
Feature distinction
It generates detailed insights into the performance of your SQL databases, making it easy to identify trends and patterns.

Why do we recommend it?
SentryOne SQL Sentry is recommended for its targeted focus on SQL server monitoring. It provides detailed metrics and robust features like the “Top SQL view” for identifying and fixing high-impact SQL queries. The tool's ability to set automated alerts for specific conditions helps in maintaining optimal SQL server health and performance.
With SQL Sentry, you can gain deeper observability to effectively monitor, troubleshoot, and optimize your entire data estate.
Who is it recommended for?
This tool is best suited for organizations that rely heavily on SQL servers and need dedicated monitoring solutions. It's particularly beneficial for those who already have other application monitoring tools and are looking for a SQL-specific addition to their toolkit.
Pros:
- Dedicated to monitoring specifically only SQL, good for companies that already have other app monitoring tools they’re happy with
- 100+ alerts and templates customized around SQL server health monitoring
- Supports root cause analysis for faster resolution times
Cons:
- Pricing is on the higher end
- Can’t offer monitoring outside the scope of SQL databases
Start a 14-day Free Trial: https://www.sentryone.com/products/trials
7. Datadog
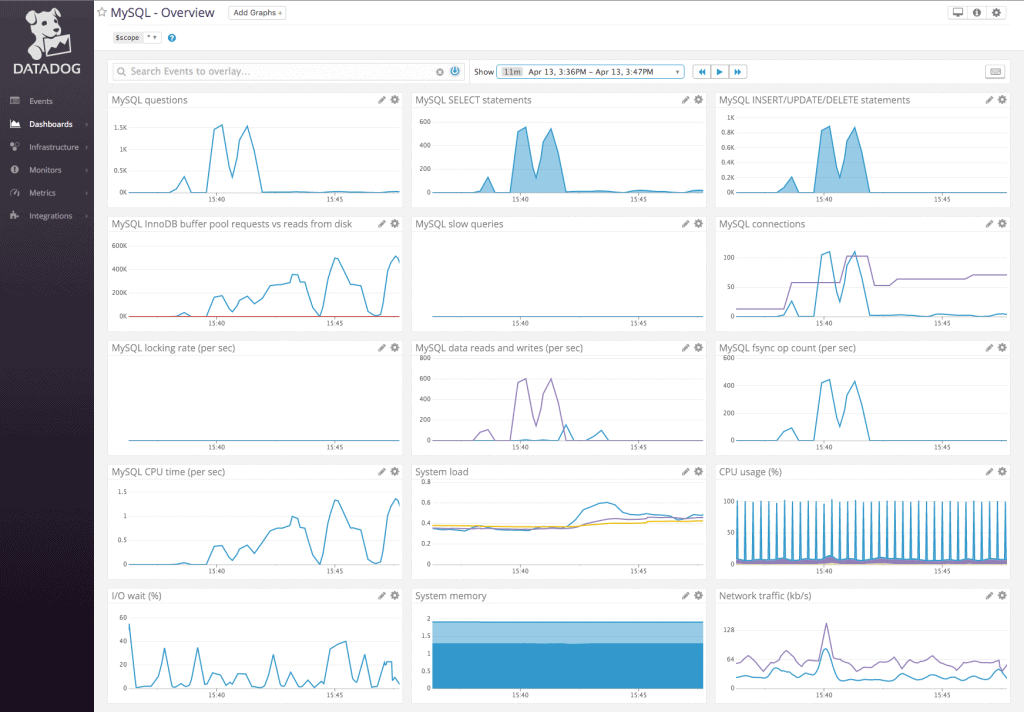
Datadog offers a modern database monitoring tool to keep track of critical metrics, logs, and traces throughout the stack. With this powerful tool, you can proactively monitor the performance and health of your database, thereby timely troubleshooting problems and reducing downtimes.
Key Features
- Unified view of database metrics such as connections, query execution performance, throughputs, real-time buffer pool usage, and more.
- Full latency breakdown and end-to-end application tracing allow you to quickly identify bottlenecks, slow-running queries, and error rates.
- Automatically detects log patterns.
- Turnkey integrations with database monitoring tools including PostgreSQL, MongoDB, and Cassandra.
- A real-time Service Map allows you to fully explore and gain visibility into database interdependencies.
- Customizable dashboards with drag-and-drop and widgets features.
- Automated alerts to keep track of database health like latency percentiles.
- Flexible alert logic relieves alert fatigue.
- Synchronized dashboards help you correlate database performance with a common tagging structure.

Why do we recommend it?
Datadog is recommended for its modern approach to database monitoring, offering a unified view of critical metrics, logs, and traces throughout the stack. Its ability to provide real-time insights and automated alerts makes it a powerful tool for proactive monitoring and troubleshooting.
As you scale your tech stack, Datadog can gather, visualize and send alerts about data across the entire stack through a single-pane-of-glass. Such a unified view simplifies troubleshooting and promotes seamless cross-team collaboration.
Who is it recommended for?
Datadog is particularly suitable for businesses looking to scale their monitoring efforts and require a holistic view of network performance and accessibility. It's also ideal for those needing real-time updates and flexible pricing options.
Pros:
- Offers numerous real user monitors via templates and widgets
- Can monitor both internally and externally giving network admins a holistic view of network performance and accessibility
- Changes made to the network are reflected in near real-time
- Allows businesses to scale their monitoring efforts reliably through flexible pricing options
Cons:
- Would like to see a longer trial period for testing
Website Link: https://www.datadoghq.com/database-monitoring/
8. dbWatch
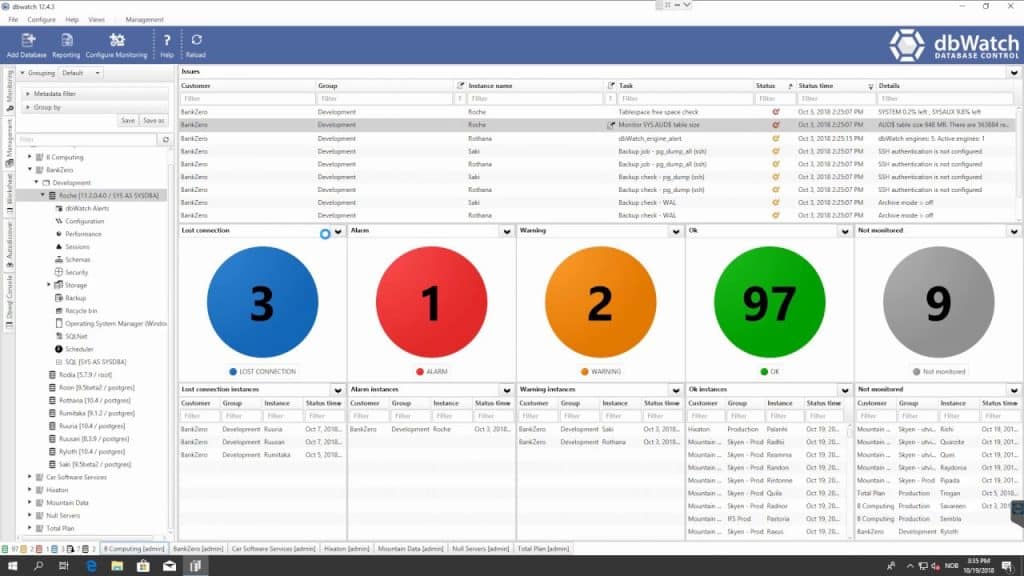
dbWatch provides you with modern, intuitive tools to monitor and manage each instance in your entire database ecosystem. It provides a global view of all your instances, so you get a broader helicopter overview and valuable insights into the server system.
Key Features
- Provides performance metrics and health status of all your instances of the database through a single-pane-of-glass.
- Customizable reports for the health status of single instances or combined reports of different parts of your server.
- Allows you to monitor instances on all platforms through a single console. It supports MySQL, Oracle, Microsoft SQL Server, Sybase, MariaDB, and Postgres.
- Supports AlwaysOn and RAC clustering.
- Monitors instances in hybrid, On-Prem, or cloud environments like Azure SQL support.
- Scales out easily to monitor thousands of instances.
- Fully customizable dashboards, tasks, views, and reports.

Why do we recommend it?
dbWatch is recommended for its ability to provide a global view of all database instances, making it suitable for organizations with a large number of SQL servers. It offers comprehensive monitoring features, including performance metrics, health status, and customizable dashboards.
Further, you can drill down into critical metrics of single instances for better understanding and analysis. For issue resolution, you can manage the instance right away without shifting to other consoles.
Who is it recommended for?
This tool is ideal for businesses that manage multiple database types, including cloud-based databases like Azure SQL. It's also suitable for organizations looking for cross-platform support and proactive alerting capabilities.
Pros:
- Supports multiple database types including cloud-based databases like Azure SQL
- Good option for businesses that have a large amount of SQL servers in operation
- Can proactively alert based on set thresholds
- Available cross-platform on Windows, Linux, and Mac
Cons:
- Minimum license requirement of 10, not for small businesses
Website Link: https://www.dbwatch.com/solution
9. SQL Power Tools

SQL Power Tools offers industry-leading “Zero-impact Data Monitoring” with the help of non-intrusive network sniffing. The feature-packed tool monitors the health and performance of your SQL database round-the-clock. Moreover, it also audits the SQL activity to look for unauthorized or deceiving SQL statements.
Key Features
- Views end-user service levels over any time period.
- Reports average response time every N seconds.
- Sends email alerts when average response time reduces for a specific database instance.
- Offers heatmap and dashboard views of service levels.
- Shows SQL by rows sent response time, and more.
- Supports MySQL, Oracle, Sybase, and SQL Server.
- Captures any subset of the SQL activity throughout.
- View each SQL statement run time by week, day, and hour for baseline analysis.
- Database repository provides a historical view of your SQL activities.
- Filter client SQL activity by any time period.

Why do we recommend it?
SQL Power Tools is recommended for its “Zero-impact Data Monitoring” approach, focusing on non-intrusive network sniffing. This makes it efficient in managing a large number of SQL servers with minimal resource consumption.
Who is it recommended for?
The tool is best suited for organizations that require lightweight yet effective SQL server monitoring. It's particularly useful for those needing built-in security auditing and monitoring that leverages behavioral analytics.
Pros:
- Was specifically built to be as lightweight as possible, allowing it to manage a large number of SQL servers with little resource consumption
- Offers built-in security auditing and monitoring that leverages behavioral analytics to stop SQL attacks
- Clean user interface takes little time to learn
Cons:
- Doesn’t support other applications beyond SQL
- Must contact sales for pricing
Website Link: https://www.sqlpower.com/agentless/
10. Nagios
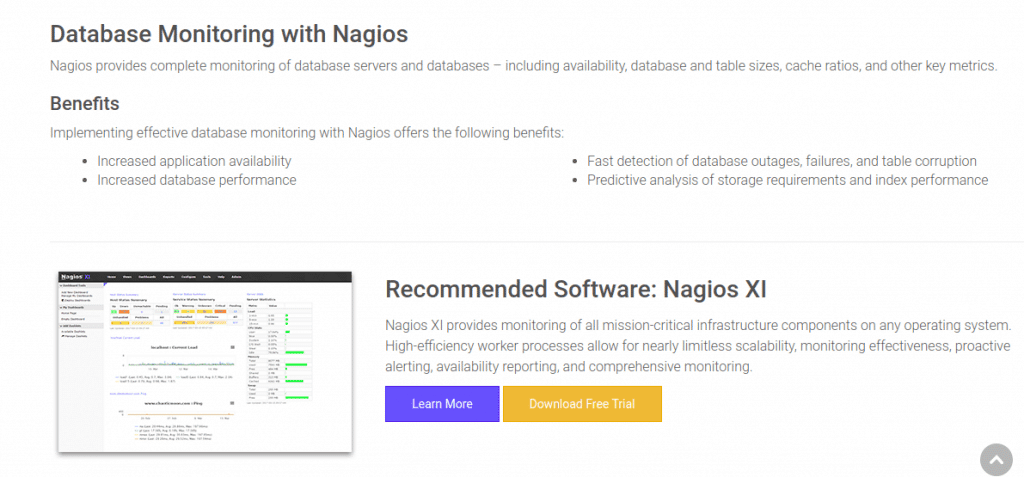
Nagios is again one of the top-rated database monitoring solutions for complete monitoring of your databases and database servers. It monitors database, table sizes, availability, cache ratio, and various other performance metrics.
Key Features
- Faster detection of database table corruption, failures, and outages.
- Predictive analysis of index performance and storage needs.
- Helps to increase application availability and boost database performance.
- Supports Postgres, MySQL, Microsoft SQL Server, Oracle, and DB2 Monitoring.
 Why do we recommend it?
Nagios is recommended for its simplicity and effectiveness in monitoring a wide range of database and database server metrics. Its predictive analysis capabilities and support for multiple database types make it a versatile choice.
Who is it recommended for?
Nagios is ideal for organizations seeking a straightforward yet comprehensive database monitoring solution. Its flexibility and range of community-designed plugins make it suitable for a variety of environments.
Pros:
- Simple, yet informative interface
- Flexible alerting options support SMS and email
- A wide range of community-designed plugins are available for free
Cons:
- The open-source version lacks the support found in paid products
Website Link: https://www.nagios.com/solutions/database-monitoring/
11. redgate SQL Monitor
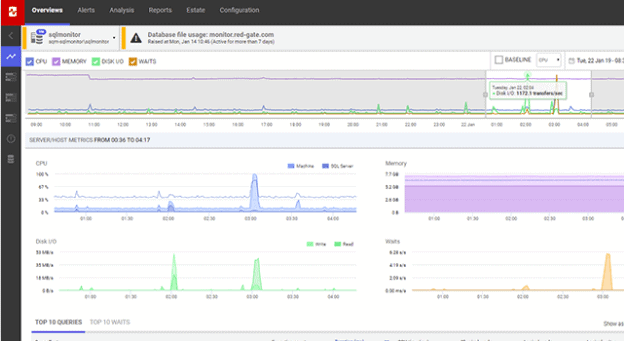
redgate’s SQL Monitor is one of the popular solutions used today to manage your entire SQL server stat. It offers impressive features such as customizable alerting, quick problem diagnosis, and round-the-clock monitoring.
Key Features
- Monitors databases on-premises or on virtual machines, Google Cloud, Azure, or AWS.
- Scales as your infrastructure grows and adds servers in bulk. Various management tools in the package provide an overview of disk usage stats, installed versions, backups, patches, and more.
- Drills down to specific metrics to take the right actions.
- Customizable alerts per your SQL Server environment.
- The global overview provides a deeper view into all your SQL server instances, clusters, virtual machines, and availability groups in a single web-based interface.
- Intelligent diagnosis quickly identifies root causes with the help of specific performance metrics.
- Pre-configured with over 65 customizable alerts for crucial performance and operational issues. With custom metrics, you can create your own alerts and metrics.
- With each new deployment, SQL Monitor logs the information on the Instance timeline right beside the key SQL Server metrics. This helps you detect unusual behavior and bad deployments.
- Extracts metrics for each query such as delays caused due to resource waits, the query plan, and T-SQL text. With these metrics, it gets easy to find and fix slow queries and deadlocks.
- Creates customizable reports and share them instantly with colleagues.

Why do we recommend it?
redgate SQL Monitor is recommended for its scalability and specialized monitoring of SQL servers. It offers pre-configured alerts and templates, making it a powerful tool for SQL DBAs in multi-server environments.
Through a single pane of glass, you can monitor the health and performance of your entire infrastructure and detect potential issues before they harm the end-users. It monitors databases in the cloud, on-premises, or even hybrid environments.
Who is it recommended for?
This tool is best suited for environments with multiple SQL servers, offering a scalable interface and comprehensive monitoring capabilities specifically tailored for SQL database administrators.
Pros:
- Scalable interface, can manage multiple SQL databases without clutter
- Best suited for multi SQL server environments
- Offers pre-configured alerts and templates specifically for SQL DBAs
Cons:
- Doesn’t support other applications beyond SQL
- The trial is only 14 days, could be longer
Website Link: https://www.red-gate.com/products/dba/sql-monitor/
12. Percona
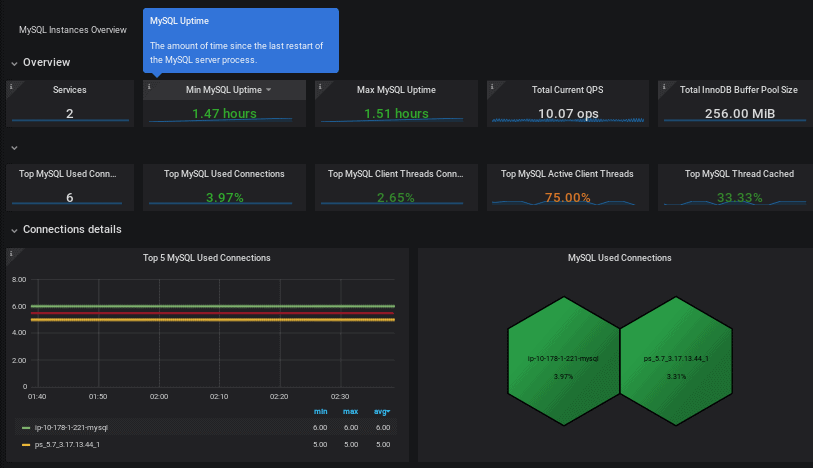
Percona is a high-rated, open-source database monitoring solution that is best for people who dislike vendor lock-ins. It offers faster performance and scalability features like nobody else to handle peak loads.
Key Features
- View and monitor all your open-source databases through a single console.
- Query Analytics and Metrics allows you to extract performance and query metrics to quickly find and fix abnormalities and prevent failures such as bottlenecks and outages.
- Run regular security checks for common security issues.
- Keep track of security scans and remediation of databases, and identify unexpected database queries effectively.
- Metrics Monitor tool provides a detailed historical view of performance metrics.
- Time-based graphs are divided into dashboards by themes. These themes can be based on database services or general metrics like Network, CPU, Memory, or Disk performance.

Why do we recommend it?
Percona is recommended for its open-source nature and ability to optimize performance and enhance security in business-critical database ecosystems. It's particularly notable for handling peak loads and providing detailed performance insights.
With Percona database monitoring, you can optimize performance, reduce complexity and enhance the security of your business-critical database ecosystems, regardless of their location or environment.
Who is it recommended for?
Percona is ideal for those who prefer open-source solutions and need a comprehensive, transparent, and well-documented tool for monitoring open-source databases.
Pros:
- Completely free
- Open-source and transparent project
- Well documented
Cons:
- Not ideal for enterprises
- Must be used in conjunction with Percona server
Website Link: https://www.percona.com/software/database-tools/percona-monitoring-and-management
Conclusion
These intelligent, feature-packed monitoring tools can help you keep an eye on all your databases to detect unusual or deceiving behavior.
With the necessary performance metrics and insights, you can fix problematic queries, issues, and optimize database performance faster. Besides, these modern tools also help you with strategic capacity planning.
Database Monitoring Tools FAQs
Can database monitoring be outsourced?
Yes, database monitoring can be outsourced to a third-party provider. This can be a cost-effective option for businesses that do not have the resources or expertise to manage database monitoring in-house.
Can database monitoring tools be used for multiple databases?
Yes, many database monitoring tools can be used for multiple databases, including different database platforms. This can provide a centralized view of database performance and help streamline management and troubleshooting.
How often should I monitor my database?
The frequency of database monitoring will depend on factors such as the size of your database, the number of users, and the criticality of the data. However, in general, it's recommended to monitor databases at least daily or weekly, with more frequent monitoring during periods of high activity.
Can database monitoring tools provide alerts?
Yes, many database monitoring tools can provide alerts via email, text message, or other channels when specific metrics or events exceed a certain threshold or meet certain criteria. This can help ensure that issues are identified and addressed in a timely manner.
How can database monitoring help with troubleshooting?
Database monitoring can help with troubleshooting by providing detailed information about database performance and activity, which can help identify the root cause of issues.
How do I choose a database monitoring tool?
When choosing a database monitoring tool, consider factors such as the type of database you're using, the types of metrics you need to monitor, and the level of automation and integration with other tools you require. It's also important to consider the cost and support options available for each tool.


