
A few decades ago, IBM came up with data servers that could efficiently process trillions of transactions every second. Known as mainframes, these tools were ideal for the batch processing that existed then. Also, it came with high levels of security and reliability. Due to these advantages, many companies started leveraging mainframes' computing power to speed up transactions.
Fast forward to today and these mainframes still exist. This means you require tools to monitor their performance and availability, and these are called mainframe monitoring tools. The good news is that there are many such monitoring tools available today, but choosing the appropriate one can be a challenge.
Here is our list of the best mainframe monitoring tools:
- ManageEngine OpManager Plus – EDITOR'S CHOICE This tool offers enterprise server monitoring and handles all servers, critical applications, services, and processes. It also stores all the current and historical data to provide the insights you need for decision-making. Start a 30-day free trial.
- Site24x7 – FREE TRIAL An end-to-end server and application monitoring tool that offers deep visibility into the health and performance of your mainframe systems. Its real-time insights, alerts, reports, and dashboards provide the information you need for quick troubleshooting. Start a 30-day free trial.
- Datadog This is an advanced monitoring platform that provides the flexibility to add on any number of monitoring tools based on your environment. For monitoring mainframe systems, you can add a tool called Mainstorconcept's z/IRIS software.
- Dynatrace Dynatrace's AI-based monitoring platform works well on Mainframes to provide insights about IBM z/series computers in the context of your overall system and infrastructure.
- Pandora FMS This solution can monitor z/OS systems and integrates the data collected from it with the other parts of your infrastructure. All this means you get a unified view of your complete system.
- BMC Automated Mainframe Intelligence (AMI) This platform uses automated intelligence to measure and optimize the performance of mainframe systems.
Our methodology for selecting the best mainframe monitoring tool:
We've analyzed these tools based on the following key criteria:
- Comprehensive monitoring capabilities for mainframe systems, including IBM z series
- Ability to gather and analyze in-depth data from mainframes for insightful reporting
- Multi-vendor support to handle diverse server environments effectively
- Real-time and historical data analysis for proactive monitoring and decision-making
- Effective alert and notification systems across multiple channels
- Integration capabilities with other IT management tools and platforms
- User-friendly interface with customizable dashboards and reporting for ease of use
- Compliance support for industry standards such as PCI and HIPAA
- Scalability to adapt to growing organizational needs
Now, let's take a detailed look at each of these tools.
The Best Mainframe Monitoring Tools
1. ManageEngine OpManager Plus – FREE TRIAL
ManageEngine OpManager Plus is a comprehensive server monitoring tool. It continuously monitors all critical servers, applications, and processes, including mainframe systems. Note that this tool doesn't run independently on the z/OS, but can monitor all IBM z series mainframes.
Key Features:
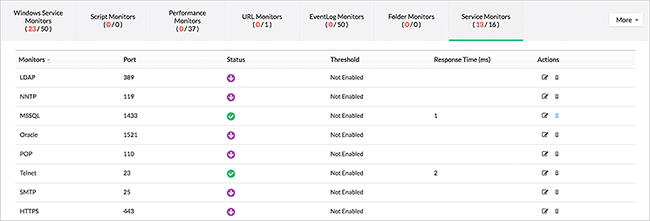
- Different Servers One of the biggest advantages of OpManager Plus is its ability to monitor multiple vendors including IBM z series machines. It can monitor more than 15 key services and up to 50 critical parameters, so you're always on top of the performance of your systems. It can also monitor URLs and scripts as a part of website monitoring. It works well for scripts such as Perl, Python, PowerShell, VBScript, etc.
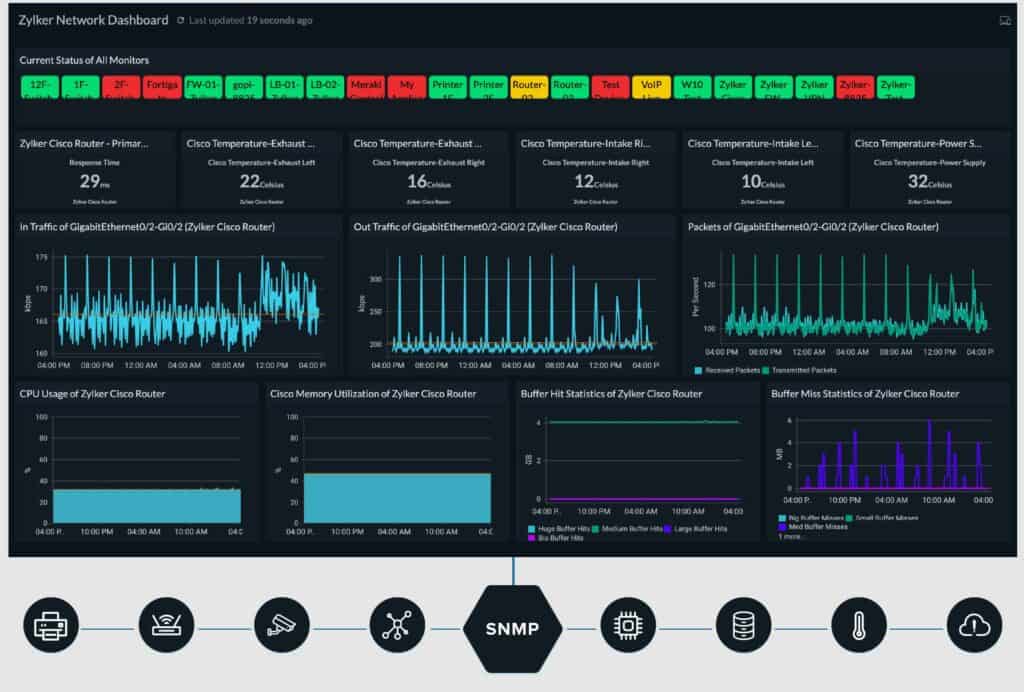
- Detailed Insights This platform can collect in-depth data and analyze the same to provide meaningful insights. It uses both historical and real-time data to provide the information you need to make critical decisions. This information is even displayed on an intuitive dashboard to give you a holistic view of your entire infrastructure.
- Visibility OpManager Plus provides four layers of visibility into your organization's IT systems and operations. These four layers are – infrastructure security, application performance, server and storage, and network. Armed with this information, your IT admins can quickly identify the cause of a problem and troubleshoot it before it impacts the wider organization. It also supports proactive monitoring and consistent performance.
- Reporting and Compliance This tool generates different reports that can come in handy for various departments. Also, these reports help with internal auditing and support decisions at various levels. These reports also help to comply with industry standards such as PCI, HIPAA, etc.
- Instant Notifications Another advantage of this platform is that it sends instant notifications and alerts through multiple channels such as email, Slack, web consoles, text messages, and more. This flexibility ensures that the responsible people are immediately informed about critical issues, so they can take the necessary actions right away.
Feature distinction
The detailed reports it generates for each CPU instance.
Why do we recommend it?
ManageEngine OpManager Plus is recommended for its ability to continuously monitor all critical servers, applications, and processes, including mainframe systems. It excels in providing detailed insights from both historical and real-time data, and its capability to monitor multiple vendors, including IBM z series machines, is a significant advantage.
In all, OpManager Plus is a comprehensive tool that works well for all environments and servers. You can best leverage this tool in a multi-vendor setup where it can get difficult to gather insights from individual series of machines.

Who is it recommended for?
This tool is ideal for IT administrators in organizations that operate in a multi-vendor environment and require extensive server monitoring capabilities. It is particularly suitable for those needing detailed insights into their infrastructure's performance and proactive monitoring to prevent issues.
Pros:
- Designed to work right away, features over 200 customizable widgets to build unique dashboards and reports
- Leverages autodiscovery to find, inventory, and map new devices
- Uses intelligent alerting to reduce false positives and eliminate alert fatigue across larger networks
- Supports email, SMS, and webhook for numerous alerting channels
- Integrates well in the ManageEngine ecosystem with their other products
Cons:
- Is a feature-rich tool that will require a time investment to properly learn
Get a custom quote based on your business needs. Download a 30-day free trial version of OpManager Plus.
EDITOR'S CHOICE
ManageEngine OpManager Plus is the editor’s choice for the best Mainframe monitoring tool because it provides full-stack observability across your systems. Specifically, it monitors business-critical systems and applications and sends alerts in case of issues. What we love is that it converts raw data into actionable insights, and this speeds up the troubleshooting process for engineers. Additionally, it leverages AI/ML to provide real-time visibility into the performance of Mainframe systems to ensure that you address issues before they impact operations. Due to these reasons, OpManager Plus sits at the top of our list.
Download: Start a 30-day FREE Trial
Official Site: https://www.manageengine.com/it-operations-management/
OS: Windows, Linux
2. Site24x7 – FREE TRIAL
Site24x7 is an end-to-end monitoring tool that combines metrics, logs, and events to track the availability and health of all your Mainframe servers. It correlates data and identifies dependencies, so you can proactively fix issues before they impact organizations.
Key Features
- Trends and Insights: Examines trends and insights to provide insights into server issues.
- Metrics: Monitors a wide range of metrics to help pinpoint the rootcause of problems.
- Notifications: Sends notifications when there are any changes in your internal resources, like URLs, ports, files, directories, etc.
- AI-driven Insights: Make it easy to proactively fix issues before they impact the wider organization.
- Automation Profiles: Comes with automation profiles to manage alert remediation.
Feature Distinction
Uses Zia-based predictive analysis and anomaly detection to proactively identify issues.
Why do we recommend it?
We recommend Site24x7 as it takes a proactive approach to monitoring and issue detection. It combines logs and metrics from multiple sources and uses AI-driven anomaly detection algorithms to identify issues early. As a result, you can fix issues before a wider impact is created.
A notable aspect is the level of detail it offers into the root cause of the problem. It examines trends and compares the value of metrics with thresholds. Accordingly, it identifies problems and their root causes to speed up troubleshooting.

Who is it recommended for?
It is a good choice for server administrators, network engineers, and Mainframe developers who are responsible for maintaining the health and performance of Mainframe systems.
Pros:
- Highly scalable and grows well with your infrastructure.
- Examines trends and insights in detail to provide relevant information.
- Reduces alert fatigue
- Comes with an easy-to-use interface.
- Generates reporting for auditing and compliance.
Cons:
- May be too complex for small organizations.
Site24x7 offers three plans, namely, Lite, Professional, and Enterprise. They come with an annual subscription of $9, $42, and $625, respectively.
Register for access to the 30-day free trial.
3. Datadog
Datadog is a highly flexible monitoring platform that allows the integration of many different tools to it. One such tool that helps with mainframe monitoring is Mainstorconcept's z/IRIS software. This tool monitors the health of your IBM Mainframe z/OS systems, so you can stay on top of the health and performance of your systems as a whole.
Mainstorconcept's z/IRIS is available in Datadog's marketplace, which means you can seamlessly integrate this tool with the remaining metrics collected by Datadog. Needless to say, it will give a more holistic view of your system's health.
Benefits of Integration with Datadog
Mainstorconcept's z/IRIS software is a leading analytics tool for enterprise mainframe systems. Instead of looking at its features individually, let's see the synergy that it offers when it integrates with Datadog's monitoring.
- Combined Metrics Probably, the biggest advantage is the combined metrics you will get. When the data from Mainstorconcept's z/IRIS software is combined with the metrics gathered by Datadog across other parts of your system, you will get a rich set of data. Using this information, you can better understand the health and performance of your system.
- Quick Troubleshooting The other advantage is quick troubleshooting of any of your mainframe systems. Again, the holistic view provided by Datadog will make it easier for you to get the background and context of the errors, so the same can be fixed quickly and easily. Undoubtedly, this will reduce your mean time to resolution and at the same time, will improve the overall system reliability.
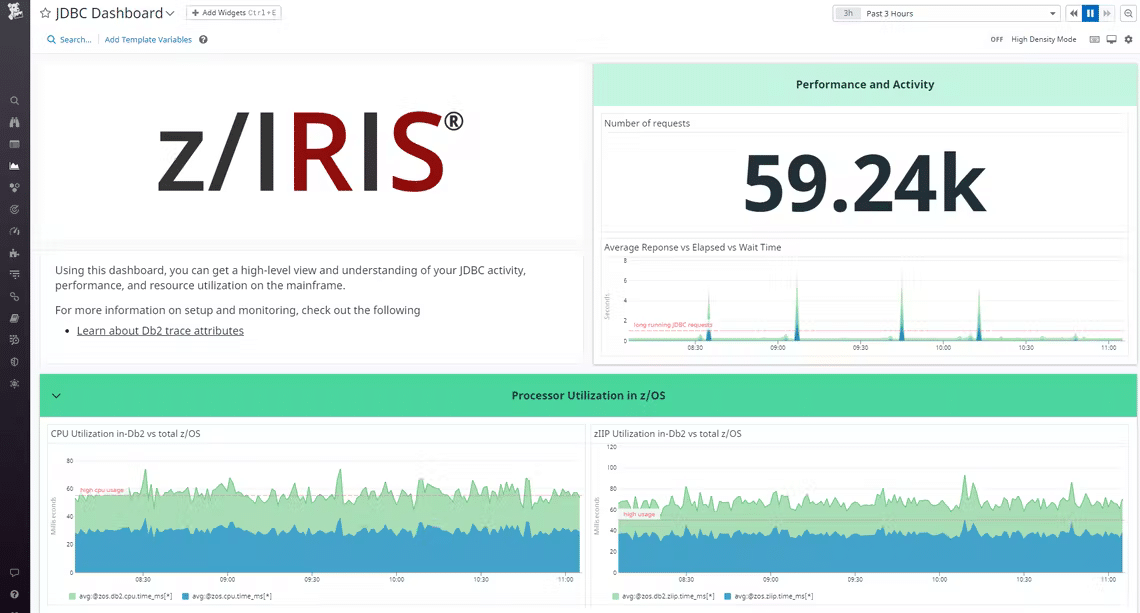
- Dashboards Data from Mainstorconcept's z/IRIS software is integrated with Datadog's dashboard. This gives a complete understanding of your infrastructure. Concurrently, you'll also be able to drill down to the specific information you need. Also, you can use the combined metrics on your dashboard to better understand the efficiency of your mainframe databases against the entire infrastructure. Datadog also comes with two out-of-the-box dashboards that provide visibility into APIs and JDBCs.
- Automated Alerts Mainstorconcept's z/IRIS software provides information about throughput, latency, and resource utilization. You can set up your system to send automated alerts when values go above or below the established baselines. Likewise, you can also set up the system to send alerts in case of Db2 deadlocks. This tool will provide the metadata, lock request, duration of the local request, and other related information, so you can understand the root cause better.
- In-depth Control As soon as you integrate Mainstorconcept's z/IRIS software with Datadog's APM, data from z/OS is integrated into Datadog's database. As a result, this information will be displayed in the Live Request Flow Map, so you can know the performance of your mainframe systems in real-time.
Why do we recommend it?
Datadog, when integrated with Mainstorconcept's z/IRIS software, provides a flexible and comprehensive monitoring solution for mainframe systems. This combination offers combined metrics for a holistic view of the system's health, quick troubleshooting capabilities, and detailed dashboards. The automated alerts and in-depth control over mainframe performance make it an effective tool for modern IT environments.
In all, Mainstorconcept's z/IRIS software is an advanced tool for monitoring mainframe systems. But when it is combined with Datadog, the results are even better and more accurate. Above everything, it provides the system-wide visibility you need to take appropriate action to maintain your system's health and performance.

Who is it recommended for?
Datadog with Mainstorconcept's z/IRIS is suitable for organizations looking for a unified monitoring platform that can incorporate mainframe monitoring into their broader IT infrastructure. It is ideal for those who need real-time insights into their mainframe systems and wish to integrate these insights with other IT monitoring data.
Pros:
- Has one of the most intuitive interfaces among other network monitoring tools
- Cloud-based SaaS product allows monitoring with no server deployments or onboarding costs
- Can monitor both internally and externally giving network admins a holistic view of network performance and accessibility
- Supports auto-discovery that builds network topology maps on the fly
- Changes made to the network are reflected in near real-time
- Allows businesses to scale their monitoring efforts reliably through flexible pricing options
Cons:
- Would like to see a longer trial period for testing
The cost depends on how you build your system. Here is the detailed pricing that you can use to decide which integrations to include as a part of your monitoring platform. Click here to start a free trial.
4. Dynatrace
Dynatrace extends its AI-based monitoring capabilities to include IBM z/series mainframe computers. This helps you to stay on top of your entire stack's performance and in the process, provides more control and visibility to your operations.
Key Features:
- Provides the Context Most companies today have a mix of mainframes, web servers, and enterprise servers as a part of their IT infrastructure. This is why Dynatrace provides all the metrics related to mainframes but within the larger context of your entire infrastructure. The biggest advantage is that you know how your mainframe servers are performing as a part of your overall environment and accordingly, can decide how you can improve its performance and efficiency.
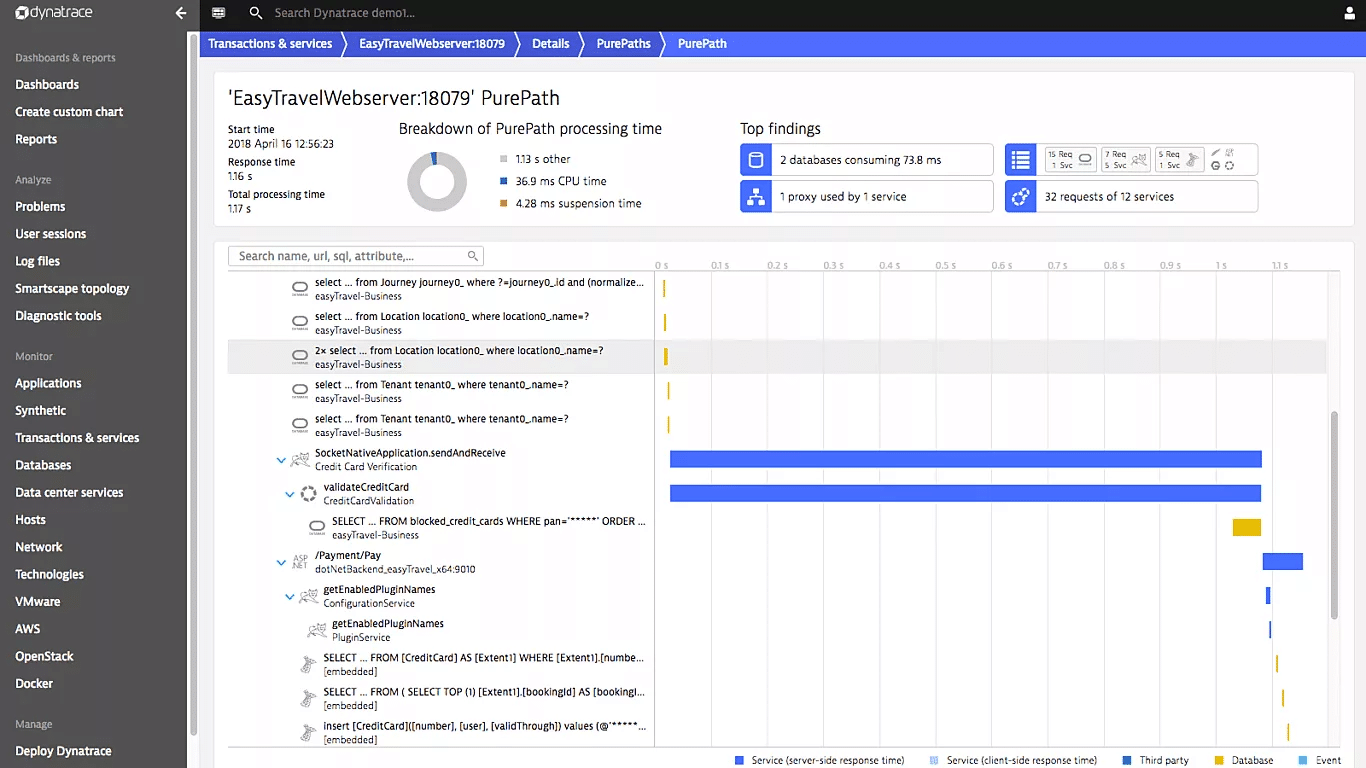
- Detailed Visibility Dynatrace uses the PurePath technology to capture the service flow data and through it, provides visibility into your code. You can also view CICS services, database statements, and more. All this information can provide an accurate idea of what's happening in your system at the code level. It will also make it easy to troubleshoot when required.
- Improves Efficiency Dynatrace has come up with a lightweight architecture for distributed mainframe environments. While this won't work for highly-regulated mainframes, it improves efficiency and performance in distributed environments. Further, it offers auto-detection and auto-instrumentation, both of which are sure to come in handy for maximizing control and performance.
- AI-powered Dynatrace's mainframe monitoring solution provides native support for IBM mainframes. Due to this ability, Dynatrace applies its AI technology to get answers to some of the contextual questions.
Why do we recommend it?
Dynatrace is recommended for its AI-based monitoring capabilities that extend to IBM z/series mainframes, providing detailed visibility and contextual insights about mainframe performance within the overall IT infrastructure. Its PurePath technology offers in-depth code-level visibility, and the lightweight architecture for distributed mainframe environments enhances overall system efficiency.
In all, Dynatrace is designed to monitor mainframes within the context of the larger system infrastructure, so you can get the widest visibility. It also eases troubleshooting and can optimize the performance of your IT systems as a whole.

Who is it recommended for?
Dynatrace is particularly suited for large organizations with a mix of mainframes and modern IT infrastructure who require AI-powered, in-depth monitoring and optimization of their entire IT ecosystem.
Pros:
- Highly visual and customizable dashboards, excellent for enterprise NOCs
- Operates in the cloud, allowing it to be platform-independent
- Leverages AI to provide baseline analysis and detect user behavior anomalies
Cons:
- Designed specifically for large networks, smaller organizations may find the product overwhelming
Dynatrace offers six plans:
- Full-stack Monitoring – $69/month for an 8GB host.
- Infrastructure Monitoring – $21/month for an 8GB host.
- Digital Experience Monitoring – $11/month for 10k Digital Experience Monitoring units.
- Application Security – $12/month for an 8GB host.
- Open Ingestion – $25/month for 100k annual Davis Data units.
- Cloud Automation – $0.10/Cloud Automation Unit.
Click here for a free trial.
5. Pandora FMS
Pandora FMS has a solution for z/OS systems to integrate mainframe monitoring with your complete infrastructure. This way, you get contextual information about the health and performance of your mainframe systems, and this can help with troubleshooting and maintenance as well.
Key Features:
- Reduces Costs Pandora FMS monitors the resources consumed by mainframes in real-time. This will help you to ascertain the costs, so you can modify the necessary parameters to save on costs. It also gives you more control over your billing parameters.
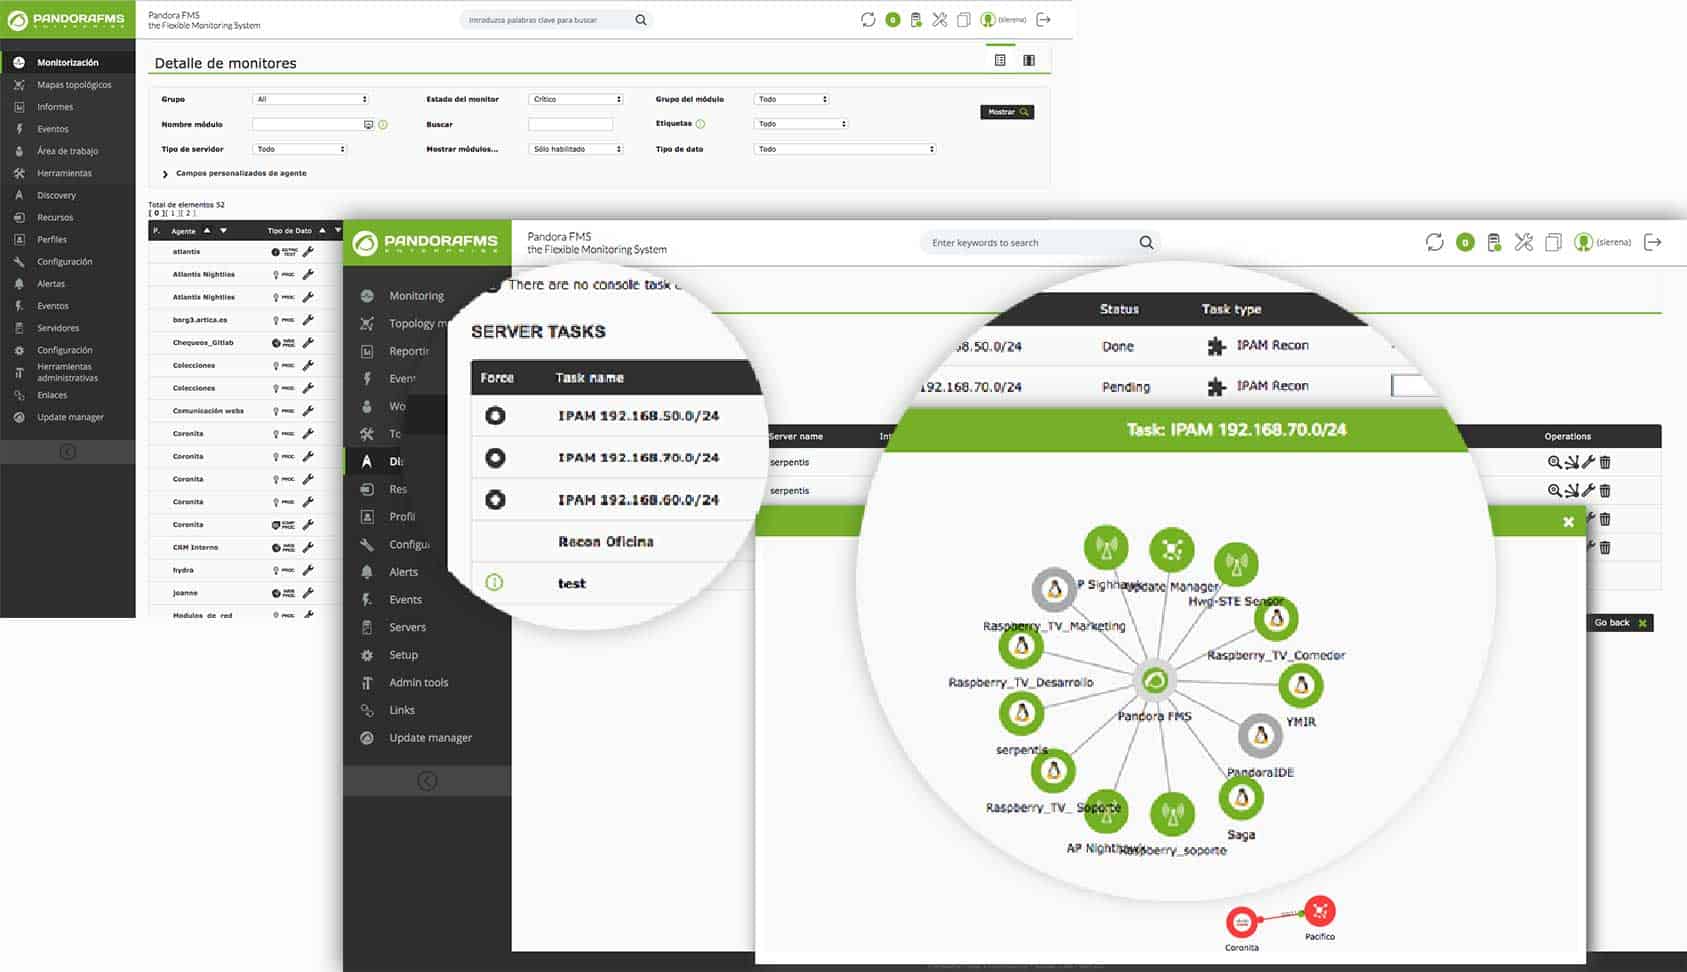
- Remote Monitoring A salient feature of Pandora FMS is its remote monitoring capabilities. You can monitor a server remotely without having to install any additional software on the mainframe computer. Pandora FMS uses a component called RMF Data Portal Monitor that extracts and analyzes data from LPAR, Sysplex, etc.
- Unified View Pandora FMS is simple to use as you can integrate mainframe monitoring in the same visual console. This provides a unified view of the health and performance of your entire infrastructure as well as where your mainframe system fits in.
Why do we recommend it?
Pandora FMS stands out for its remote monitoring capabilities and integration of mainframe monitoring with the overall IT infrastructure, providing a unified view of system health. Its focus on reducing costs and providing detailed visibility into mainframe resource consumption makes it a cost-effective solution for mainframe monitoring.
In all, Pandora FMS has advanced mainframe monitoring capabilities that integrate well with the overall infrastructure of your organization to provide detailed visibility.

Who is it recommended for?
This tool is suitable for organizations that require a cost-effective solution for monitoring mainframe systems remotely. It is especially beneficial for businesses seeking a unified monitoring solution that integrates mainframe performance data with broader IT infrastructure monitoring.
Pros:
- Works alongside Pandora NMS for additional address management functionality
- Supports patch management, making it a more complete tool than other managers
- Can group LANs with other non-VPN WANs into a single group for easier management
- Open-source with paid version
Cons:
- Outdated interface, visualizations are lacking and nested menus can be overwhelming at scale
Get a custom quote. Click here to start a 30-day free trial.
6. BMC Automated Mainframe Intelligence (AMI)
BMC Automated Mainframe Intelligence (AMI) comes with a wide range of features to monitor your mainframe systems and optimize them in the best way possible.
Key Features:
- Enhances the Digital Experience BMC Automated Mainframe Intelligence (AMI) comes with a wide range of features to monitor your mainframe systems and optimize them in the best way possible. it also helps to leverage the true power of these systems for your business and at the same time, optimizes the resources needed for operations, maintenance, and integration. All these aspects also help you to react to your changing market demands more quickly.
- Optimizes the Overall Ecosystem This tool optimizes the overall ecosystem, thereby making the necessary infrastructure and data available when you need them. In turn, this enhances collaboration and makes the mainframe database change management more efficient.
- Increases Availability The constant monitoring strategy of BMC AMI ensures that any gaps are quickly identified and fixed, so there's no impact on performance or availability. It also ensures that you have the necessary capacity at optimal costs.
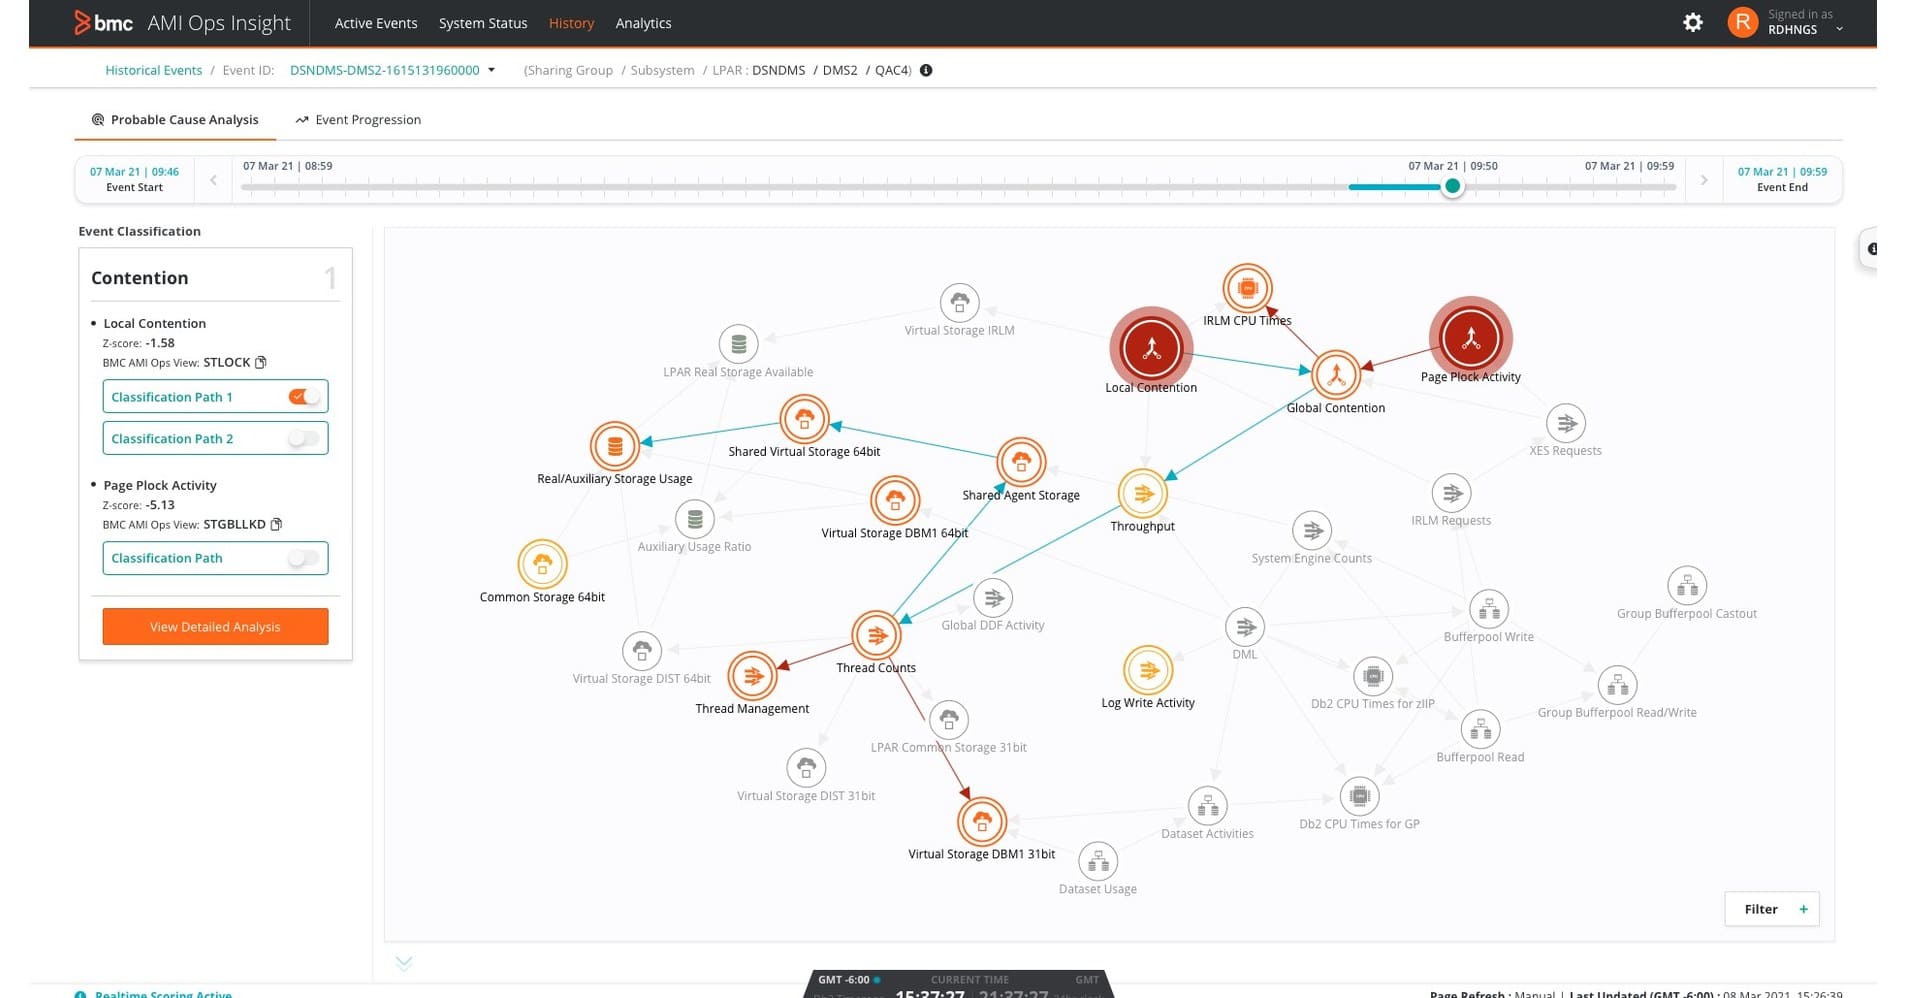
- Improves Security BMC AMI's monitoring capabilities reduce the chances of cyberattacks on mainframes. Its actionable insights automatically reduce the chances of a threat as well as the Mean Time to Respond(MTTR).
Why do we recommend it?
AMI is recommended for its extensive range of features that enhance the digital experience, optimize the mainframe ecosystem, increase availability, and improve security. Its focus on leveraging mainframe systems for business optimization, along with its proactive monitoring and automated threat response capabilities, make it a robust choice for mainframe monitoring.
It also helps to leverage the true power of these systems for your business and at the same time, optimizes the resources needed for operations, maintenance, and integration.

Who is it recommended for?
BMC AMI is ideal for larger networks and enterprises that require comprehensive mainframe monitoring and optimization. It is particularly suited for organizations that prioritize high availability, security, and efficient resource utilization in their mainframe operations.
Pros:
- Simple yet intuitive interface
- Can automated security tasks such as vulnerability scans, and automated network probes
- Designed for larger environments with multiple mainframes and larger clusters
- Can automate configuration restoration
Cons:
- Better suited for larger networks, especially those with in-house remediation teams
Overall, BMC AMI is designed for monitoring mainframe systems and to enhance their performance and availability.
Final Words
To conclude, organizations continue to use mainframe systems because of their efficiency in processing batch transactions. This means you need advanced mainframe monitoring tools that will constantly oversee the performance and health of these systems. The above-mentioned tools are highly capable of this monitoring.


