
MongoDB is a free, open-source NoSQL-based database storage system built to simplify scalability and development and support high volumes of data storage and processing.
Unlike SQL database systems, the MongoDB database is based upon a document system that allows you to index, query and sort data seamlessly. In short, it stores data in JSON-like documents instead of tables. It is a distributed database that has dynamic schemas for unstructured data with high availability and built-in horizontal scaling features. Besides, it is completely free to use.
Here’s our list of the best MongoDB Monitoring Tools:
- Site24x7 – FREE TRIAL A feature-packed solution that effectively monitors the performance, usage stats and availability of your MongoDB servers. Start a 30-day free trial.
- ManageEngine – FREE TRIAL Α tool to notify users of performance issues and troubleshoot issues faster with root cause analysis tools. Start a 30-day free trial.
- Paessler PRTG – FREE TRIAL A professional-grade database monitoring tool for your MongoDB system. Start a 30-day free trial.
- Datadog An intelligent MongoDB monitoring tool as integration to help you visualize key MongoDB metrics and correlate its performance with other critical applications.
- SolarWinds Database Performance Monitor (DPM) One of the best MongoDB monitoring tools for optimization and high performance of your entire ecosystem.
- ongostat Α tool offered in the MongoDB package itself.
- mongotop Α critical tool in the MongoDB package used to extract real-time stats of your running MongoDB instances.
- Studio 3T Αn advanced, well-integrated development environment designed deliberately for teams working on MongoDB systems.
- NoSQL Booster Α bunch of innovative features to monitor and optimize the performance of your MongoDB instances.
- MongoDB Compass Αn excellent tool to get a deeper overview of your MongoDB instance's behavior and identify bottlenecks causing performance issues.
- NoSQL Manager Α popular tool, renowned for its ability to integrate a user-friendly UI with a powerful shell.
- Knowi Α popular tool, renowned for its ability to integrate a user-friendly UI with a powerful shell.
Why do you need MongoDB Monitoring?
MongoDB helps you with unlimited virtual scaling of applications, but it can also increase complexity of the application infrastructure. This is the reason why businesses need a powerful MongoDB monitoring tool to troubleshoot issues and plan load distribution on time.
MongoDB monitoring tools provide deeper visibility into the key metrics and performance of the MongoDB system. Besides, these tools also combine analytical features to analyze performance trends and forecast utilization behavior.
The Best MongoDB Monitoring Tools
Our methodology for selecting MongoDB monitors and software
We reviewed various MongoDB monitors and analyzed the options based on the following criteria:
- Support for MongoDB as well as other databases and environments
- Support for automation, alerting, and reporting
- A facility to analyze database performance overtime
- Graphical interpretation of data, such as charts and graphs
- A free trial period, a demo, or a money-back guarantee for a free assessment
- A good price that reflects value for money when compared to the functions offered
1. Site24x7 – FREE TRIAL
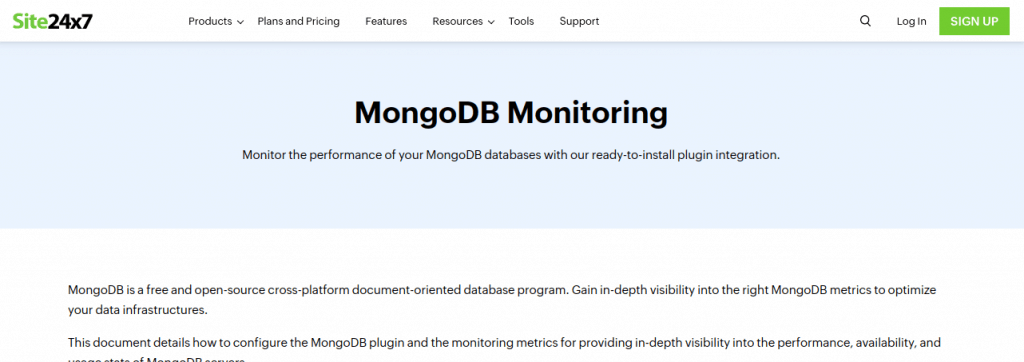
Site24x7 MongoDB Monitoring tool is again a feature-packed solution that effectively monitors the performance, usage stats and availability of your MongoDB servers. It offers ready-to-install plugin integration for quick and deeper visibility into your MongoDB metrics and optimization of data infrastructures.
Key Features:
Provides in-depth visibility into performance metrics such as:
- Connections available: count of the total number of unused connections available for new clients in your MongoDB server
- Heap usage: total heap space in bytes used by the MongoDB databases
- Current connections: count of the total number of connections active in the MongoDB database
- Total open cursors: identifies the total number of cursors currently open in your MongoDB infrastructure
Unique Feature
It provides the performance metrics for your architecture, along with the memory and CPU usage, operations counts, and execution times.
Why do we recommend it?
Site24x7 is recommended for its comprehensive approach to MongoDB monitoring. It offers in-depth visibility into performance metrics and user-friendly plugin integration, making it a holistic monitoring solution.

Who is it recommended for?
Recommended for administrators and IT professionals who need a single platform for network, infrastructure, and real user monitoring, especially those who value intuitive platforms with minimal training requirements.
Pros:
- One of the most holistic monitoring tools available, supporting networks, infrastructure, and real user monitoring in a single platform
- Uses real-time data to discover devices and build charts, network maps, and inventory reports
- Platform is intuitive, little training is needed to get fully functional
- User monitoring can help bridge the gap between technical issues, user behavior, and business metrics
- Supports a freeware version
Cons:
- Is a very detailed platform that will require time to fully learn all of its features and options
Price: You can get a quote when you sign up and register for a 30-day free trial.
Website Link: https://www.site24x7.com/plugins/mongodb-monitoring.html
2. ManageEngine Applications Manager – FREE TRIAL
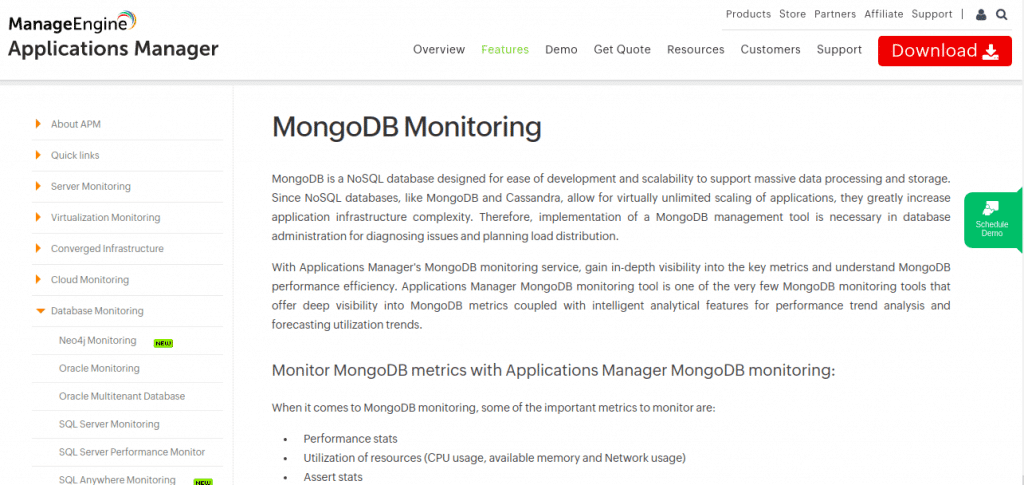
ManageEngine Applications Manager features a MongoDB monitoring tool to notify users of performance issues and troubleshoot issues faster with root cause analysis tools.
Key Features
- Set threshold values to prevent resource saturation and performance hindrances
- Get instant alerts of all performance issues
- Perform root cause analysis to find the origin of the problem
- Reporting tools allow you to analyze and spot performance trends of MongoDB.
- Visualize and track key metrics to make informed decisions for servers.
- Extract historical reports of different attributes and compare them with other databases
- Employs machine learning technique to help you with plan capacity and forecast load of MongoDB servers
- Trends analysis reports help you with better resource allocation and planning
- Supports all versions of MongoDB up to 4.0.2.
Unique Feature
Besides MongoDB, it also monitors other relational and non-relational databases. This flexibility helps organizations that use multiple databases.
Why do we recommend it?
ManageEngine Applications Manager is recommended for its proactive monitoring capabilities and effective root cause analysis tools. It ensures quick troubleshooting and optimal performance of MongoDB instances.

Who is it recommended for?
This tool is suitable for businesses that require both on-premise and cloud deployment options, and for those who need comprehensive insights into the interdependencies between applications and business operations.
Pros:
- Offers on-premise and cloud deployment options, giving companies more choices for install
- Can highlight interdependencies between applications to map out how performance issues can impact businesses operations
- Offers log monitoring to track metrics like memory usage, disk IO, and cache status, providing a holistic view into your database health
- Can automatically detect databases, server hardware, and devices in real-time
Cons:
- Can take time to fully explore all features and options available
Website Link: https://www.manageengine.com/products/applications_manager/mongodb-monitoring.html
3. Paessler PRTG
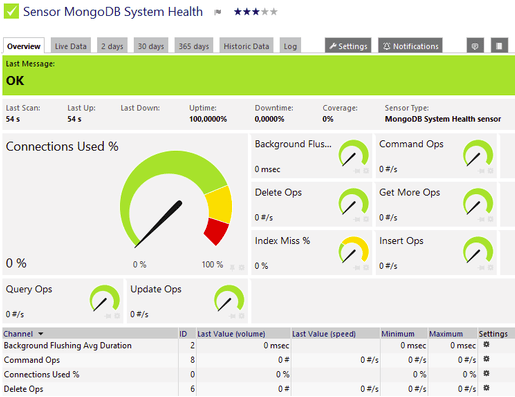
Paessler PRTG offers a professional-grade database monitoring tool for your MongoDB system. It monitors MongoDB availability, optimizes its performance and prevents downtimes. It queries data from the database with minimal connection, query or return times. At all times, you can see the execution time of the entire MongoDB database request on the intuitive dashboard.
Key Features
- All-in-one platform for database monitoring
- Analyzes and monitors specific datasets in your MongoDB database
- Combine database monitoring tool with customizable reports for quick analysis
- Predefined sensors for each database
- Can monitor your entire network and provide an overview of all your databases
- Checks for hardware errors, low disk space, memory and faulty configurations to prevent downtimes
- Features customizable alarm system for prompt notifications when problems arise. Get alerts through SMS or email.
Unique Feature
It comes with a web admin console to help you stay on top of your MongoDB's health and performance from anywhere.
Why do we recommend it?
Paessler PRTG is recommended for its all-encompassing network and database monitoring capabilities. It excels in providing detailed insights and customizability for MongoDB monitoring.
Paessler features a specific PRTG sensor for each database system which you can individually configure and also define queries for. With this approach, PRTG monitors specific datasets from your MongoDB system to optimize your business pipelines and extract critical KPIs.

Who is it recommended for?
Ideal for IT professionals who need a comprehensive platform with a focus on customizability and detailed reporting. It suits environments that require monitoring of a wide range of systems beyond MongoDB.
Pros:
- Uses a combination of packet sniffing, WMI, and SNMP to report network performance as well as discover new devices
- Autodiscovery reflects the latest inventory changes almost instantaneously
- Drag and drop editor makes it easy to build custom views and reports
- Supports a wide range of alert mediums such as SMS, email, and third-party integration
- Supports a freeware version
Cons:
- Is a very comprehensive platform with many features and moving parts that require time to learn
- Custom sensors can sometimes be challenging to manually configure
Website Link: https://www.paessler.com/database-monitoring
You can try Paessler PRTG through a fully functional free 30-day trial.
4. Datadog
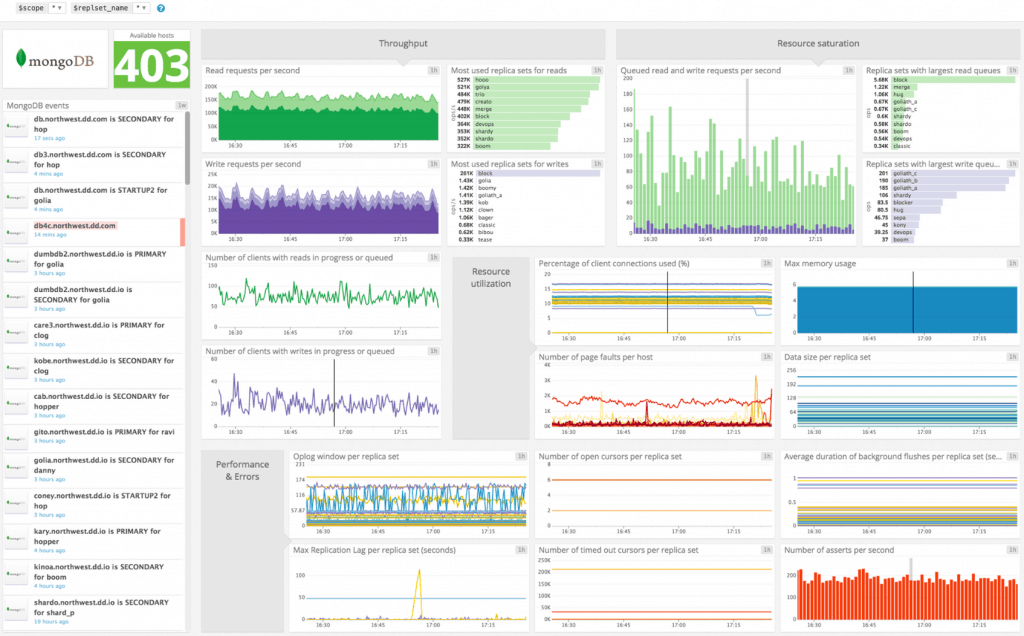
Datadog offers an intelligent MongoDB monitoring tool as integration to help you visualize key MongoDB metrics and correlate its performance with other critical applications.
It extracts various key metrics across your entire MongoDB ecosystem. And, you can create your own metrics with the use of custom find, count and aggregate queries.
Key Features
- Requires MongoDB v3.0+
- Requires no additional installation; comes included in the Datadog Agent package
- Monitors key MongoDB metrics such as uptime, storage size, user assertion, connections available, current connections, total created connections, total open cursors, page faults per second and more
- Emits an event every time a replication state changes in a Mongo node
- Consistently checks for service. If the Agent is unable to connect to MongoDB to collect metrics, it returns CRITICAL. Otherwise, it returns OK.
Why do we recommend it?
Datadog stands out for its cloud-based SaaS approach to MongoDB monitoring, offering easy-to-use dashboards and real-time data analysis for a comprehensive network view.

Who is it recommended for?
Recommended for businesses looking for a scalable monitoring solution that provides both internal and external network insights. It's particularly suitable for those who prefer cloud-based services without server deployment needs.
Pros:
- Easy-to-use customizable dashboards
- Cloud-based SaaS product allows monitoring with no server deployments or onboarding costs
- Can monitor both internally and externally giving network admins a holistic view of network performance and accessibility
- Supports auto-discovery that builds network topology maps on the fly
- Changes made to the network are reflected in near real-time
- Allows businesses to scale their monitoring efforts reliably through flexible pricing options
Cons:
- Would like to see a longer trial period for testing
Website Link: https://docs.datadoghq.com/integrations/mongo/?tab=standalone
5. SolarWinds Database Performance Monitor
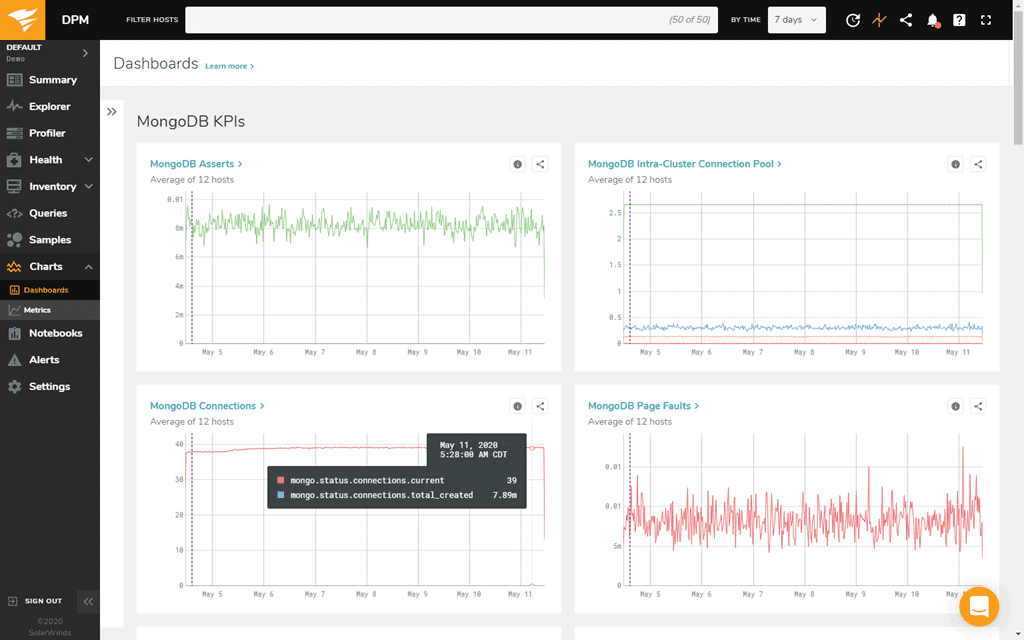
SolarWinds Database Performance Monitor (DPM) is one of the best MongoDB monitoring tools for optimization and high performance of your entire ecosystem. It efficiently performs real-time as well as historical analysis of index usage, execution, and query performance of MongoDB systems.
Key Features
- Uses automated profiling analysis, visualizations and intuitive dashboards to monitor errors, latency, throughput and other key metrics
- Helps resolve issues within minutes
- Reviews settings in the database instances, OS, and replica sets to identify abnormalities
- Continuously analyzes configurations to spot vulnerabilities and extracts real-time compliance status updates
- Mitigates cyber-attack risks through constant security checks
- Monitors database in the hybrid environment, On-Prem or cloud
- SaaS platform featuring web-based UI
- Customizable dashboards for critical analytics
Unique Feature
This tool can improve the performance of a wide range of databases like MongoDB, SQL, Oracle, SAP, and DB2 instances running on both the cloud and on-premises.
Why do we recommend it?
SolarWinds Database Performance Monitor is recommended for its robust capabilities in real-time and historical analysis of MongoDB systems. Its automated profiling and intuitive dashboards make monitoring efficient and user-friendly.

Who is it recommended for?
This tool is ideal for large and enterprise networks seeking comprehensive monitoring of their MongoDB ecosystem, especially those needing detailed insights into performance and security.
Pros:
- Designed with large and enterprise networks in mind
- Supports auto-discovery that builds network topology maps and inventory lists in real-time based on devices that enter the network
- Has some of the best alerting features that balance effectiveness with ease of use
- Supports both SNMP monitoring as well as packet analysis, giving you more control over monitoring than similar tools
- Uses drag and drop widgets to customize the look and feel of the dashboard
- Robust reporting system with pre-configured compliance templates
Cons:
- This is a feature-rich enterprise tool, small networks may find it overwhelming
Download 14-day trial: https://www.solarwinds.com/database-performance-monitor/registration
6. mongostat
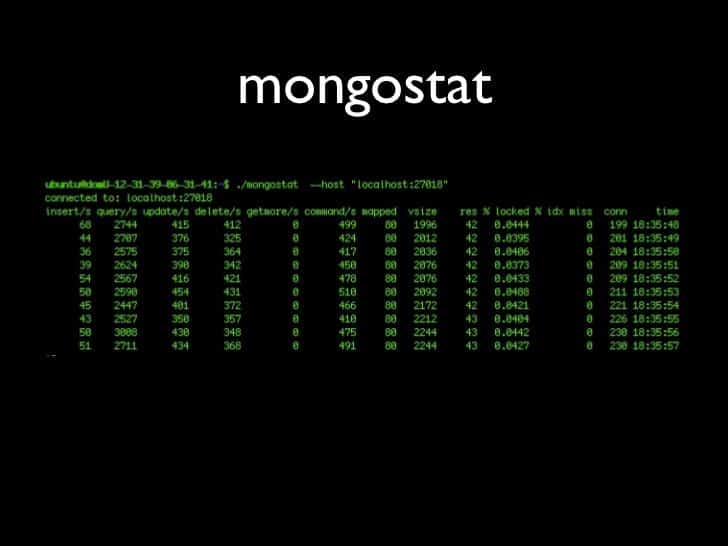
Mongostat is a tool offered in the MongoDB package itself. Users can leverage this tool to extract the real-time overview and status of their MongoDB database. The tool displays database operations by type, allowing the managers, business owners or DBAs to monitor how many updates, searches, inserts and deletions have taken place in the given time span.
Key Features
- Captures and returns the counts of MongoDB operations by type such as update, delete, query, insert, etc. These counts are reported on server’s load distribution
- Helps you deeply understand the distribution of operation types
- Aids capacity planning
Why do we recommend it?
Mongostat is recommended for its simplicity and effectiveness in providing real-time overviews and status of MongoDB databases. It's a lightweight tool ideal for quick insights.
Who is it recommended for?
Ideal for database administrators and business owners who prefer a straightforward, CLI-based monitoring tool that focuses on core MongoDB operations without the need for complex setups.
Pros:
- Extremly lightweight
- Barebones alternative to other Mongo monitoring tools
- Capture, records, and saves all MongoDB operations
- Can perform powerful searches on collected data
Cons:
- Not ideal for those looking for a more graphical solution
Website Link: https://docs.mongodb.com/database-tools/mongostat/#mongodb-binary-bin.mongostat
7. mongotop
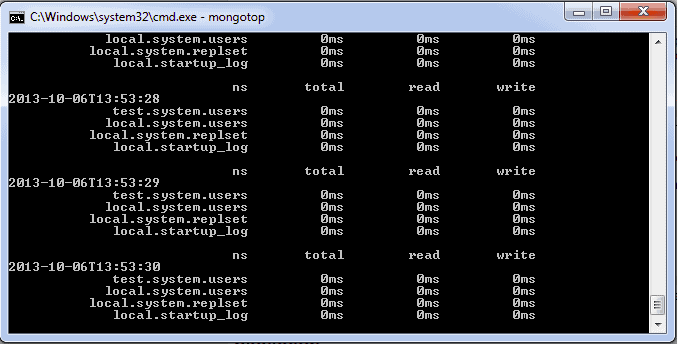
mongotop is another critical tool in the MongoDB package used to extract real-time stats of your running MongoDB instances. It provides users with key information related to the time taken to read and write data. With this information, IT professionals can create an index strategy and decide how to scale MongoDB to enhance its efficiency.
Key Features
- Mongo serverStatus command can display MongoDB current state and gather stats based on it
- dbStats command extracts storage stats for MongoDB including space used, the quantity of data, index counters, etc.
- CollStats shows the size and amount of data in any collection. Plus, it also provides index-related information
- Use mongotop to compare your database activity to see whether it matches your requirements or not.
Why do we recommend it?
mongotop is recommended for its ability to deliver real-time statistics on MongoDB instances, aiding in the development of efficient index strategies and scaling decisions.
Who is it recommended for?
This tool is suitable for IT professionals who require live metrics for MongoDB performance and are comfortable with a simple, uncluttered command-line interface.
Pros:
- Extracts live metrics from your Mongo database
- Can compare current stats to see if current activity matches set requirements
- Simple uncluttered CLI tool
Cons:
- Lacks data visualization
Website Link: https://docs.mongodb.com/database-tools/mongotop/
8. Studio 3T
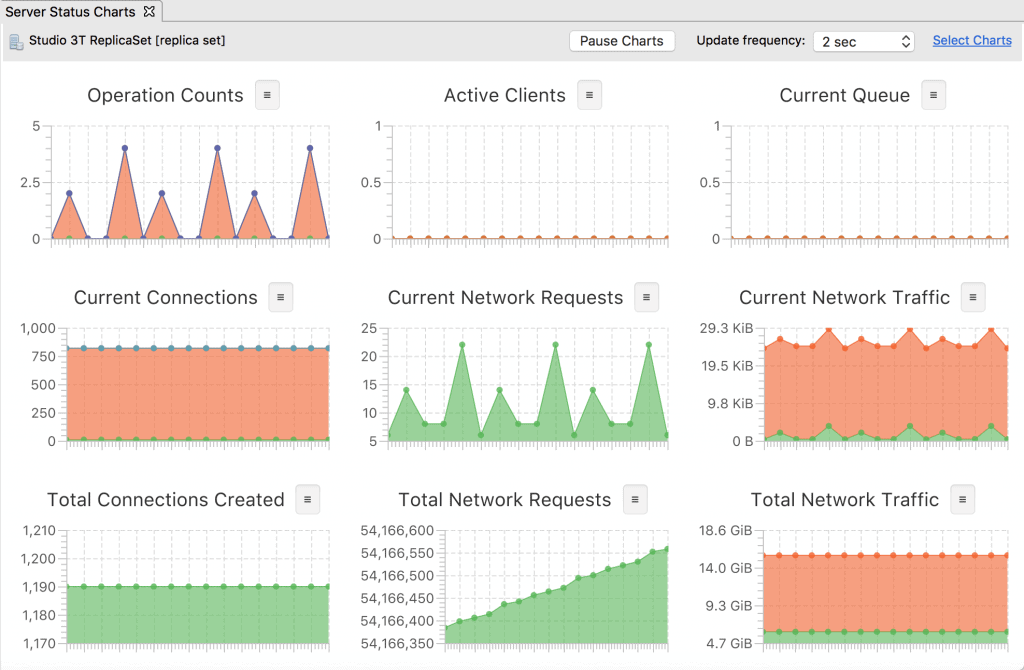
Studio 3T is an advanced, well-integrated development environment designed deliberately for teams working on MongoDB systems.
Key Features
- IntelliShell- Studio 3T’s inbuilt mongo shell is designed to autocomplete shell-specific methods, types and JavaScript standard library functions to save time.
- Aggregation Editor helps you write complicated queries in a short time.
- Task Scheduler feature automated repetitive MongoDB tasks like imports
- Query Code feature converts queries into five target languages: Node.js, C#, Java, Python and PHP
- Drag and drop tool to build queries visually
- Secure connection for replica sets and single MongoDB systems
- Seamlessly correlate and sync data
- Copy and paste documents across databases and servers
- Using SQL with INNER and OUTER joins helps you query MongoDB efficiently
Why do we recommend it?
Studio 3T is recommended for its advanced features and well-integrated environment, making MongoDB development and monitoring efficient and user-friendly.
The best feature about Studio 3T is its Visual Query Builder with a drag-and-drop tool to quickly build queries. This is what makes it a perfect solution for newbies. The Visual Query Builder supports JSON view, table view and tree view. Plus, all these three views come with an in-place code editor.

Who is it recommended for?
Ideal for larger development teams and environments that require a comprehensive suite of tools for MongoDB management, including automated tasks, code conversion, and query building.
Pros:
- Designed specifically for larger environments and dev teams
- Includes a helpful autocomplete function to improve workflow
- Task Scheduling and automating queries and mundane tasks
- Can easily copy and paste documents across databases
Cons:
- Better suited for dev teams
Website Link: https://studio3t.com/
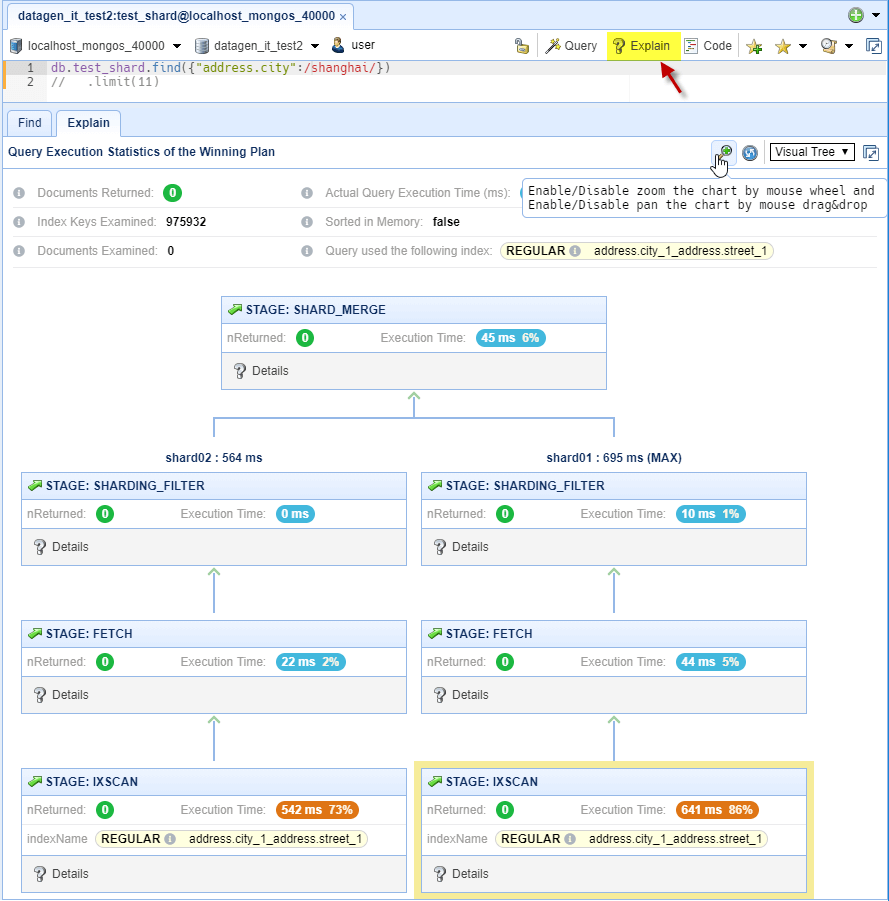
9. NoSQL Booster
NoSQL Booster comes with a bunch of innovative features to monitor and optimize the performance of your MongoDB instances.
Key Features
- Visual Explain plan displays ‘explain output’ into a better hierarchical view of the query plan for easy understanding. This allows for easy query tuning to resolve performance issues
- In-progress operations tool finds the operations that are culprits to unresponsiveness or slow performance of your MongoDB instances. The tool integrates killOp() and currentOp() commands to find and kill long-running operations faster.
- Database profiler displays logs information about MongoDB operations in “system.profile” collection.
- Comes with two MongoDB log viewers: one to parse and display recently logged MongoDB events and another one to parse and show external MongoDB log files.
- Parses log faster and outputs information related to its content such as component, severity, context, timestamp, and command-based messages.
- Can save parsed log entries for future analysis and querying
- Shows real-time status of events occurring in MongoDB instances
- Troubleshoots replica sets
Why do we recommend it?
NoSQL Booster is recommended for its innovative features that enhance MongoDB performance monitoring. Its IntelliSense experience and real-time analytics make it a powerful tool for database optimization.
One of the best features of NoSQL Booster is that it offers true IntelliSense experience- a built-in language service that helps you with code suggestions as you write. It auto-completes properties, methods, variables, keywords, and MongoDB collection names. There are myriads of inbuilt snippets to quickly write shell script queries.

Who is it recommended for?
Suitable for small to medium-sized teams looking for a robust alternative to CLI tools, offering detailed insights and analytics with a user-friendly interface.
Pros:
- Great alternative to CLI monitoring tools
- Includes autocomplete and code suggestions as your type
- Explains queries for each output
- Shows both live metrics as well as historic data
Cons:
- Ideal for small to medium sized teams
Website Link: https://nosqlbooster.com/monitoring
10. MongoDB Compass
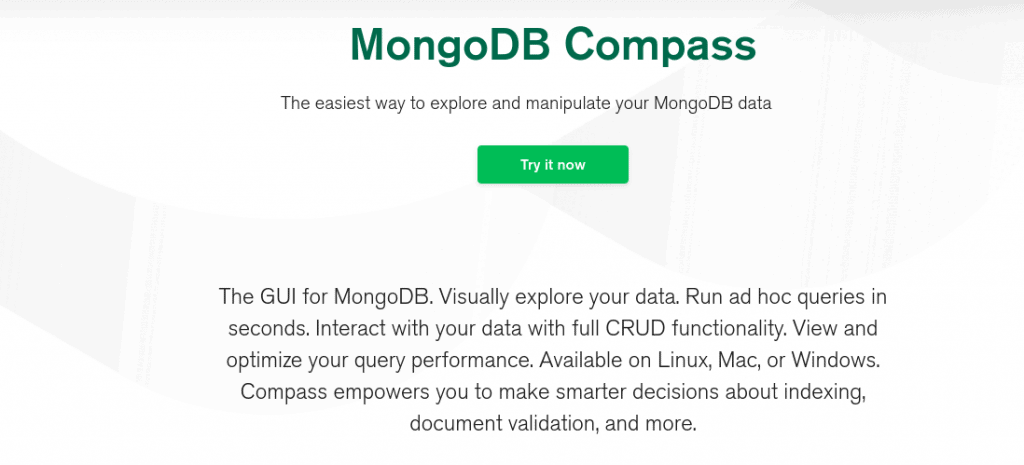
MongoDB Compass is an excellent tool to get a deeper overview of your MongoDB instances behaviour and identify bottlenecks causing performance issues. It is one of the best ways to manipulate your MongoDB data.
Key Features
- Intuitive GUI allows you to visualize, understand and interact with your data easily
- Powerful visual editing tool allows you to insert, modify and delete data
- Visual explain plan helps you understand, debug and optimize MongoDB performance. You can easily view utilization and manage the indices
- Analyzes MongoDB documents and shows rich structures in your collection via its intuitive GUI. Explore the schema to get insights into the types, frequency and ranges of fields in MongoDB datasets
- Provides real-time server stats to understand key metrics and database operations
- Point-and-click to build queries and instantly execute them. The tool will show results as sets of JSON documents as well as graphs
Why do we recommend it?
MongoDB Compass is recommended for its intuitive GUI and powerful tools that simplify data manipulation and performance optimization in MongoDB.
With Compass, you can view and optimize query performance, visually explore the data, use full CRUD functions to interact with your data and run ad hoc queries faster. The tool is available on Windows, Mac and Linux. All of these features help you with decision-making for enhanced document validation, indexing, etc.

Who is it recommended for?
Ideal for users in environments focused solely on MongoDB, especially those who value visual data exploration and easy-to-use query building features.
Pros:
- Includes intuitive visual editing
- Can easily compare live metrics
- Includes a visual explainer for simple insights
- Has an intuitive query builder that makes searching simple
Cons:
- Best for environments that only use MongoDB
Website Link: https://www.mongodb.com/products/compass
11. NoSQL Manager
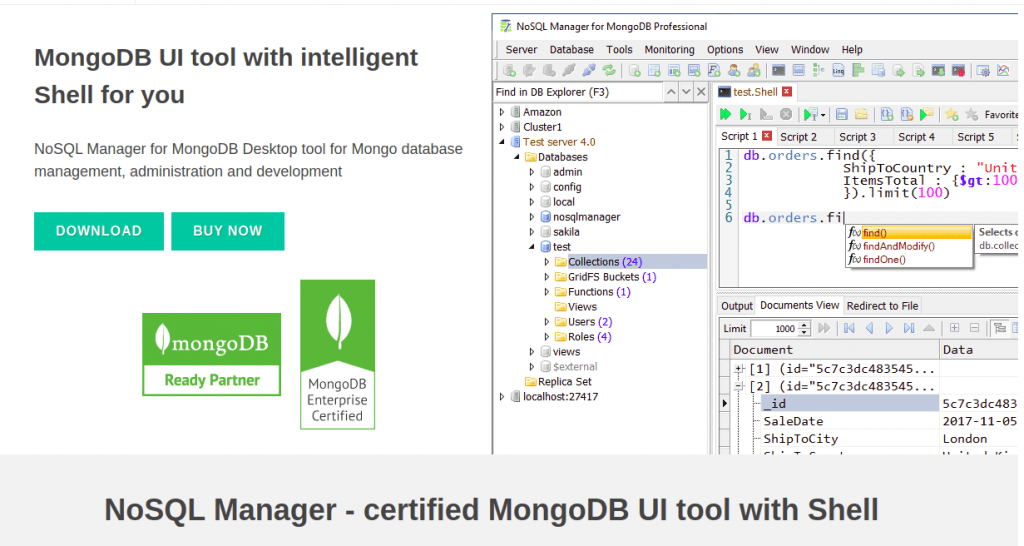
NoSQL Manager is a popular tool, renowned for its ability to integrate a user-friendly UI with a powerful shell.
Key Features
- Observes the state of your MongoDB database to spot problems before they lead to failures
- Gathers and displays key metrics such as queued read/write requests, read/write operations, number of client connections, connections with read and write operations queued or in-progress and so on.
Why do we recommend it?
NoSQL Manager is recommended for its user-friendly UI coupled with powerful shell capabilities, making MongoDB database monitoring both simple and comprehensive.
NoSQL Manager strives to enhance the functionality of its performance monitoring tool, as it is one of the key parts of any database administration. It shows database metrics such as the number of client requests, read/write operations, network usage, memory usage and a number of page faults.

Who is it recommended for?
This tool is well-suited for users who need an intuitive interface with in-depth monitoring tools, and who might need to collect and export data to other platforms.
Pros:
- Simple yet intuitive interface
- Includes in-depth tools for manual and passive monitoring
- Can collect and export data to other platforms if needed
Cons:
- Can take some time to get comfortable with the layout of the tool
Website Link: https://www.mongodbmanager.com/
12. Knowi
Knowi offers a full-blown BI tool featuring stunning visualizations and dashboards to get insights about your unstructured data in MongoDB instances. You can embed the tool right into your application via JavaScript or iframe. The tool extracts real-time analytics with powerful dashboards and ad hoc reporting features, so you can understand your products better.
Key Features
- Built upon data virtualization so as to allow true native integration
- Native MongoDB analytics support nested objects and arrays. Connect the tool to MongoDB and start writing queries instantly.
- No predetermined schema, no ETL and no SQL mid-layers.
- Allows cross-database joins with Relational, NoSQL, RDBMS, and APIs on the fly across multiple CSPs or data centres
- Search-based analytics allows you to perform real-time ad hoc analysis
- Integrates machine learning into your MongoDB analysis workflows to get foresights and automatically trigger actions
Why do we recommend it?
Knowi is recommended for its exceptional data visualization capabilities and BI tools. It excels in delivering insights about unstructured data in MongoDB instances.
The best thing is that it does not require additional hardware or ETL.

Who is it recommended for?
Ideal for larger databases or enterprises that require extensive data visualization and the ability to integrate cross-database data. It's particularly suited for those focusing on business intelligence derived from MongoDB data.
Pros:
- Specializes in data visualization
- Can transform insights into businesses intelligence
- Great for larger databases or companies with large clusters
- Allows for cross-database data integrations
Cons:
- Better suited for enterprises
Website Link: https://www.knowi.com/mongodb-analytics
Conclusion
Gaining insights into the key metrics of your MongoDB instances is important so as to boost its availability, performance and plan for better load distribution. Using the best MongoDB monitoring tool will provide valuable insights and also help you with profiling analysis, visualizations and faster resolution of issues.
IT professionals will be able to monitor, analyze and identify abnormalities in the performance of MongoDB instances before they cause major failures.
MongoDB Monitoring Tools FAQs
What are some common MongoDB monitoring tools?
Common MongoDB monitoring tools include MongoDB Cloud Manager, Ops Manager, and Percona Monitoring and Management.
What are some common metrics that should be monitored in MongoDB?
Common metrics that should be monitored in MongoDB include CPU usage, memory usage, network I/O, disk I/O, and query performance.
How can organizations ensure that their MongoDB deployment is performing optimally?
Organizations can ensure that their MongoDB deployment is performing optimally by monitoring key metrics, optimizing query performance, and following best practices for scaling and configuring the database.
What are some common challenges associated with MongoDB monitoring?
Common challenges associated with MongoDB monitoring can include managing large volumes of data, ensuring compatibility with existing infrastructure, and troubleshooting performance issues.
How can organizations optimize the performance of their MongoDB deployment?
Organizations can optimize the performance of their MongoDB deployment by using indexing and query optimization, implementing caching and replication, and monitoring and tuning database parameters.


