
Monitoring servers and network infrastructure is important when it comes to keeping your business operations flowing, but what level of server monitoring is required if downtime is simply not an option?
Things are further complicated by the varied ecosystems that exist in the computer world, with Microsoft Windows, Linux and many other players all sharing in the market.
Process Monitoring and Operating System monitors are a good way to keep tabs on key servers and workstations, ensuring that if anything that is business critical, such as an application, file share or website, is kept online at all times. Processes are background applications in an Operating System that are required to be run at certain times, during certain operations, or in many cases, all the time.
Here is our list of the best process monitoring software and tools:
- Paessler PRTG – FREE TRIAL An all-in-one system monitoring package that covers networks, servers, and applications. The server supervision sensors include process monitoring capabilities. Installs on Windows Server. Start a 30-day free trial.
- ManageEngine Applications Manager – FREE TRIAL Monitor application and the processes they run with Applications Manager and link through to physical statuses on the supporting server. Installs on Windows Server and Linux. Start a 30-day free trial.
- Site24x7 Process Monitoring – FREE TRIAL A monitor for servers and services that can group together the supervision of servers on different sites. This is a cloud-based service. Start a 30-day free trial.
- Datadog A cloud-based monitoring tool that examines all of the services that support user-facing software, including server resources.
- Nagios A resource monitoring system that is available in a free version, called Nagios Core, and a paid version, called Nagios XI. Both versions include process monitoring and run on Linux.
- SolarWinds Server & Application Monitor A monitor that checks on physical properties of servers, monitors all running processes and traces the performance of applications active on the server. Installs on Windows Server.
- OpsView A system monitor that covers server statuses and application execution. Installs on Linux.
- Process Monitor (Microsoft) A free utility integrated into Microsoft Windows. Easy to use with a process-killing button.
Process Monitoring is the best way to keep tabs on everything, and if a service happens to fail, then corrective action can be taken quickly. Monitoring Critical OS Processes locally on a server is easy to do in most Operating Systems, but what if your company has hundreds or even thousands of servers that need to be monitored?
What if each of these units has hundreds of processes that need to be running? How would you cope with that kind of volume?
That is where our monitoring tools come into play, and today, we will be looking at 6 of the best examples for your network.
The Best Process Monitoring Software & Tools
Our methodology for selecting process monitoring tools and software
We reviewed various process monitoring software and analyzed the options based on the following criteria:
- Supported operating systems and environments
- Supported types of processes
- Ease of use
- A facility to analyze network performance over time
- Graphical interpretation of data, such as charts and graphs
- A free trial period, a demo, or a money-back guarantee for no-risk assessment
- A good price that reflects value for money when compared to the functions offered
1. Paessler PRTG – FREE TRIAL
Paessler PRTG is another multi-platform monitoring solution that can easily check the stats of Microsoft Windows servers, Linux Servers, and macOS. PRTG is built on SNMP and WMI so it can seamlessly pull stats from these operating systems.
Key Features:
- Multi-Platform Support: Seamlessly monitors Microsoft Windows, Linux, and macOS servers using SNMP and WMI for comprehensive insights.
- Agentless Monitoring: Eliminates the need for software installation on target servers, facilitating remote and unobtrusive monitoring.
- Comprehensive Alerts: Provides timely notifications to preempt and address potential server issues before they escalate.
Unique Feature
Highly flexible, as it is a sensor-based tool. This means you can add more monitoring capabilities by simply adding more sensors.
Why do we recommend it?
With this tool, we could monitor almost any device. The only requirement is that the device must have an IP address! Staying on top of our processes and data flow doesn't get easier than this.
PRTG is agentless, which means that you don’t have to install any instances of the software on your target servers, making your monitoring completely remote, without any interference to your servers necessary at all.
PRTG comes with alerts to let you know if things are not going well for your servers, and these alerts will be able to let you know before they become a much bigger problem for you and your users.
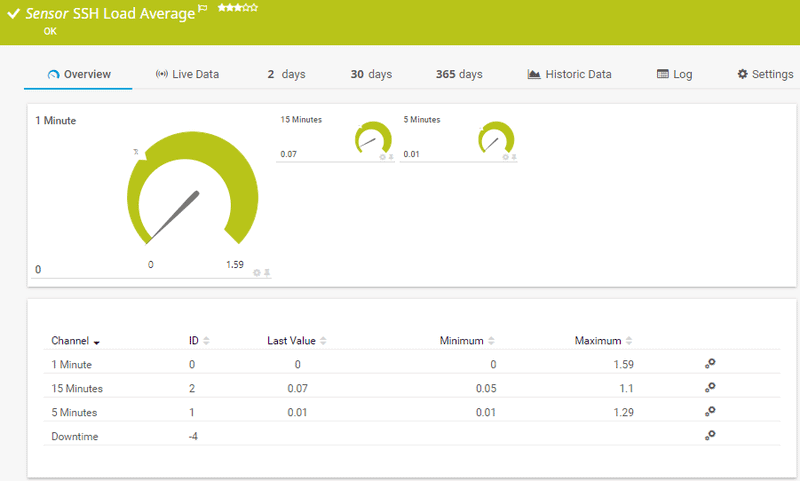
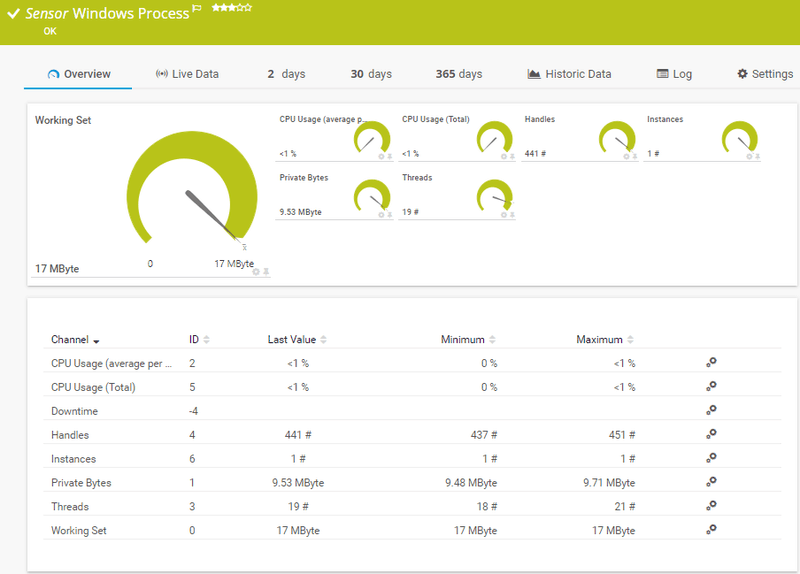
Windows servers are monitored by PRTG and the main stats that are visible are CPU usage, traffic, memory, hard drives and other vital stats. Monitoring is accomplished via the WMI framework, which gives direct hardware access to the monitoring software, providing accurate and real-time stats.
It also uses SNMP and performance counters to give you a complete overview of your server’s overall health and performance. Linux monitoring is accomplished by using the SNMP and SSH protocols, and popular supported Linux Distributions are Ubuntu, Debian, CentOS, RedHat and Suse.
There is support for other distros as well.
MacOS is monitored in a very similar way: through SSH and SNMP. MacOS is found primarily on workstations, but some businesses utilize the server derivatives of this OS as well.
PRTG is quick to configure, and the setup is really easy to breeze through upon installation. It has a built in auto-discovery that allows all of your servers to be identified on the network with minimal effort.
There are pre-defined device templates that are used as well, making the setup quicker still. There are different licensing models available depending on your requirements, which makes this solution very scalable.
Who is it recommended for?
Works best for Windows environments only.
Pros:
- Versatile Infrastructure Monitoring: Designed as an all-encompassing tool, supporting a variety of sensor types including NetFlow, sFlow, and J-Flow for diverse monitoring needs.
- Extensive Monitoring Capabilities: Enables additional monitoring on the same platform, covering infrastructure, network, and application performance comprehensively.
- Efficient Data Analysis: Captures only packet headers to expedite analysis and minimize storage requirements for long-term data collection.
- Intuitive Traffic Visualization: Utilizes straightforward graphing techniques for clear and understandable traffic analysis.
Cons:
- Complexity: Offers a rich array of features that require time to master, presenting a learning curve for maximizing the platform's full potential.
Paessler PRTG offers a free version with 100 sensors.
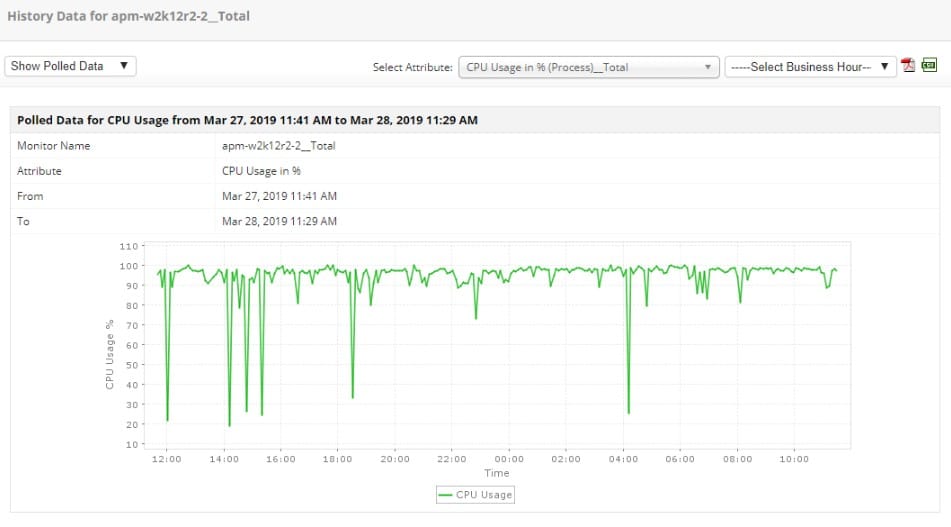
2. ManageEngine Applications Manager – FREE TRIAL
Applications are implemented as processes in the CPU of a server. So, when tracking the performance of processes, you need to look at them in the context of the applications that you need to run. Are you supplying enough services to your user community? Could you cope with more applications being requested? Is your server fit for purpose? These are big questions and to get a full answer to all of them you need more than one monitoring tool. Your starting point is the ManageEngine Applications Manager.
Key Features:
- Comprehensive Application Monitoring: Tracks the performance of applications and the underlying services that support them, including web applications and APIs.
- Global Server Monitoring: Capable of tracing application dependencies across multiple servers worldwide, creating an application dependency map for clear visibility.
- Alerting System: Implements an alert mechanism that notifies via email or SMS, allowing teams to focus on other tasks without missing critical issues.
Unique Feature
Sends alarms in case of issues. This helps with the quick resolution of problems before they impact the wider organization.
Why do we recommend it?
This tool can work well across different kinds of applications to provide comprehensive views of your organization's environment. It helps to diagnose and troubleshoot problems as well.
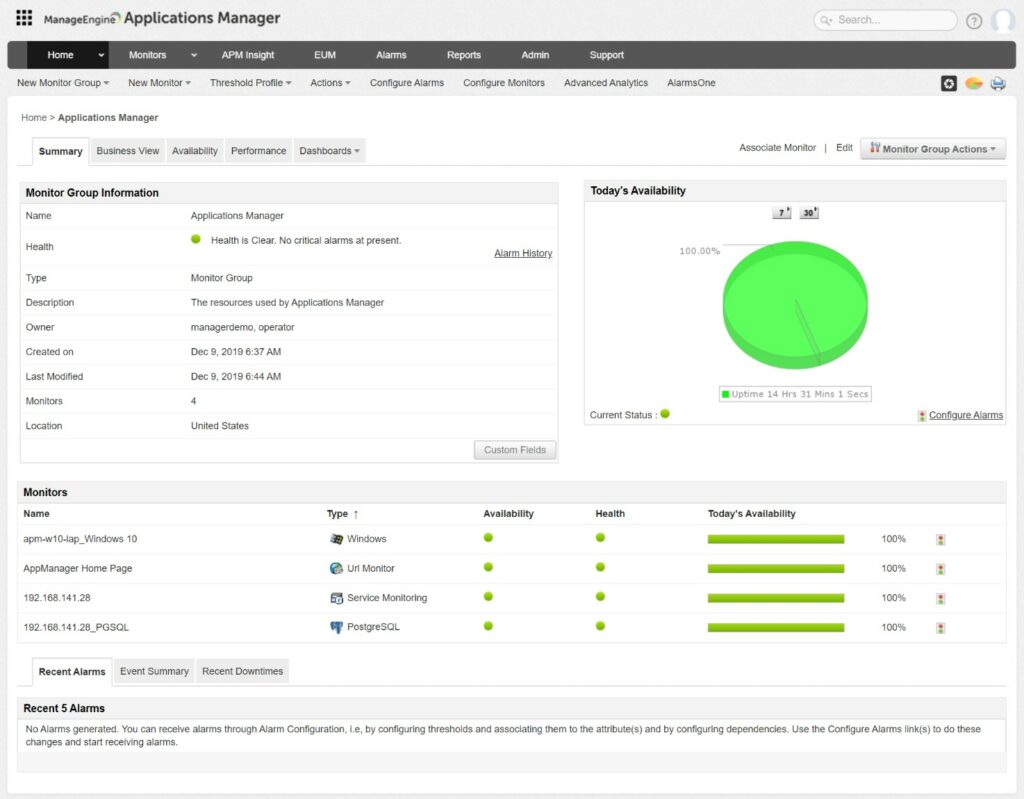
ManageEngine Applications Manager monitors all of the applications and services that lie behind the delivery of user-facing software. The system is even able to monitor websites and the web application services that make them run. It can track through APIs to the behind-the-scenes components of a web page that might be running on a server somewhere else in the world.
So, thanks to the complexities of modern IT, the successful delivery of software and applications to your users might depend on the successful performance of many servers scattered across the globe. Applications Manager can cope with that scenario. It traces all application dependencies, producing an application dependency map and showing the underlying services that make software run successfully. This is important when things go wrong. You need to know what element is letting the side down and which server is running it.
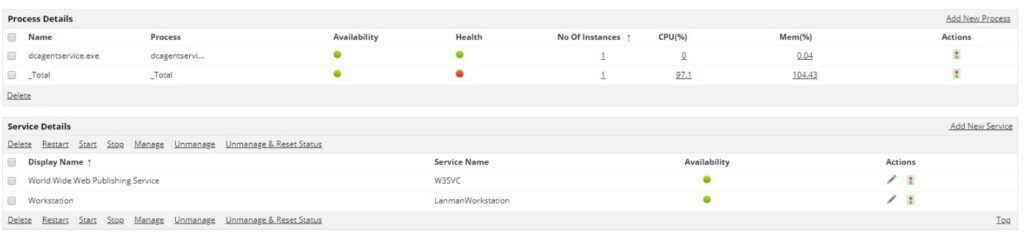
Applications Manager has a system of alerts. These identify problems and send out notifications by email or SMS. That means that your tram can get on with other tasks, knowing that no news is good news.
Who is it recommended for?
Ideal for enterprise, IT, and data center groups that want to monitor their processes through a single web console.
Pros:
- Enterprise-Scale Capabilities: Tailored for large networks, offering extensive monitoring and management features to handle complex IT environments.
- Real-Time Auto-Discovery: Automatically identifies new devices and services, updating network topology and inventory lists without manual intervention.
- Effective and User-Friendly Alerts: Balances the need for comprehensive monitoring with alerts designed for ease of use and effectiveness.
- Versatile Monitoring Options: Combines SNMP monitoring with packet analysis, providing a broad range of data collection methods.
- Customizable Dashboard: Features drag-and-drop widgets, enabling users to personalize the dashboard to meet their specific monitoring needs.
- Comprehensive Reporting: Includes a robust reporting system, equipped with pre-configured templates for compliance and performance analysis.
Cons:
- Complexity for Smaller Networks: The breadth of features and the tool's enterprise focus may be daunting for smaller networks or organizations with simpler IT infrastructures.
Applications Manager is available for Windows Server and Linux. ManageEngine offers a 30-day free trial.
3. Site24x7 Server Monitoring – FREE TRIAL
Site24x7 is a cloud-based system monitoring platform with modules that specialize in different types of infrastructure. The Site24x7 Infrastructure module monitors servers and the applications that support front-end software. The system is able to centralize the monitoring of multiple servers from many different sites, including virtual servers in the cloud.
Key Features:
- Comprehensive Infrastructure Monitoring: Offers extensive server monitoring capabilities, including support for both physical and virtual servers across various locations.
- Cloud-Based Platform: Utilizes a cloud-based architecture, enabling centralized monitoring and analysis without the need for on-premises hardware.
- Customizable Dashboard: Features a user-friendly dashboard with drag-and-drop widgets, allowing for personalized monitoring views.
Unique Feature
It compares the process arguments running in the user server with the ones configured in Site24X7 to help you better understand the variations and their reasons.
Why do we recommend it?
Using this tool, you can stay on top of all the processes and workflows in your organization. Also, you can quickly know the root cause of a problem by tracking the processes, and this can help with the quick resolution of issues.
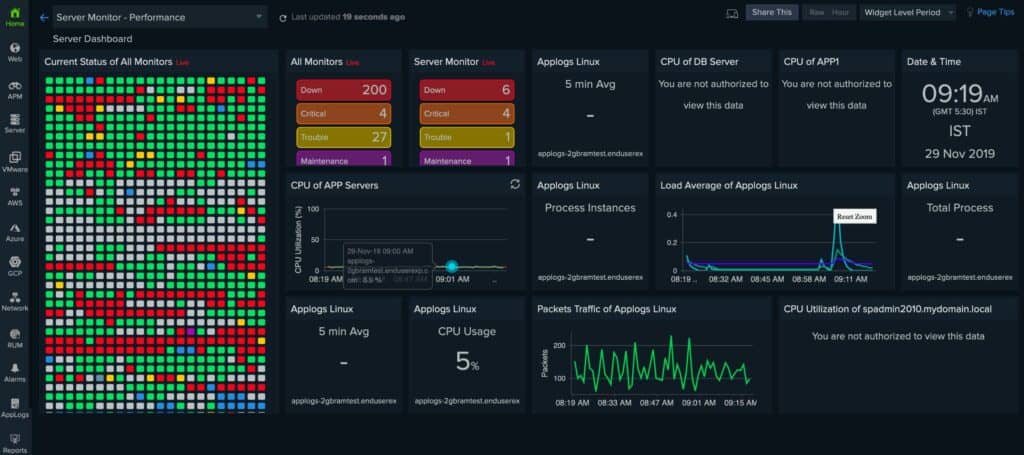
All of the processing for statistic display is resident on the Site24x7 servers and the console for the monitoring tool is hosted there, too. Technicians can access the dashboard from anywhere using any standard Web browser.
The dashboard is presented with standard screens for server monitoring. However, these can easily be adapted by the user, thanks to drag-and-drop widgets.
The Site 24×7 system requires agent programs to be installed on the servers that have been enrolled in the monitoring service. These agents are available for both Windows Server and Linux. The agent collects system data and then uploads it to the Site24x7 servers over secure connections for processing.
The agents look at system resource capacity and usage, including disk space, memory, and processors. Information on these factors is shown in tables of data and is also interpreted into graphs and charts.
The Site24x7 monitor places performance and capacity thresholds on all of the metrics that it covers. When performance dips below expectation or capacity approach exhaustion, the system generates an alert. These alerts can be forwarded to technicians by SMS or email as notifications.
Site24x7 Infrastructure is a subscription service and it can be expended by paid add-on services, such as network monitoring. The functions of the Infrastructure module, including server monitoring are also included in the Site24x7 All-in-one package. You can check out the services on Site24x7 Infrastructure on a 30-day free trial.
Who is it recommended for?
A good choice for organizations of all sizes, especially those with a distributed network model.
Pros:
- Holistic Monitoring Solution: Integrates network, infrastructure, and web performance monitoring into a single platform for a unified view of IT health.
- Real-Time Device Discovery: Automatically identifies and catalogs devices, generating up-to-date charts, network maps, and inventory reports.
- Intuitive User Experience: Ranked as one of the most user-friendly monitoring tools, facilitating ease of use for IT professionals of all skill levels.
- Bridges Technical and Business Insights: Enhances understanding of how technical performance impacts user behavior and business outcomes.
- Free Version Available: Provides a freeware option for initial testing, enabling businesses to evaluate the platform before committing to a subscription.
Cons:
- Complex Feature Set: The depth and breadth of functionalities require a significant time investment to fully leverage the platform's capabilities.
The base package for Site24x7 Infrastructure costs $9 per month when paid annually. You can get more information and access to a 30-day free trial.
4. Datadog
Datadog Infrastructure is one layer lower than an application performance monitor. While it does monitor applications, it focuses on those services that support other applications rather than the software that users actually access.
Key Features:
- Comprehensive Service Monitoring: Focuses on monitoring the services and processes that support front-end applications, offering insights from the system layer to the application layer.
- Cloud-Based Flexibility: Enables monitoring of servers and services across multiple locations, including cloud-based environments, through a centralized, cloud-based platform.
- Virtualization and Container Support: Offers specialized monitoring for virtual environments and containers, including hypervisor performance and VM allocation.
- Intelligent Alerting: Utilizes AI and machine learning to set performance thresholds, minimizing the risk of over-alerting while ensuring timely notifications.
Why do we recommend it?
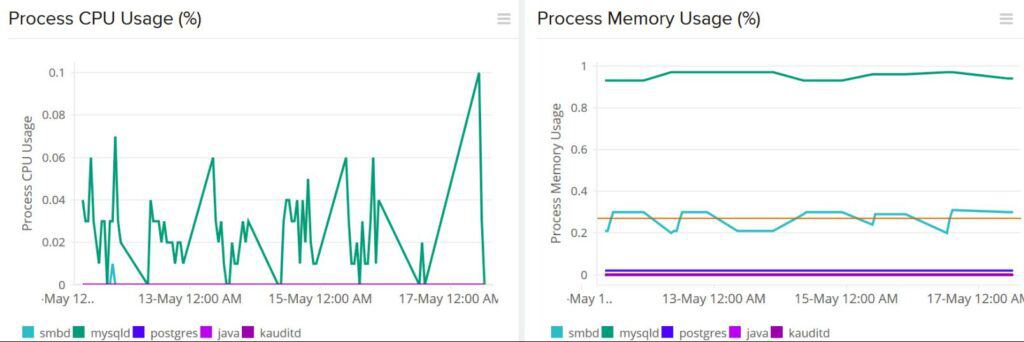
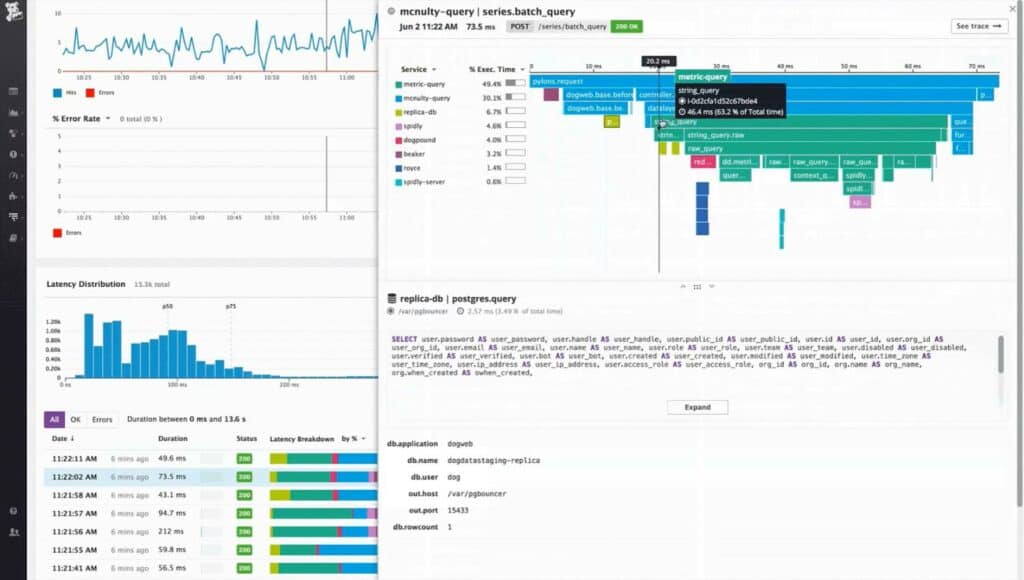
This tool collects the resource usage metrics for specific processes that run on all hosts. It also provides insights with two-second granularity.
The functionality of Datadog Infrastructure reaches from just beneath the front end down to the system resources of the server that runs all of that software. This includes the processes that run on the server and provide those services.
The Infrastructure monitor is a cloud-based service and so it does not have to be limited to monitoring servers and services resident on one site or one network. It can group together the monitoring of servers located anywhere, even in the cloud. The service instantly shows all of the servers in common ownership, their capacity, and their utilization. By this, the system administrator can see which servers are overstretched and which have spare capacity.
The monitoring system supports virtualizations and containers. The mix of hardware and software monitoring offered by Datadog Infrastructure is particularly useful for the monitoring of hypervisors and the allocation of VMs to servers.
In the monitoring of virtualizations, as with all of the other metrics that the service monitors, Datadog Infrastructure sets performance thresholds. These are set at levels that give technicians enough time to prevent developing problems from becoming disasters. The Datadog system uses AI-based machine learning to set these thresholds. By this method, the service avoids over-alerting.
The cloud-based Datadog service can be accessed from anywhere through any standard Web browser. The platform includes other modules that slot together. So, while Datadog Infrastructure can be used as a standalone monitoring system, administrators also benefit from combining it with other services, such as network monitoring or the Datadog APM.
Who is it recommended for?
Works best for organizations that have a wide range of applications.
Pros:
- User-Friendly Dashboards: Provides customizable dashboards that are easy to navigate, enhancing the monitoring experience.
- Seamless Monitoring: As a SaaS product, it eliminates the need for server deployments, reducing onboarding costs and complexity.
- Comprehensive Visibility: Offers the ability to monitor both internal and external network components, providing a complete view of network performance.
- Dynamic Auto-Discovery: Automatically identifies changes in the network, updating topology maps in real-time for up-to-date visibility.
- Scalable Monitoring Solutions: Supports business growth with flexible pricing options, adapting to varying monitoring needs.
Cons:
- Limited Trial Duration: The trial period may be too short for a thorough evaluation, limiting the ability to fully assess the platform's capabilities.
Datadog Infrastructure is available in three editions: Free, Pro, and Enterprise. The Free version is only able to monitor five hosts. That service only has a one-day data retention limit. The Pro edition has a 15-month data retention period and costs $15 per host per month. Those machine learning thresholds are included in the Enterprise edition, which costs $23 per host per month. You can access a 14-day free trial of Datadog Infrastructure.
5. Nagios
Nagios offers Operating System (OS) Monitoring via its application, and it is aimed at both server and workstation units that might need to be checked up on. System metrics such as service states, processes that are running, performance counters, event log monitoring and application monitoring for software such as IIS, Exchange, Apache, MySQL can all be catered for. These applications would be found on critical servers such as application, mail, and database servers. Active Directory, DHCP, and Sendmail is also supported, as are many other Operating Systems. These include Windows, Linux, Unix, Solaris, AIX, HP-UX, and macOS/X.
Key Features:
- Broad OS Compatibility: Monitors a wide range of operating systems including Windows, Linux, Unix, Solaris, AIX, HP-UX, and macOS/X, making it suitable for diverse IT environments.
- Comprehensive Monitoring: Provides detailed insights into service states, running processes, performance counters, and event log monitoring for critical servers and applications.
- Extensible Through Plugins: Supports hundreds of third-party add-ons via the Nagios plugin function, allowing for customized monitoring solutions tailored to specific needs.
Why do we recommend it?
This is one of the most comprehensive monitors in terms of operating system compatibility, so if your environment has a mix of Windows, Linux, Unix, and macOS/X then this would be a good option to consider.
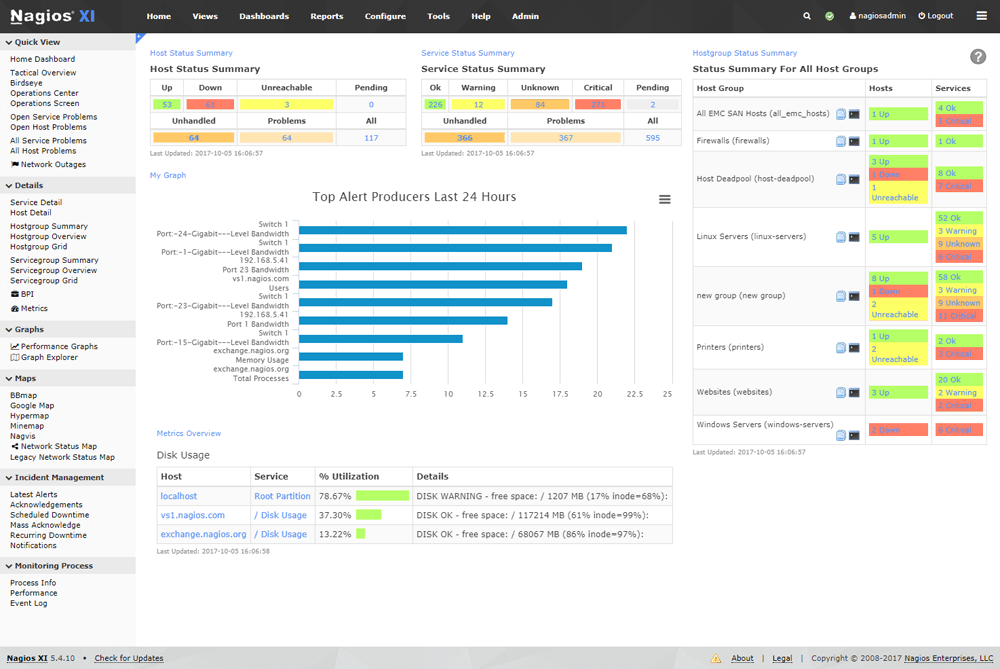
All of these features mean that Nagios offers a comprehensive IT infrastructure monitoring solution that is both multi-platform compatible and customizable. As a process and OS monitoring tool, it offers excellent vision via its monitoring dashboard, and from here things such as running applications, running processes, network activity, and more can all be viewed from a single interface.
There are hundreds of third-party add-ons that can be added via the Nagios plugin function, meaning that if you have specific monitoring requirements, chances are that somebody has already written a plugin that does exactly what you need.
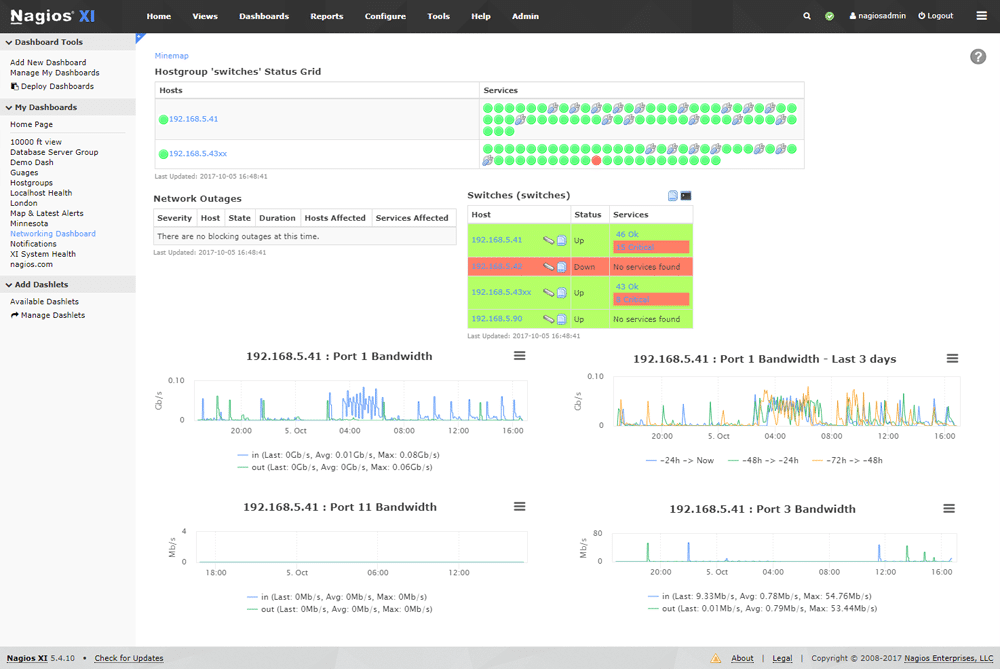
The Nagios Core 4 Monitoring engine gives users a massive advantage on the network, allowing them to analyse and investigate process and application level performance issues on the network, and will allow for advanced remote troubleshooting and increased up-time.
The application scales incredibly well, so whether you have a massive operation to contend with, or a small IT setup to contend with, you’ll always have the right monitoring applications for the job.
Who is it recommended for?
Ideal for environments using multiple platforms like Windows, Linux, and Unix.
Pros:
- Open-Source Flexibility: As an open-source tool, Nagios offers transparency and adaptability, with a community-driven approach to enhancements and troubleshooting.
- Unified Monitoring Dashboard: Features a simple yet informative interface that consolidates monitoring data for applications, processes, and network activity.
- Versatile Alerting Mechanisms: Includes flexible alerting options with support for SMS and email notifications, ensuring timely awareness of issues.
- Developer-Friendly API: Boasts a robust API backend, enabling developers to integrate custom applications or extend functionality as needed.
- Extended Trial Period: Offers a very generous two-month trial period, providing ample time for thorough evaluation and testing.
Cons:
- Support Limitations: The open-source version may not offer the same level of support as paid alternatives, potentially impacting issue resolution and guidance.
- Complex Setup: Installation and configuration can be technical and challenging, requiring a deeper level of IT expertise to effectively deploy and manage.
Nagios Standard Edition is available starting at $1,995. For more information and to download, visit nagios.com.
6. SolarWinds Server & Application Monitor (SAM)
SolarWinds offers a 30-day free trial of its Server & Application Monitor, aka SAM. This is an easy-to-use system that is normally setup in just a few minutes and allows for infrastructure monitoring for services such as Azure and AWS, as well as extensive network monitoring features.
Key Features:
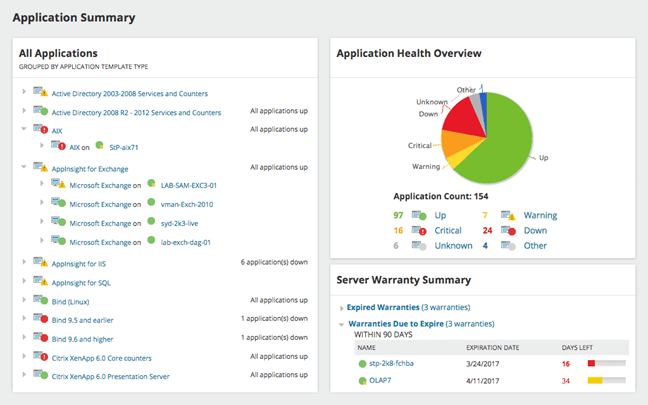
- Comprehensive Monitoring: Offers detailed insights into Windows and Linux servers, including specific applications like Active Directory, Java environments, and more.
- Extensive Template Library: Includes over 1200 monitoring templates, enabling users to quickly set up monitoring for a wide range of applications and services.
- AppStack Dashboard: Visualizes application dependencies and server performance, facilitating rapid problem identification and resolution.
- Virtualization and Storage Monitoring: Provides tools for monitoring virtual environments like Hyper-V and VMware, as well as server volume, disk usage, and capacity planning.
Unique Feature
It comes with 1,200+ monitoring templates plus 1,000 more from the community.
Why do we recommend it?
Using this tool to monitor our processes, services, devices, and even custom applications was super easy. Plus, its single web console offers complete visibility into every part of our network.
As well as all of the normal functionality that SAM brings to the table, there is also included monitoring templates that ship with the application out of the box. With over 1200 to choose from, you are bound to find a monitoring template to do whatever you need it to.
SAM allows users to delve into their Windows and Linux servers by drilling down into details such as Active Directory stats, Java Environment details, XenApp Stats, IBM WebSphere, Lync, Office 365 email, and more.
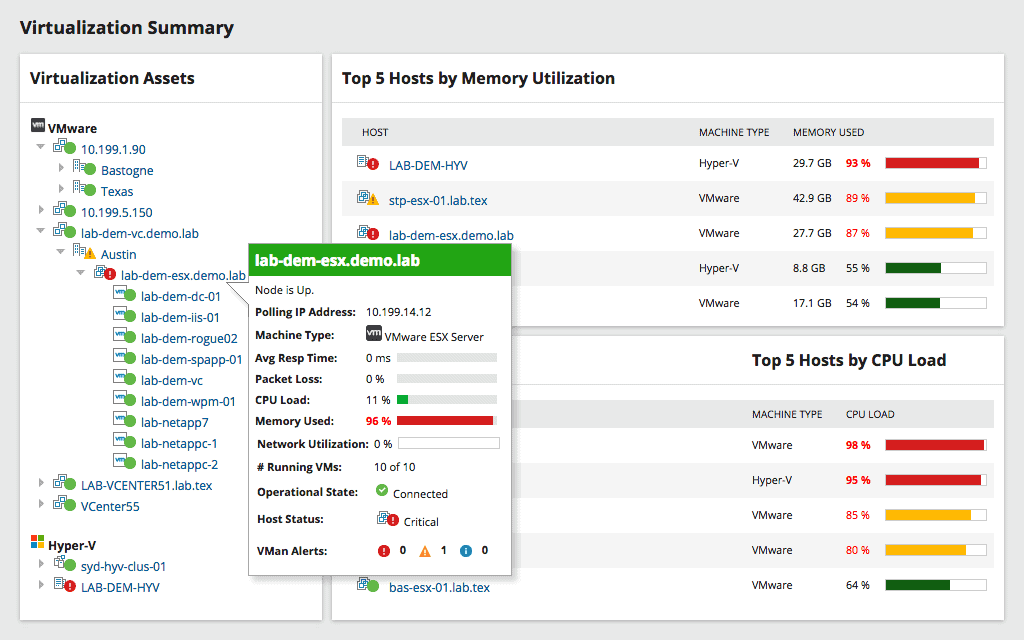
The Appstack dashboard allows users to quickly find an exact cause of an issue with an application on a physical or virtual server. By using this visual aid you can easily pinpoint problem issues. Virtualization monitoring is useful for Microsoft Hyper-V and VMWare ESX health stats, and performance monitoring can also be looked into if there are any issues.
The dashboard also integrates into SolarWinds Virtualization Monitor. If storage needs to be looked into, then the Server Volume Monitoring and Capacity Planning aspects of the page can also be used. This lets you monitor the server’s storage volumes, disk usage, and capacity details, all in
Other useful features include:
- Customizable Monitoring
- Centralized Asset Management
- Application Monitoring
- Linux and Microsoft Windows Compatible
- Application Dependencies
- PerfStack Dashboard
- Optional High Availability
- Enterprise Command Center
If you need individualized server monitoring statistics, then SolarWinds Server & Application Monitor is a great option. There is a lot of information at your disposal if you value customizability and fine-tuning your server’s monitoring.
Its ease of use, custom monitors, and application models all come together to provide users with a comprehensive and easy to setup server monitor. Its multi-platform support for Microsoft Windows and Linux means that you can monitor all of your servers, from this single product.
Who is it recommended for?
Recommended for network engineers of all-sized organizations who want comprehensive control and visibility over their processes.
Pros:
- Versatile and Powerful: Tailored for large and enterprise networks, offering a depth of monitoring capabilities for web assets through REST API, SNMP, and WMI.
- Detailed Root Cause Analysis: Employs dependency mapping to provide clear insights into underlying issues affecting performance.
- Flexible Monitoring Options: Combines SNMP monitoring and packet analysis, offering comprehensive control over network and application monitoring.
- Customizable Interface: Allows personalization of the dashboard with drag-and-drop widgets, enhancing user experience and data visualization.
- Robust Reporting: Features a strong reporting framework, including pre-configured templates for compliance and performance analysis.
Cons:
- Optimized for Larger Organizations: The complexity and scale of features make SAM most suitable for businesses with extensive IT assets and monitoring needs.
SolarWinds Server & Application Monitor is available for a 30-day free trial.
7. OpsView
OpsView seeks to consolidate all of the informational metrics that are gathered from your servers on the network, and then have it all collated into a single, legible source of data. This is especially useful if you need to standardize your reports so that all data is presented in the same way, measuring the same metrics.
Key Features:
- Unified Monitoring: Aggregates data from multiple servers across various operating systems into a centralized dashboard for streamlined reporting and analysis.
- Broad OS Support: Compatible with a wide range of operating systems including Windows, Linux, AIX, and other Linux distributions, ensuring comprehensive coverage.
- Extensible via API: Features a robust API, allowing for seamless integration with other network or intranet systems for enhanced functionality.
Why do we recommend it?
It provides agentless monitoring for all the metrics and processes needed to efficiently run the Microsoft AD Service. It can also help ensure that the IT environment is performing as expected.
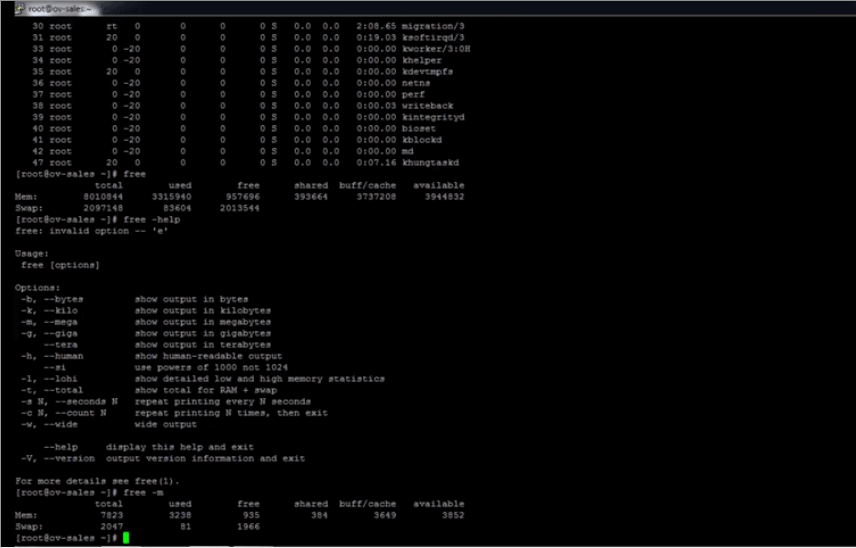
OpsView understands that not all operating systems were designed with high level monitoring of system metrics, which has traditionally meant that uses needed to dig for data when they needed it. OpsView offers support for Windwos, Linux, AIX, and other Linux distributions as well.
OpsView has its own API, so if your organization wishes to integrate some of its features into your network or intranet, then you are able to.
There are several different interface to choose from, depending on what needs to be checked on the target system that you are monitoring. Guest OSes can be checked remotely, and services such as process management and viewing, application management are all available to be viewed from within the application’s options.
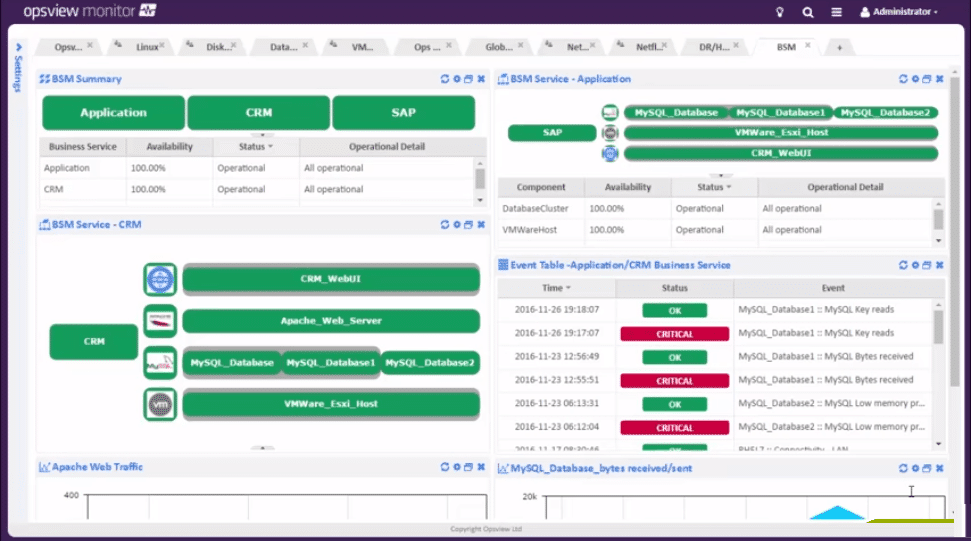
OpsView seeks to simplify your reporting requirements by consolidating all information into a single view of all of your operating systems in one place. This means that you can use this single solution to monitor across all of your different servers and keep tabs in system processes, user activity, CPU load and memory usage, current applications that are running, software updates to your applications, and a lot more. The views are customizable and are designed to integrate into your existing solutions via their well-documented API.
Who is it recommended for?
A good choice for large enterprises that have extensive domains and forests.
Pros:
- Comprehensive System Monitoring: Designed to monitor an extensive array of system metrics, including process management, application monitoring, CPU load, memory usage, and more, making it a versatile tool for IT administrators.
- Customizable Views: Offers adjustable interfaces to cater to specific monitoring needs, enhancing user experience and data relevance.
- Simplified Reporting: Aims to facilitate easier reporting by standardizing data presentation across different platforms, saving time and reducing complexity.
- Plugin Support: Provides flexibility and expandability through the use of plugins, enabling tailored monitoring solutions to meet unique requirements.
- Free and Paid Versions: Accommodates a range of budget constraints and feature needs with both free and premium offerings.
Cons:
- Dependency on Plugins: Reliance on plugins for extended functionality may not suit organizations seeking an all-in-one monitoring solution, potentially complicating setup and maintenance.
Opsview offers its OS monitoring software starting at $2 per host, accommodating up to a maximum of 300 hosts. For more details and to download, visit their website.
8. Microsoft Process Monitor
Process monitor is a free tool that is made available to Microsoft Windows users, and is a basic process management application. Users are able to monitor and filter information about their servers such as real-time file system activity, Registry, and process and thread operations on specific servers.
Key Features:
- Real-Time Monitoring: Offers live tracking of file system, Registry, and process/thread activity on Windows servers.
- Legacy Integration: Combines features from regmon and filemon, enhancing its functionality with a unified approach.
- Advanced Data Filtering: Allows for detailed analysis with filters on session IDs, usernames, and more, making data management more efficient.
Why do we recommend it?
This is a simple yet powerful tool that ensures the constant availability, consistency, and optimal performance of your IT infrastructure.
It does this by combining 2 legacy products, namely regmon and filemon. It also adds extra enhancements to the application by including advanced filtering and searchable data such as session IDs and usernames, and more. Granted, these are fairly simple capabilities when compared to some of the commercial options that we have looked at so far, but as a free tool this can be quite useful.
The process monitor is able to be used in real-time, but it also keeps vast stores of information in log files. This data can be stored and checked over time to establish any trends in system downtime, or any other issues that are detectable via the software.
There are not many other features to speak of, but as a free tool from Microsoft, it performs very well, and its installation size tiny when compared to the other applications in this round up.
Those looking for more advanced monitoring tools with options would do better with one of the paid for options in our list, but as a basic diagnostic tool that you would use to check up on a few key servers, the Microsoft Process Monitor does an adequate job.
Who is it recommended for?
Ideal for IT admins who want to monitor the critical processes in their Windows environment.
Pros:
- Cost-Effective Solution: A free tool provided by Microsoft, offering essential process management capabilities without any financial investment.
- Seamless Windows Integration: Designed specifically for the Windows environment, ensuring compatibility and optimized performance.
- User-Friendly Interface: Easy to navigate and well-documented, facilitating quick adoption even by users with limited technical expertise.
- Process Management: Enables the immediate termination of processes directly from the interface, streamlining system administration tasks.
Cons:
- Limited Platform Support: Exclusively available for Windows, restricting its utility in mixed or non-Windows environments.
- Basic Functionality: While effective for fundamental diagnostic purposes, it lacks the breadth of features found in more comprehensive, paid monitoring solutions.
Microsoft Process Monitor is available for free; you can download it from the official Microsoft documentation page.
Conclusion
We have looked at 6 of the Best Process Monitoring solutions around, and each one has its own unique approach to the problem. This is great news for consumers as it gives us more choice when trying to decide on which product would work best in our particular environments.
What’s even better is that the products tend to scale up very well, so that if your business grows, then you can purchase additional sensors and licences for your monitoring application.
Being able to identify a bloated process on your server gives you the upper hand in the battle against server up time, and a quick service restart can often be the difference between a happy user, and a Blue Screen of Death on one of your vital servers.
Why not try out one of the top 3 selections from our list and see which one works best in your environment? Each has its own specific features that differentiate each one from one another, so take a look at which ones could work best for you and then try out the evaluation version. You might find your dream monitoring software that will help you to keep your IT systems afloat even during.
Our Top Picks are Paessler PRTG, ManageEngine Applications Manager, and Site24x7 Process Monitoring
Process Operating System Monitoring Tools FAQs
What types of processes can be monitored with process monitoring software?
Process monitoring software can be used to monitor a wide range of processes, including system processes, user processes, service processes, and application processes, among others.
What types of information can be obtained with process monitoring software?
Process monitoring software can provide information on process CPU usage, memory usage, disk usage, network usage, and other performance metrics. It can also monitor process uptime, start time, and end time, as well as other process-related events.
What are some popular process monitoring software solutions?
Some popular process monitoring software solutions include Process Explorer, Process Hacker, and Sysinternals Process Monitor for Windows, and htop, top, and ps for Linux.
What are some common use cases for process monitoring software?
Common use cases for process monitoring software include troubleshooting system and application issues, identifying performance bottlenecks, tracking resource usage, and managing process behavior.
What types of notifications can be set up with process monitoring software?
Process monitoring software can send notifications for a variety of events, such as when a process is started or stopped, when a process exceeds a certain CPU or memory usage threshold, or when a process triggers a certain event.
What types of integrations and plugins are available for process monitoring software?
Process monitoring software can have a range of integrations and plugins that can extend its functionality, including plugins for monitoring specific applications and devices, as well as integrations with other tools and platforms.
What are some key features to look for in process monitoring software?
Some key features to look for in process monitoring software include customizable notifications, real-time process monitoring, integration with other monitoring tools, and the ability to monitor multiple devices or systems.


