
The non-relational database has become relatively very popular today. It has become an essential tool for the enterprise world. Riak is that one database that has always been a fundamental part of the NoSQL database environment.
This article will provide you with detailed information on Riak database monitoring and a list of the best tools you can implement in your organization.
Here is our list of the best Riak Database monitoring tools:
- Site24x7 – EDITOR'S CHOICE Makes it easier to monitor critical metrics including total allocated memory, the number of active GET/PUT FSMs, and more. Start a 30-day free trial.
- ManageEngine Applications Manager – FREE TRIAL Gain deeper insights into database performance. Also, enables tracking key metrics and identifying bottlenecks in real-time. Download a 30-day free trial.
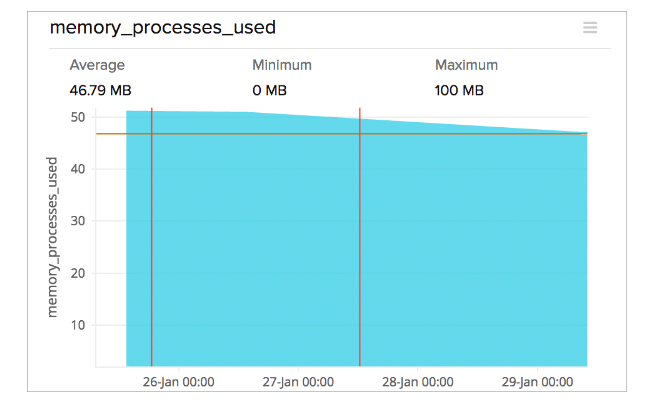
- AppPerfect A Riak database monitoring tool that does not require any agent installed on the monitored devices.
- Zabbix An open-source monitoring tool that provides information on the state of Riak cluster nodes.
- Riak Control Provides a web-based administrative interface for inspecting and manipulating Riak clusters.
- Nagios A monitoring and alerting solution that provides the stat of the Riak cluster nodes.
- Splunk Used to aggregate all Riak cluster node operational log files, including the operating system and Riak-specific logs and Riak statistics data.
- New Relic is a data visualization tool that analyzes and provides information on Riak nodes’ current and past states.
- Riemann is a tool that uses stream processing language to collect events from client agents running on Riak nodes.
What is Riak?
Riak was founded in 2008 as the first distributed system that has the ability to simplify the crucial challenges concerning data management of your enterprises. They are basically of two types, namely Riak KV and Riak TS. Although they share a similar Riak core, they are different in terms of use cases.
Riak KV is highly in demand, is scalable, and operates the NoSQL database effortlessly. However, it is different because it automatically distributes data across the group to ensure fast performance and fault tolerance, and it deals with Key-Value use cases.
On the contrary, Riak TS is used for optimizing time series and IoT data. It enables you to read and write faster so that you can store, query, and analyze time and location data easily. In a nutshell, it is used as a foundation to reduce the complexity of integrating and deploying active workloads for BigData, IoT, hybrid cloud applications.
The database is written in Erlang and even comprises fault-tolerant data replication and automatic distribution across the group for performance and resilience.
Why do we need Riak Database Monitoring?
You need Riak Database Monitoring due to its unique features:
- Availability of Fault-Tolerant Riak encompasses duplicate key or value stores situated across the group of nodes with a default n-Val. When you face node outages caused due to network partition or hardware failures, you can still write data to a neighboring node after the first three and read back. It is only possible because of its masterless peer-to-peer architecture.
- Queries Riak delivers a RESTful-API via HTTP or Protocol Buffers for usual put, get, post, and delete functions. It also makes other more complex queries possible that include Secondary Indexes, Search, and MapReduce.
- Predictable Latency Riak database monitoring enables you to distribute data across nodes and hashing and provides a latency profile. It is possible even when you are facing multiple failures.
- Storage Options It stores the keys or values in the form of memory, disk, or sometimes both.
- Replicates Multi-Datacenter The Multi-Datacenter Replication acts as a “primary cluster” that can handle replication requests from more than one “secondary cluster.” When the data center of the primary cluster goes down, it is taken over by the secondary cluster.
- Tunable Consistency It has tunable consistency that allows it to select consistency from eventual to sturdy ones for every bucket.
Use Cases Of Riak
Riak offers significant and straightforward use cases that we have discussed below:
- Session Storage Riak was designed as scalable session storage. However, it has begun serving the most complex session storages with its evolution. It comes with the most advanced features like Bitcask, MapReduce, and many more.
- Ads Although Riak is one of the best databases for multiple use cases, it is considered crucial while serving advertisement content. Furthermore, since it is a portable database, it tends to serve content to different web and mobile users simultaneously having low latency.
- Log Data Information related to events occurring in an OS or other software or messages between users using communication software. Riak stores a hefty amount of log data using MapReduce.
- Sensor Data The device’s output that identifies and responds to some input located in the physical environment. There are a lot of devices that collect and send data at a given interval which might be arduous to handle. Riak helps in managing these types of data.
- User Account Data It is relatively difficult to handle user accounts. That is why companies look for intuitive yet straightforward ways to store the data. They opt for Riak as it enables every Riak account to be stored as a JSON object in the bucket.
Our methodology for selecting the Best Riak Database Monitoring Tool:
We've broken down our analysis for you based on these key criteria:
- Ability to monitor critical metrics like memory allocation and FSM activity.
- Support for tracking unusual and advanced metrics specific to Riak databases.
- Effectiveness in tuning and optimizing the Erlang Virtual Machine for Riak.
- Capabilities for providing insights into general node health and performance.
- Efficiency in managing and reporting on Riak database partitions and nodes.
The Best Riak Database Monitoring Tools
The best Riak Database Monitoring tools you can use in your enterprise are:
1. Site24x7 – FREE TRIAL
Site24x7 offers Riak Monitoring Tool that makes the critical metrics like total allocated memory, numerous active GET/PUT FSMs, and more effortlessly.
Key Features:
- Monitors Riak critical metrics
- Supports various unusual metrics
- Runs on Erlang virtual machine
- Virtual Nodes and GET FSM sibling stats
Why do we recommend it?
Site24x7 is recommended for its comprehensive monitoring capabilities, especially for Riak's critical metrics, which are essential for optimal performance and health assessment.
In addition, it supports various unusual metrics that are as follows:
- It provides numerous Protocol Buffer Connections and active PBCs, respectively.
- It provides you with data related to the total amount of current memory and even stores atoms.
- It stores values on a disk in binary and provides the number of memories stored in binary via memory binary.
- It runs on an Erlang virtual machine, making the stats allocated for erlang code, Erlang Term Storage, and Erlang processes critical to tune Erlang VM and optimizes Riak performance appropriately.
- It comprises FSM time stats representing the amount of time required to negotiate the PUT Finite State Machine code, thereby delivering a picture of general node health.
- It has Virtual Nodes that manage partitions in the Riak ring via multiple vnodes.
- It has a GET FSM sibling that provides stats concerning the number of siblings encountered by this node during GET requests.

Who is it recommended for?
Ideal for businesses requiring detailed and specific monitoring of Riak databases, especially those relying heavily on Erlang VM performance.
Pros:
- Detailed metrics for Riak monitoring
- Supports unique metrics beyond standard ones
- Optimizes Riak performance via Erlang VM
- Provides insights into node health and memory usage
Cons:
- Might be complex for beginners
EDITOR'S CHOICE
Site24x7 is our top pick for a Riak Database Monitoring Tool because it excels in providing comprehensive monitoring of vital Riak metrics. It offers unique features like tracking Protocol Buffer Connections and active PBCs, and detailed memory utilization stats, including memory binary.
The tool's proficiency in running on an Erlang virtual machine ensures critical metrics for Erlang code, Erlang Term Storage, and Erlang processes are well-monitored, essential for tuning Erlang VM to optimize Riak performance. Its inclusion of FSM time stats and GET FSM sibling stats offers valuable insights into node health and request handling efficiency. This cloud-based tool is a must-have for businesses looking to enhance their Riak database monitoring and performance.
Download: Get Site24x6 Free Trial
2. ManageEngine Applications Manager – FREE TRIAL

With ManageEngine Applications Manager's Database monitoring tool, businesses can keep track of their critical database performance metrics at all times. The tool offers multi-vendor support, which means you even have the option to monitor a wide range of databases running on different environments, i.e., on premises, virtualized, or cloud, from a single dashboard, eliminating the stress of switching between multiple platforms. Get hold of your key metrics and resolve issues causing slowdowns or failure in real-time.
Comprehensive reports can further help check on the database performance trends and utilization statistics. No need to stress over the data, as these reports are customizable and can represent complex data in simple formats. Further, machine learning algorithms can be a great help in predicting database trends and utilization.
Key Features:
- Extensive and comprehensive reports
- Track DB metrics and monitor availability in real-time
- Auto-discover database instances
- Automate anomaly alert systems
Why do we recommend it?
Application Manager's Database Monitoring is recommended for its ability to autodiscover database instances, monitor key metrics, and identify issues in real-time. Another point that makes it a good choice for businesses is that you can track multiple databases from a single dashboard.

Who is it recommended for?
Organizations or database administrators looking for a robust tool that comes with the ability to monitor as well as manage complex Riak databases must try this tool.
Pros:
- Allows monitoring multiple databases from a single console
- Pinpoints the root cause of issues and resolves them fast
- Offers access to detailed reports that are used for capacity planning
- Generates in-depth insights into key performance indicators
Cons:
- The tool comes with multiple features that may take a while for users to explore and understand functionalities.
Start by downloading the 30-day free trial.
3. AppPerfect
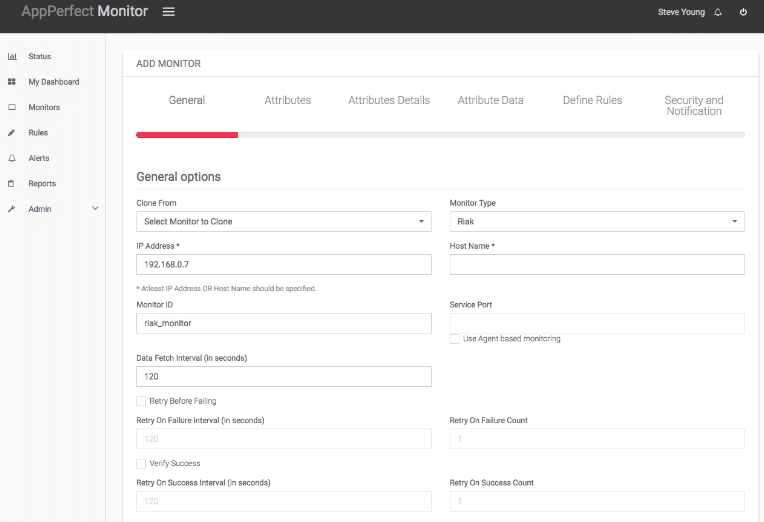
AppPerfect’s Riak Monitoring tool is a distributed key value-based NoSQL database. It supports enormous data storage and management with increased flexibility, availability, scalability, and fault tolerance. The performance of the database defines the success of your organization.
It enables you to provide customer satisfaction 24×7 and smooth operation of daily business activities. You can monitor the performance of the database and provide extensive information to take necessary steps before the occurrence of vital business processes.
Key Features:
- Distributed NoSQL database monitoring
- Enhances flexibility and fault tolerance
- Monitors database performance
- Provides extensive information for action
Why do we recommend it?
AppPerfect is recommended for its ability to ensure customer satisfaction and smooth operation of business activities through effective database performance monitoring.
Who is it recommended for?
Best suited for organizations looking to monitor and manage large-scale NoSQL databases like Riak, ensuring high availability and customer satisfaction.
Pros:
- Efficient management of enormous data storage
- Increased database flexibility and availability
- Real-time performance monitoring
- Preventive measures for business process continuity
Cons:
- May require technical expertise
Website Link: http://www.appperfect.com/support/tutorials/monitoring/nosql-monitoring/riak-database-monitoring.php
4. Zabbix
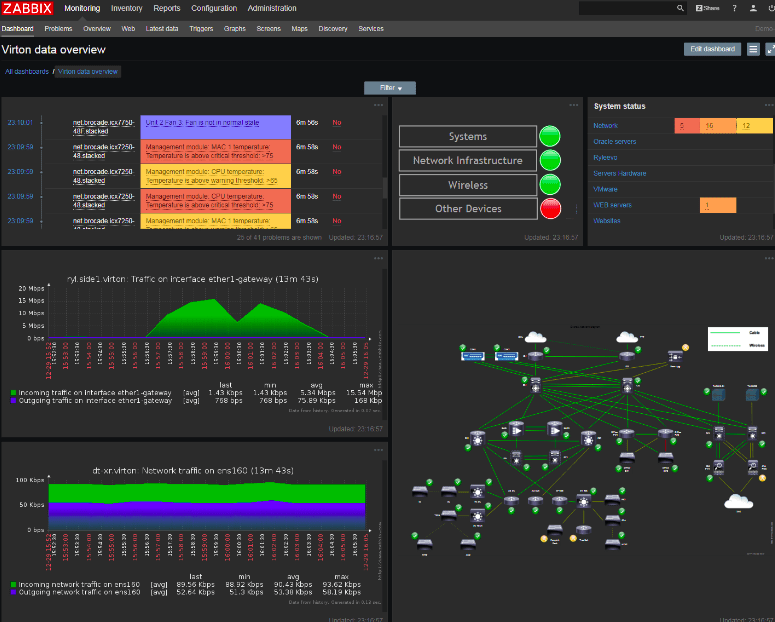
Zabbix Riak Database Monitoring tools provide high availability, fault tolerance, operational simplicity, and scalability to the organization. Apart from the open-source version, it also comes in supported enterprise and cloud-storage versions.
Key Features:
- High availability and fault tolerance
- Scalable and operationally simple
- Collects metrics from various sources
- Correlates problems for root cause analysis
Why do we recommend it?
Zabbix is an excellent choice for organizations needing a reliable and scalable solution for monitoring Riak databases, offering high availability and fault tolerance.
In addition, it provides the following features:
- It collects metrics from any source.
- It eliminates the task of tracking metrics manually. Instead, it automatically detects problem states within the incoming metric flow.
- It uses multiple news channels to keep you informed of the different types of events that are taking place in your area.
- It displays the collected data in several ways.
- You can acquire a visual overview of your IT environment in many ways.
- It helps you correlate existing and incoming problems and perform root cause analysis.
Who is it recommended for?
Ideal for businesses seeking an open-source solution for extensive Riak database monitoring, particularly those prioritizing scalability and operational simplicity.
Pros:
- Automates tracking of critical metrics
- Versatile data display options
- Simplifies IT environment monitoring
- Supports enterprise and cloud-storage versions
Cons:
- May be overwhelming for smaller setups
Website Link: https://www.zabbix.com/integrations/riak
5. Riak Control
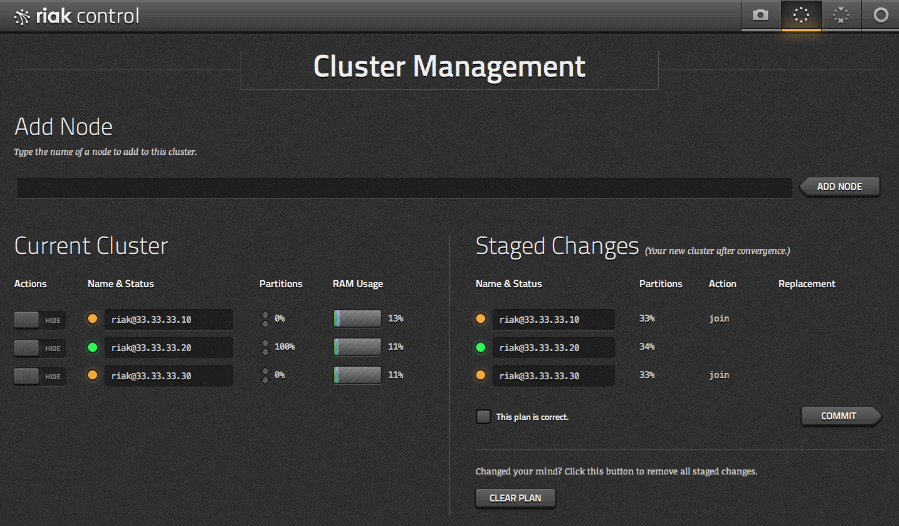
Riak Control, a web-based administrative console, inspects and manipulates Riak clusters. Though it is maintained as a separate application, Control ships have the necessary codes and do not require additional installation steps
Key Features:
- Web-based Riak cluster management
- Manages clusters effectively
- Standalone node management interface
- Simplifies cluster node additions/removals
Why do we recommend it?
Riak Control is recommended for its user-friendly, web-based interface that simplifies the management of Riak clusters, making it accessible and efficient.
Riak Control also:
- Helps you to manage clusters with the help of staging. The new Riak interface stages the cluster node additions and removals.
- Has a standalone node management interface that collects the unstaged actions.
- Prevents users from understanding every detail of its existing functionality to contribute.
Who is it recommended for?
Best for administrators and IT professionals who need a straightforward and efficient tool for managing and manipulating Riak clusters.
Pros:
- Easy-to-use administrative console
- Efficient staging for cluster changes
- Unstaged actions collection
- Reduces complexity in cluster management
Cons:
- Limited to cluster management tasks
Website Link: https://riak.com/riak-1-4-riak-control/
6. Nagios
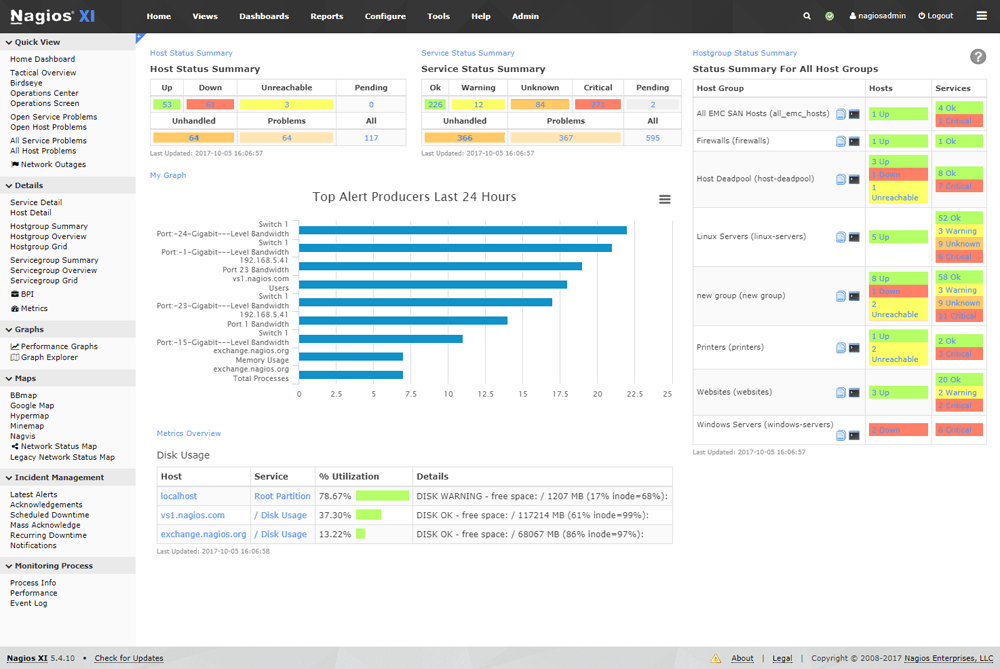
Nagios provides scalability and flexibility to an organization’s business processes. One of the most powerful monitoring tools makes server monitoring easy with agentless and agent-based monitoring capability. It comes with over 5000+ add ons to monitor your servers.
Key Features:
- Scalable server monitoring
- Agentless and agent-based monitoring
- Over 5000+ monitoring add-ons
- Monitors critical infrastructure components
Why do we recommend it?
Nagios is renowned for its scalability and flexibility, offering comprehensive monitoring capabilities that ensure the smooth functioning of business processes.
In addition, it offers the following features:
- It monitors all critical infrastructure components, including applications, services, operating systems, network protocol, system statistics, etc.
- It simplifies the log data search process by setting up alerts. These alerts notify you whenever it detects a threat or simply query the log data to audit any system instantly.
- It offers a highly visible and scalable network, thereby solving the problem of multiple networks or geographical separation.

Who is it recommended for?
Ideal for organizations needing a robust monitoring solution for servers and critical infrastructure, particularly those requiring extensive customization.
Pros:
- Extensive infrastructure monitoring
- Simplified log data search and alerts
- Highly visible and scalable network
- Suits multiple networks or geographical locations
Cons:
- Setup complexity for beginners
Website Link: https://github.com/basho-labs/riak_nagios
7. Splunk
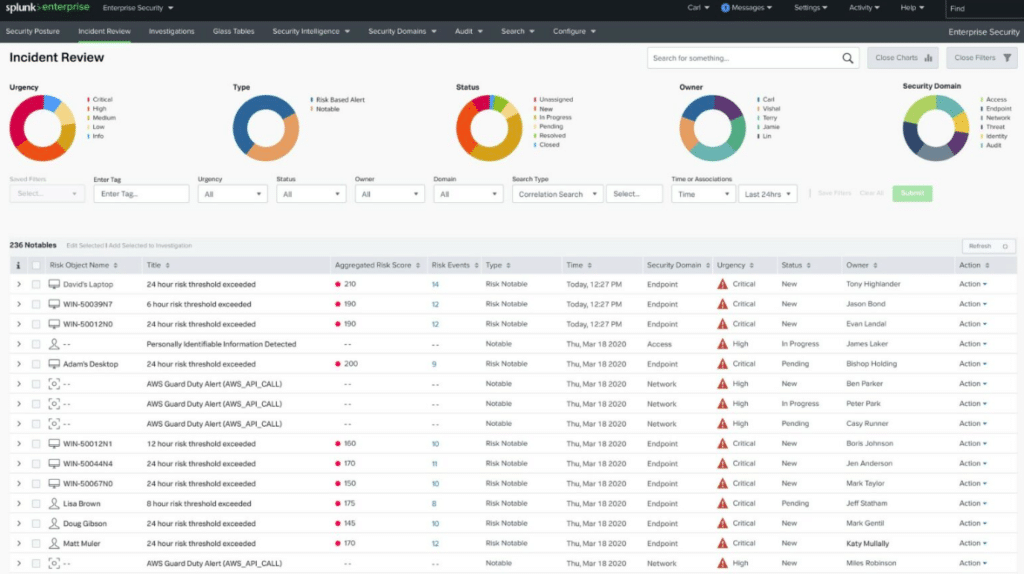
Splunk provides data concerning the current operating status. It includes statistics in the form of histograms and counters. These statistics are available via HTTP API or riak-admin interface. It draws system statistics for a Riak node and helps you identify early warnings of potential problems.
It also graphs the throughput metrics that are relevant to the use case. It helps in analyzing planning and usage trends. You can also create an expected baseline to monitor unexpected increases or decreases in productivity.
Key Features:
- Real-time operating status data
- Statistics via HTTP API or riak-admin
- Graphs throughput metrics
- Analyzes planning and usage trends
Why do we recommend it?
Splunk stands out for its ability to provide in-depth insights into Riak's operating status, making it invaluable for early warning detection and productivity monitoring.
In addition, Splunk offers tools to visualize machine-generated data such as log files. It also helps to reduce the downtime by 82% with the Splunk AIOps platform.

Who is it recommended for?
Splunk is particularly recommended for IT teams that need to analyze and visualize machine-generated data, like those in large-scale or complex IT environments.
Pros:
- Advanced data visualization tools
- Helps reduce downtime significantly
- Offers insights into machine-generated data
- Facilitates proactive monitoring and planning
Cons:
- Can be complex for non-technical users
Website Link: https://www.splunk.com/en_us/app-integrations.html
8. New Relic
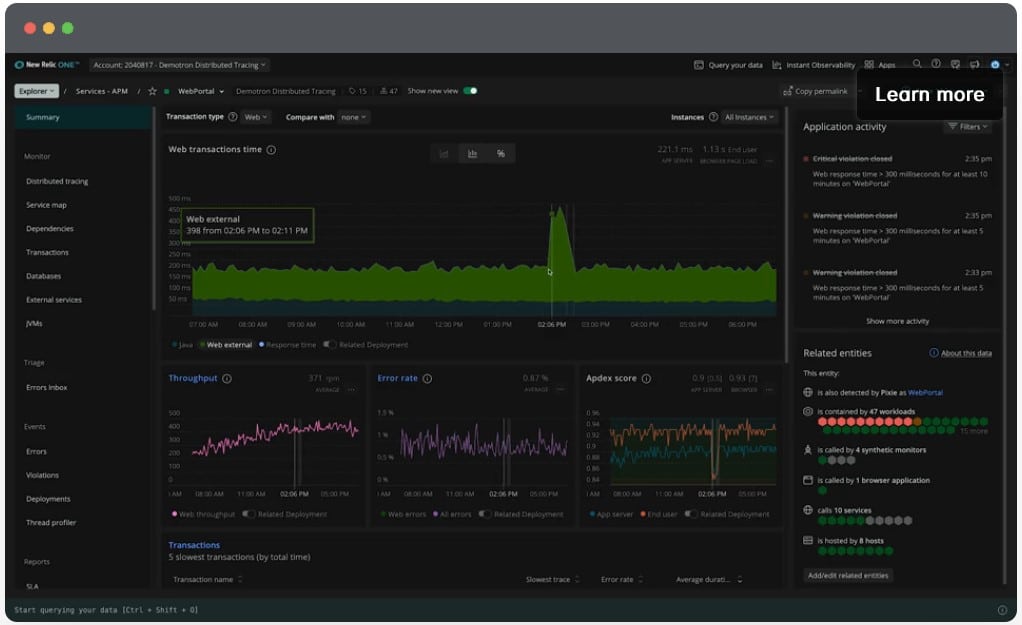
With the help of the New Relic Riak Database Monitoring tool, you can monitor, debug, and improve your entire stack. Its Dev and Ops team solves the data-related problem effortlessly. It enables you to collect all the telemetry in one cloud securely. It correlates issues across your entire stack, debugs and collaborate from the IDE, and provides AI assistance at every step.
Key Features:
- Monitors entire stack efficiently
- Secures telemetry in one cloud
- Correlates issues across stack
- Provides AI assistance at every step
Why do we recommend it?
New Relic is recommended for its comprehensive monitoring capabilities, enabling teams to debug and improve their systems efficiently and securely.
Moreover, it gives a clear overview of the performance of your software environment. Therefore, you tend to find and fix problems faster, build an accurate DevOps team, and deliver value to your customers.

Who is it recommended for?
Ideal for Dev and Ops teams requiring a holistic view of their software environment, looking to quickly identify and resolve performance issues.
Pros:
- Full-stack monitoring and debugging
- Secure cloud-based telemetry collection
- Enhances collaboration and troubleshooting
- AI-driven assistance for issue resolution
Cons:
- May require time to learn features
Website Link: https://github.com/basho/riak_newrelic
9. Riemann
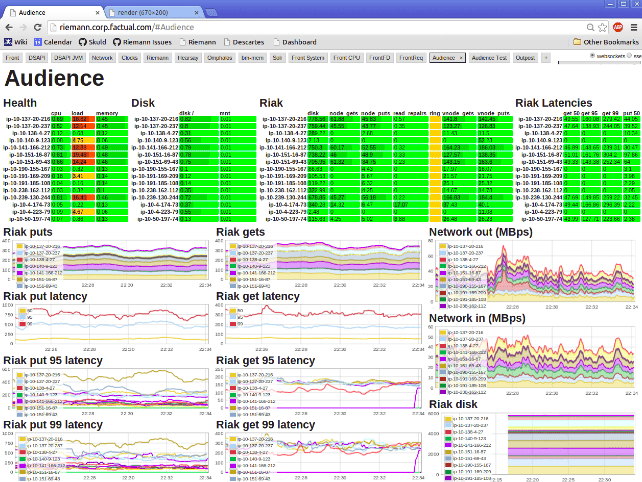
Riemann collects events from your servers and applications using a sturdy stream processing language. Several moving parts provide the users with low latency and transient shared state for systems. The fields included in Riemann are the functions that accept events. These events are structured with standard fields like host and services and even provide dozens of built-in streams like filtering, altering, and combining events or writing your own.
Key Features:
- Collects events from servers/applications
- Low latency and shared state
- Extendable syntax for event handling
- Real-time dashboard updates
Why do we recommend it?
Riemann is highly recommended for its robust stream processing language and real-time monitoring capabilities, making it a strong tool for event management.
Who is it recommended for?
Best suited for teams needing a powerful tool to manage low-latency, high-volume event streams, particularly in complex IT environments.
Pros:
- Efficient and fast event collection
- Customizable for specific needs
- Diagnoses problems quickly
- Supports real-time monitoring and analysis
Cons:
- Requires technical expertise to configure
Website Link: https://riemann.io/
Final Thoughts
Multiple open-source, self-hosted, or service-based solutions are available for aggregating and analyzing statistics and log data. These tools enable you to monitor, alert, and analyze trends on a Riak cluster. Furthermore, it exposes numerous forms of statistical information in various ways. Therefore, it solely helps the organization operate its processes smoothly and seamlessly.


