
High-Availability Proxy (HAProxy) is a free and open-source utility used for load balancing in the cloud and also doubles up as a proxy server for HTTP and TCP-based applications.
Here is our list of the best tools to monitor the health of HAProxy:
- Site24x7 – FREE TRIAL Comes with capabilities to configure the HAProxy plugin so you can collect and analyze its metrics for a comprehensive understanding of its performance. Start a 30-day free trial.
- ManageEngine Applications Manager – FREE TRIAL This tool's HAProxy monitor auto-discovers the metrics of HAProxy and tracks the performance and the maximum number of connections that HAProxy can handle. Start a 30-day free trial.
- ManageEngine OpManager Nexus – FREE TRIAL Comprehensive application performance management platform that can monitor the health of your HAProxy instances. Start a 30-day free trial.
- Datadog Streamlined tool that stores, visualizes, and correlates metrics from HAProxy to give meaningful insights about the performance of your website.
- NewRelic This tool collects metrics from HAProxy and visualizes its performance with respect to your entire organization.
- Dynatrace Provides socket and HTTP monitoring modes for collecting data from HAProxy and analyzing it.
- Opsview This tool's Opspack monitors all HAProxy servers and checks their metrics such as connections, requests, responses, incoming and outgoing bytes, and sessions.
- Zabbix Free and open-source tool for monitoring the different metrics of HAProxy servers.
- AppOptics Application Performance Monitoring One of the most popular tools for HAProxy monitoring as it balances system performance while performing thorough load balancer monitoring.
In particular, this tool is used for websites that experience high traffic volumes and is the driving tool behind many of the world's most popular websites. Its performance and efficiency have also made it the hands-down choice of the load balancer and it is shipped with most Linux distributions as well.
HAProxy is easy to deploy with existing architectures and doesn't require big changes to your current setup. At the same time, it is risk-free and never exposes the underlying web servers to public networks like the Internet. This is also why it is deployed extensively across cloud applications today.
From the above discussion, it's clear that HAProxy is integral for the availability and performance of your website, especially if it is experiencing a surge in web traffic. This also means that HAProxy is a critical asset that must be monitored at all times to ensure that it continues its high performance.
However monitoring the HAProxy manually is not easy, and this is why you need automated tools that will constantly look at the health and availability of HAProxy and report any issues at the earliest. Let's now take a deeper look at the capabilities of each of these tools.
The Best Tools to Monitor HAProxy Health
Our methodology for selecting HAProxy monitoring tools and software
We reviewed various HAProxy health monitors and analyzed the options based on the following criteria:
- Support for various cloud environments
- Proxy and load balancing options
- Ease of use and deployment
- A facility to analyze network performance over time
- Graphical interpretation of data, such as charts and graphs
- A free trial period, a demo, or a money-back guarantee for a no-risk assessment
- A good price that reflects value for money when compared to the functions offered
1. Site24x7 – FREE TRIAL
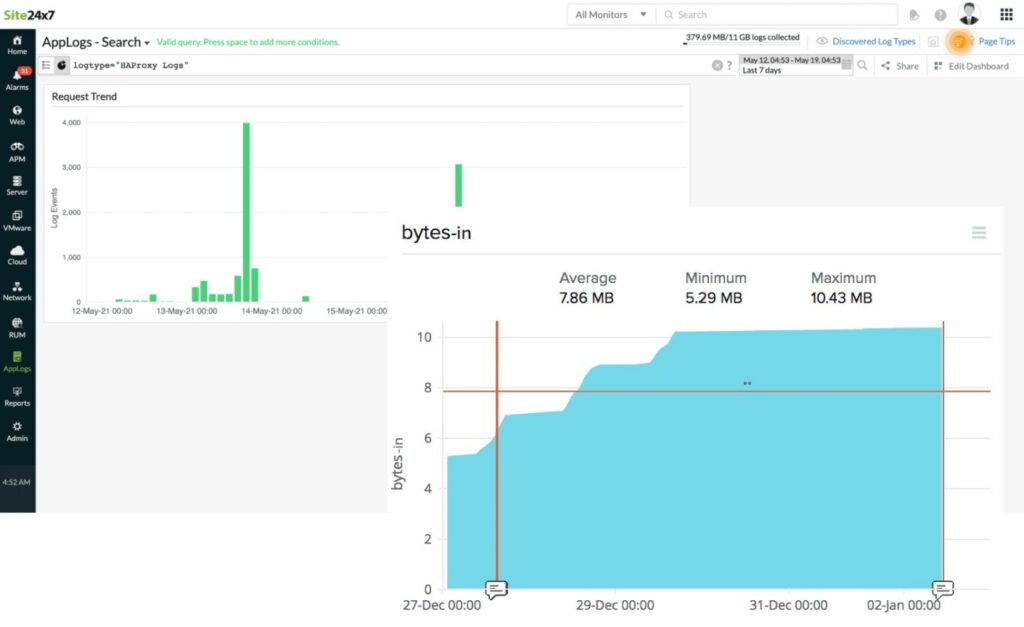
Site24x7 HAProxy Monitoring comes with capabilities to configure the HAProxy plugin so that you can evaluate its performance based on the metrics collected from it.
Key Features:
- Provides in-depth visibility into the performance, availability, and usage of HAProxy servers
- Records the total number of errors that occurred when requests were made to the servers
- Counts the total number of bytes received and sent by frontend proxies
- Supports Python version 2.7 and greater
- Generates performance charts on your HAProxy servers
- Helps to quickly identify issues in the operation and performance of HAProxy servers
- Ensures the optimal performance of HAProxy servers
Feature Distinction
We highly recommend this tool to enhance performance through HAproxy plugins.
Why do we recommend it?
Site24x7 is recommended for its ability to provide in-depth visibility into HAProxy server performance and usage. It stands out for its user-friendly interface and real-time data analytics.

Who is it recommended for?
Recommended for network and infrastructure administrators who need a holistic monitoring solution that supports a range of network components, including real user monitoring, on a single platform.
Pros:
- One of the most holistic monitoring tools available, supporting networks, infrastructure, and real user monitoring in a single platform
- Uses real-time data to discover devices and build charts, network maps, and inventory reports
- Is one of the most user-friendly network monitoring tools available
- User monitoring can help bridge the gap between technical issues, user behavior, and business metrics
- Supports a freeware version for testing
Cons:
- Is a very detailed platform that will require time to fully learn all of its features and options
Site24x7 comes with many pricing options to meet your business needs. Here's a snapshot of the plans.
- Website monitoring
- Starter – $9/month
- PRO – $35/month
- Classic – $89/month
- Enterprise – $225/month
- Infrastructure. It starts at $9 per month. You can include add-ons at extra cost.
- APM. It starts at $35/month, and add-ons cost extra.
- All-in-One
- PRO – $35/month
- Classic – $89/month
- Elite – $225/month
- Enterprise – $449/month
- MSP. Starts at $45/month and add-ons cost extra.
Start with a 30-day free trial.
2. ManageEngine Applications Manager – FREE TRIAL
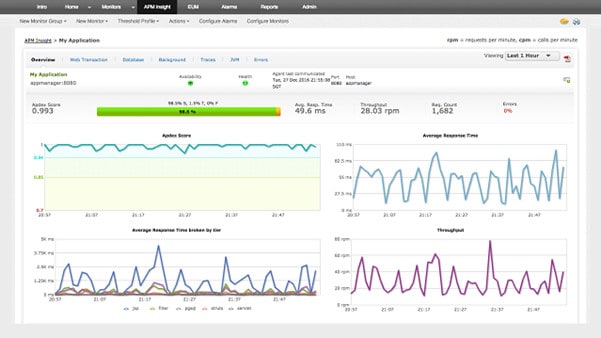
ManageEngine Applications Manager comes with advanced HAProxy monitoring capabilities that ensure that your HAProxy handles only what it is capable of. In case of extra load, it sends an alert to the concerned people.
Key Features:
- Automatically discovers your entire service topology
- Tracks the maximum number of connections that HAProxy can handle
- Monitors the number of open pipes to help your HAProxy run optimally
- Collects frontend details such as client connections and requests to provide information about the client's interactions with the load balancer
- Tracks the session creation rate to identify any traffic spikes
- Checks the number of request denials due to security restrictions and alerts if these numbers are higher than the established thresholds
- Measure the communication between HAProxy and backend servers to identify and fix issues quickly
- Tracks the retry rate to make it easy to drill down to the cause of errors
- Checks the average response time to measure the latency of your load-balancers
- Generates extensive reports to help you respond quickly to outages as soon as they occur
- Helps to identify and fix performance issues quickly
Feature Distinction
You can access this web-based tool from any device and location.
Why do we recommend it?
ManageEngine Applications Manager is recommended for its advanced HAProxy monitoring capabilities, ensuring optimal load balancing and performance. Its ability to automatically discover service topology is particularly beneficial.

Who is it recommended for?
This tool is well-suited for businesses looking for on-premise and cloud deployment options, and for IT professionals who need to understand the interdependencies between applications and how they impact business operations.
Pros:
- Offers on-premise and cloud deployment options, giving companies more choices for install
- Can highlight interdependencies between applications to map out how performance issues can impact businesses operations
- Offers log monitoring to track metrics like memory usage, disk IO, and cache status, providing a holistic view into your database health
- Can automatically detect databases, server hardware, and devices in real-time
Cons:
- Can take time to fully explore all features and options available
Click here for an online quote. Click here to download.
3. ManageEngine OpManager Nexus – FREE TRIAL

ManageEngine OpManager Nexus, formerly OpManager Plus, collects extensive metrics about your HAProxy instances to help understand their health, availability, and performance. This tool can also automatically discover service topologies to identify the maximum number of connections that can be handled safely by your infrastructure. Based on this information, you can better optimize your HAProxy instances and their communication with backend servers.
Key Features:
- Collects frontend details like client connections and requests.
- The well-designed dashboard displays all relevant metrics through a single interface.
- Gauges the peaks and drops to ensure continuous availability.
- Tracks session creation rates to identify sudden traffic spikes.
- Measures connection failures and tracks the retry rate to identify the cause of failures.
- Correlates frontend and backend metrics for quick troubleshooting.
- Comes with an intelligent alerting system.
- Supports informed decision-making for future capacity planning and optimization.
Feature Distinction
Its well-designed dashboards display all relevant information in a way that is easy to understand.
Why do we recommend it?
OpManager Nexus is a comprehensive monitoring platform that proactively checks the health and availability of your HAProxy instances, so you can fix the problems before they impact end users. To achieve this, it collects extensive metrics like connection times, failure rates, number of retries per connection, and more. All this data is analyzed to get a complete picture of the potential root cause of the problem. Moreover, its flexible and customizable alerting mechanism can help you stay on top of issues as they occur.

Who is it recommended for?
It is a good choice for system administrators and MSPs who are responsible for ensuring the health and availability of HAProxy instances. It is also a good choice for organizations that must meet regulatory compliance.
Pros:
- Proactive data collection and analysis.
- Robust alerting mechanism that sends alerts through email, SMS, and Slack.
- Dynamic thresholds to get meaningful notifications.
- Integration with popular platforms.
- Historical data retention and trend analysis.
Cons:
- Some users may require technical help for the initial setup.
ManageEngine OpManager Nexus offers two editions: Professional and Enterprise. The Professional edition starts at $1,233 for 50 devices, while the Enterprise edition starts at $19,995 for 1000 devices. Start a 30-day free trial.
4. Datadog
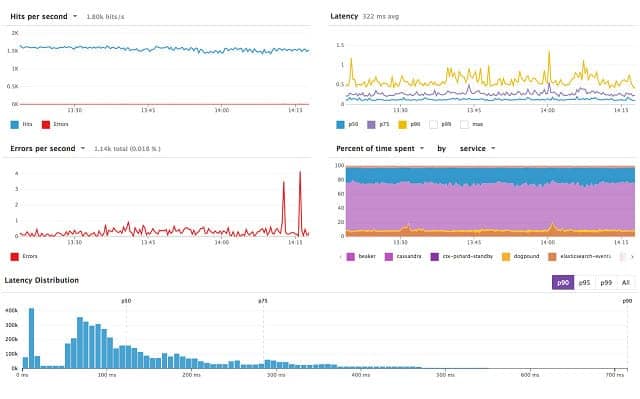
Datadog is a streamlined tool that stores, visualizes, and correlates your HAProxy metrics with the rest of your infrastructure to give a comprehensive idea of your website's performance.
Key Features:
- Monitors the front-end metrics such as connections and client requests, the backend metrics such as availability and the health of backend servers, and health metrics that reflect the state of your HAProxy setup
- Correlates all the metrics with your infrastructure to give a comprehensive understanding of your infrastructure
- Helps to identify potential errors and vulnerabilities quickly
- Provides visibility into the health and performance of HAProxy, including metrics such as session utilization, latency, denials, and queue length and time
- Creates a quick and human-readable view of HAProxy's performance
- Enables you to use both the interactive and non-interactive modes to collect metrics
- Provides the flexibility to configure your Datadog agent to monitor just what you want
- Generates insightful graphs and reports
- Enables you to create a custom HAProxy dashboard
- Automatically collects HAProxy logs and analyzes them
- Allows you to filter the content on logs to find what you want
- Enables you to set up custom alerts
- It can monitor individual hosts, containers, processes, services, and more
- The outlier detection feature makes recommendations on the essential metrics
Why do we recommend it?
Datadog is recommended for its comprehensive approach to HAProxy monitoring, correlating metrics with overall infrastructure for a complete view of website performance.

Who is it recommended for?
Suitable for network administrators who need cloud-based, customizable dashboards and seek a tool that provides both internal and external network insights, and supports auto-discovery for real-time network updates.
Pros:
- Easy-to-use customizable dashboards
- Cloud-based SaaS product allows monitoring with no server deployments or onboarding costs
- Can monitor both internally and externally giving network admins a holistic view of network performance and accessibility
- Supports auto-discovery that builds network topology maps on the fly
- Changes made to the network are reflected in near real-time
- Allows businesses to scale their monitoring efforts reliably through flexible pricing options
Cons:
- Would like to see a longer trial period for testing
Datadog offers many pricing plans and tiers to enable you to customize the offering as per your business needs. Click here for a free trial.
5. NewRelic
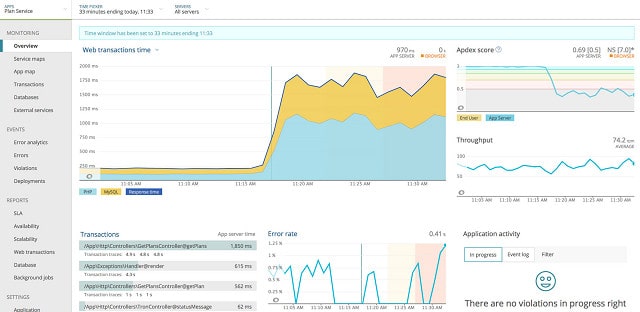
NewRelic‘s HAProxy integration plugin collects metrics from the HAProxy server, aggregates it with your entire infrastructure, and gives you a 360-degree view of the overall performance.
Key Features:
- Aggregates and visualizes critical performance metrics of the HAProxy server
- Compatible with HAProxy versions 1.3 to 2.2
- It comes with a guided install that creates a customized CLI command for your environment
- Discovers other applications and log sources in your environment and recommends which ones you should instrument
- Integrations are also available in Tarball format
- It can be enabled via Kubernetes, Amazon ECS, or on-host
- Collects both inventory and metrics information
- Allows you to use labels to add key/value attributes to your metrics
- The integration is open source, so you can customize the code to meet specific requirements
Why do we recommend it?
NewRelic is recommended for its ability to aggregate and visualize critical HAProxy server performance metrics, integrating seamlessly with a wide range of environments.

Who is it recommended for?
Ideal for small to medium-sized networks, particularly those using Microsoft Azure, and for administrators who value simple, intuitive dashboards and anomaly detection features.
Pros:
- Certified for Microsoft Azure monitoring
- Uses anomaly detection to highlight abnormal behavior in your Azure environment
- Uses simple but intuitive admin dashboards
Cons:
- Better suited for small to medium-sized Azure networks
Contact the Sales team for a custom quote. Click here to get started.
6. Dynatrace
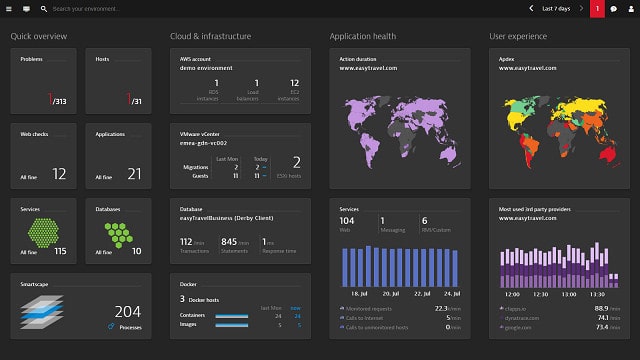
Dynatrace‘s HAProxy monitoring collects metrics from HAProxy and analyzes them to provide insights. It supports socket and HTTP monitoring mode.
Key Features:
- The socket mode enables you to use all the CPU cores
- In addition, it automatically detects multiple HAProxy processes, sockets, and bindings
- Supports global and local configurations
- Automatically activates HAProxy monitoring in all hosts
- Monitors all HAProxy components
- Quickly detects anomalies and, accordingly, sends notifications
- Supports HAProxy running inside Docker containers
Why do we recommend it?
Dynatrace is recommended for its high-quality HAProxy monitoring capabilities, utilizing AI for baseline analysis and anomaly detection, and supporting HAProxy running in Docker containers.

Who is it recommended for?
Best suited for large networks, it's ideal for enterprise-level operations centers that require highly visual, customizable dashboards, and cloud-based operations.
Pros:
- Highly visual and customizable dashboards, excellent for enterprise NOCs
- Operates in the cloud, allowing it to be platform-independent
- Leverages AI to provide baseline analysis and detect user behavior anomalies
Cons:
- Designed specifically for large networks, smaller organizations may find the product overwhelming
Dynatrace comes in six flavors, and they are:
- Full-stack monitoring – $69/month for an 8-GB host
- Infrastructure monitoring – $21/month for an 8-GB host
- Digital experience monitoring – $11k/month for 10k annual Digital Experience Monitoring units.
- Application security – $10/month for an 8-GB host
- Open ingestion – $25/month for 100K Davis Data units
- Cloud automation – $0.10/cloud automation unit
Click here for a free trial.
7. Opsview
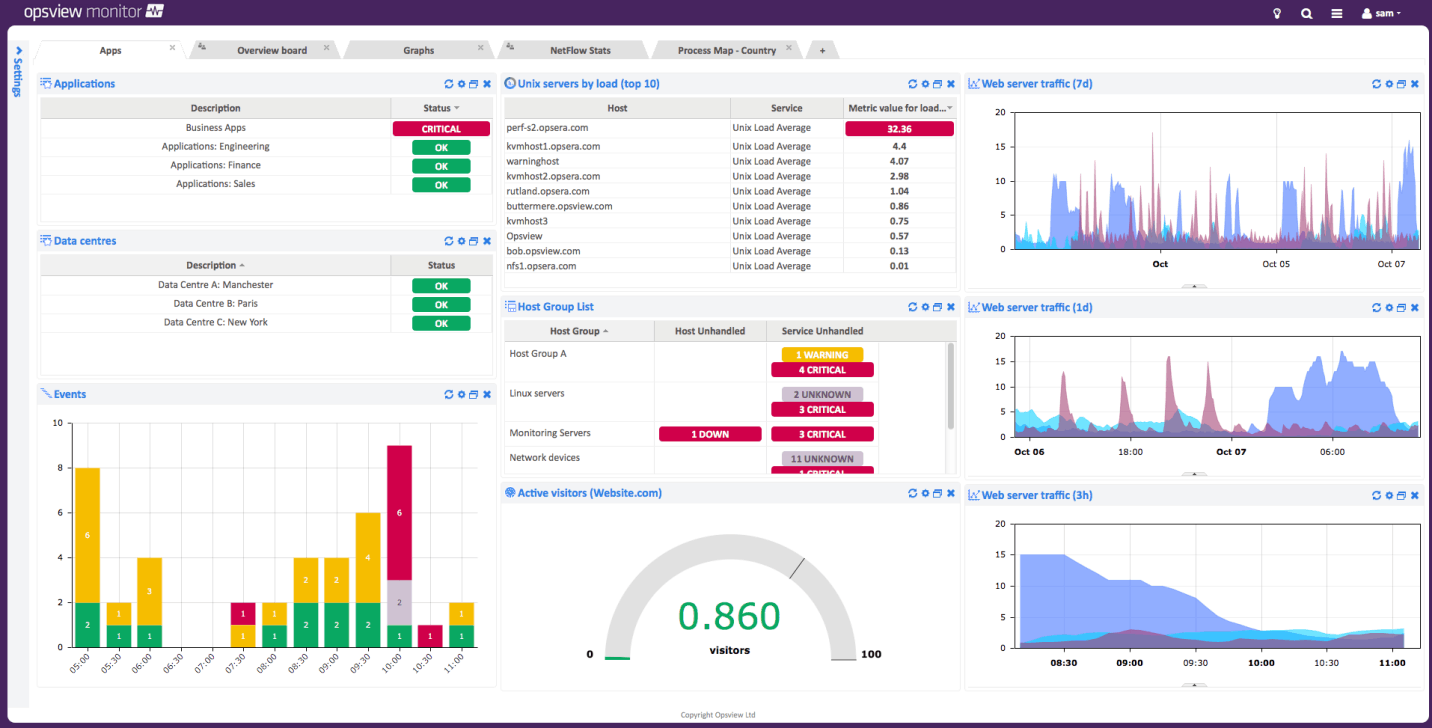
OpsView‘s HAProxy Opspack monitors all the metrics needed for the efficient running of an HAProxy stack. Specifically, it checks for incoming and outgoing bytes, connections, requests, responses, and sessions of HAProxy servers.
Key Features:
- Checks the incoming and outgoing bytes
- The time (in ms) that it takes for a session to connect
- Current number in the queue
- The number of denied connections, sessions, error responses, and requests
- The time spent in the queue
- The number of requests and sessions per second
- Percentage of used sessions
- The number of re-dispatched and retried warnings
Why do we recommend it?
Opsview is recommended for its comprehensive monitoring of HAProxy metrics, ensuring efficient running of HAProxy stacks with its Opspack.

Who is it recommended for?
Recommended for organizations that require a flexible and customizable interface for monitoring various aspects of their network, including HAProxy, J-Flow, etc., and those who prefer a tool that supports both free and paid versions.
Pros:
- Supports multiple forms of monitoring (HAProxy, J-Flow, etc)
- Clean easy to use interface
- Highly flexible and customizable interface
- Supports a free and paid version
Cons:
- Requires Opsview Monitor to monitor J-Flow, not a standalone tool
Click here for a demo, Click here for a trial.
8. Zabbix
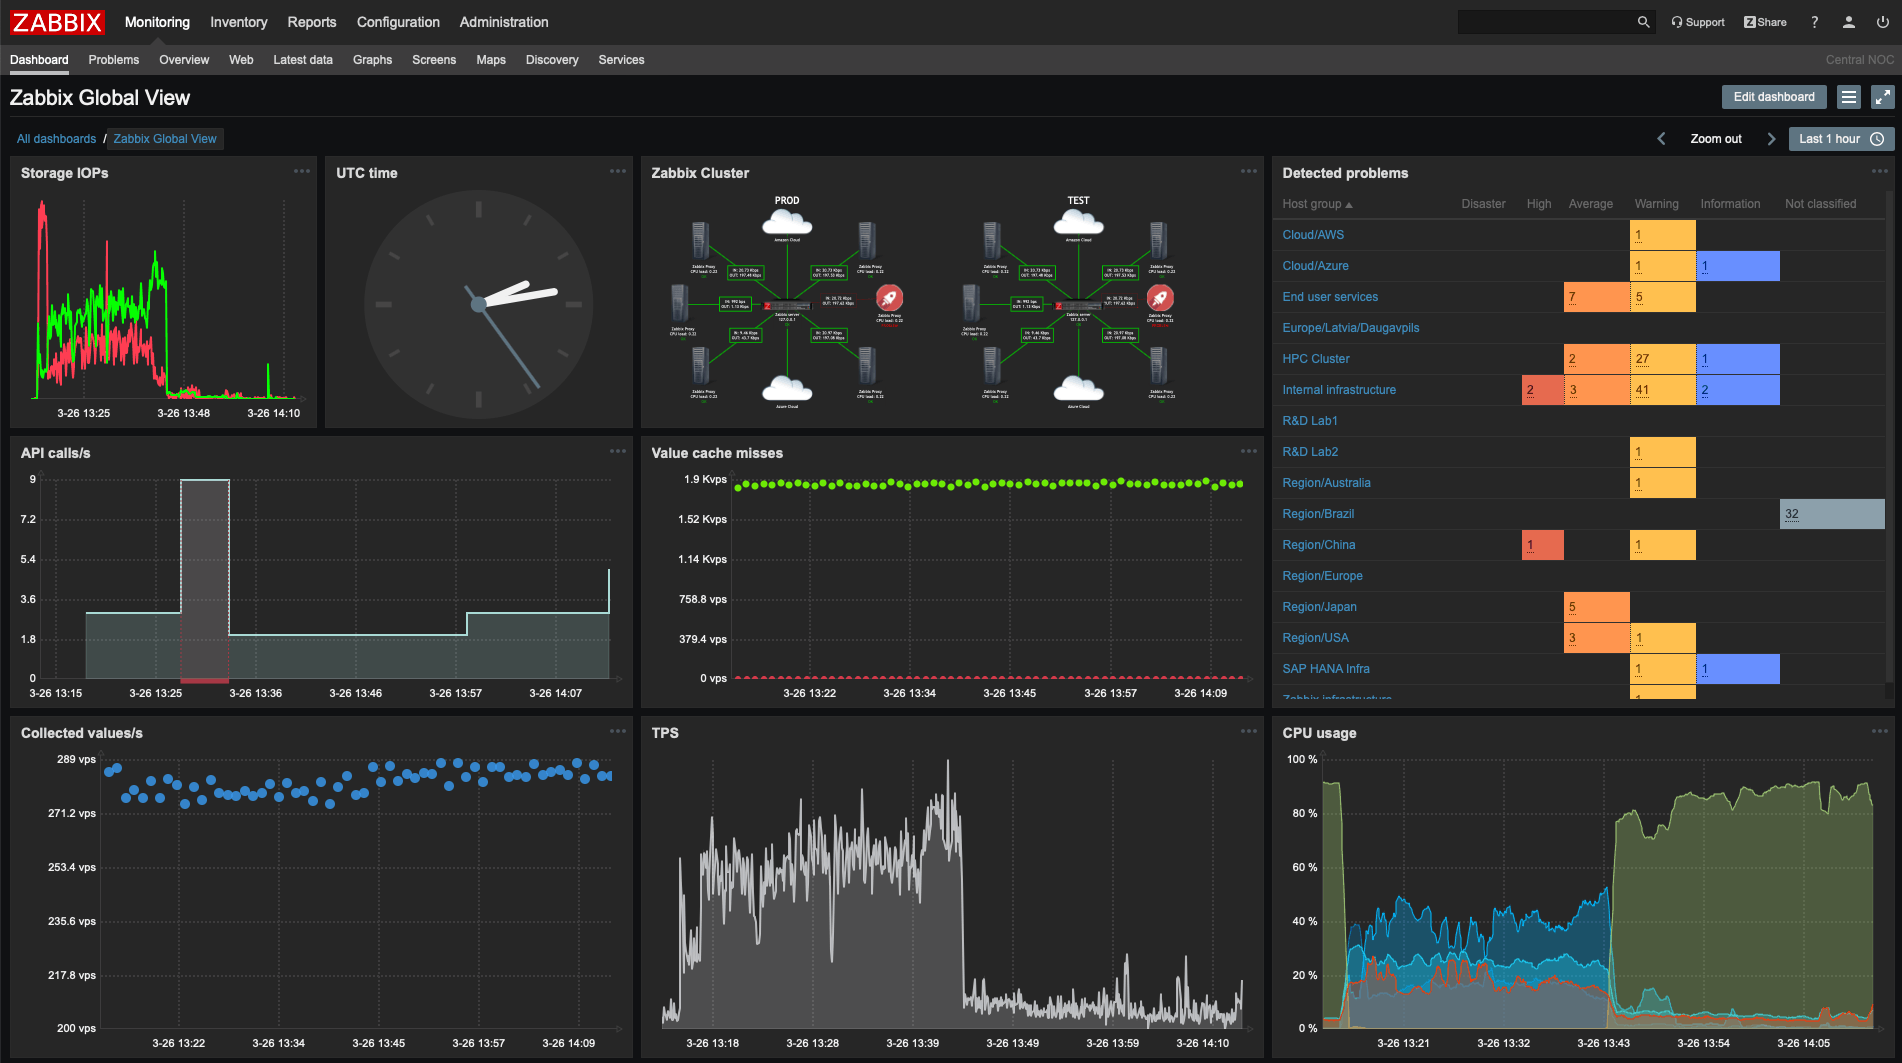
Zabbix is a free and open-source monitoring solution for HAProxy servers. It monitors different aspects of these servers to ensure their high availability and performance.
Key Features:
- Requires no external scripts
- Collects all the metrics needed in one go for greater efficiency
- Supports HTTPS and redirects
- Handles frontend, backend, and server discoveries
- Collects HAProxy's version, uptime, service stats, service response time, backend and frontend metrics, status, response time, error connections, response errors, unassigned requests, time in queue, re-dispatched requests per second, incoming and outgoing traffic, weight, queue metrics, and more
- Allows you to set triggers and threshold values
Why do we recommend it?
Zabbix is recommended for its robust, open-source solution for HAProxy server monitoring, offering a wide range of metrics collection without needing external scripts.

Who is it recommended for?
Ideal for users who prefer a transparent, open-source tool that uses both SNMP and ICMP for monitoring, and for those who require immediate device detection and configuration changes, along with a robust notification system.
Pros:
- Open-source transparent tool
- Uses both SNMP and ICMP for a broader monitoring range
- Can detect new devices and configuration changes immediately
- Offers useful templates for quick insights
- Robust notification system supports SMS, email, custom script, and webhook
Cons:
- Would like to see more alerting options
Zabbix is FREE, Click here to download.
9. AppOptics Application Performance Monitoring
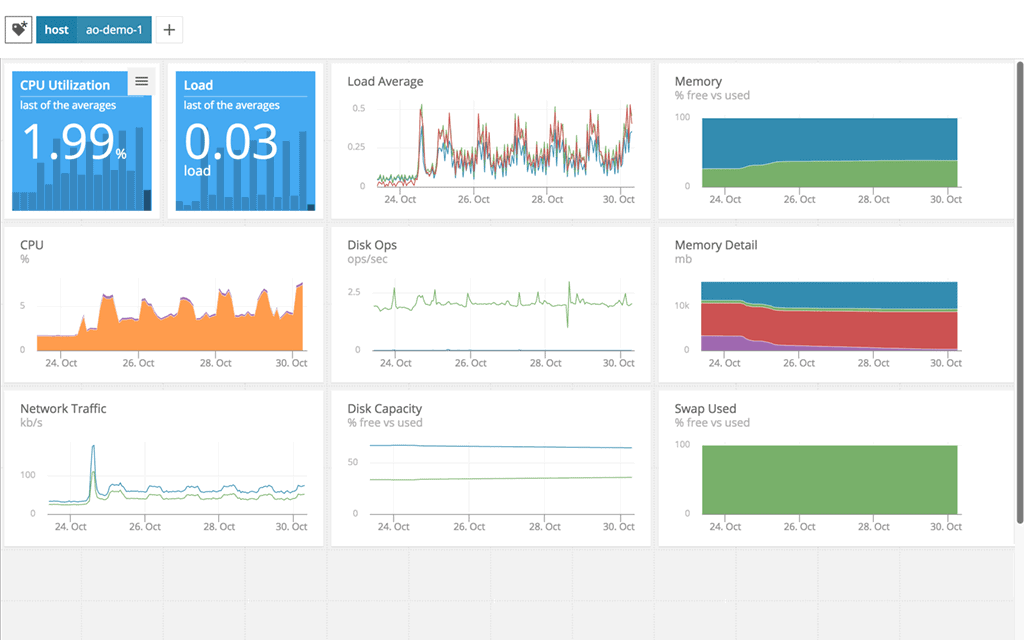
AppOptics Application Performance Monitorings by SolarWinds is a comprehensive monitoring tool that balances system performance with in-depth monitoring of the HAProxy servers to give you the best of both worlds.
Key Features:
- Provides deep insights into the overall system performance
- Troubleshoots errors and slowdowns
- Constantly checks the health of HAProxy and, through it, helps to identify potential problems early
- Tracks the count of clients using your proxy servers at any time
- Monitors the response time and sends alerts in case of potential slowdowns
- Generates actionable insights on the five crucial load-balancing metrics: latency, target host health, rejected connections, connection count, and 5xx status codes
- Helps to identify and address the root cause of a system performance issue
- Provides the visibility required to resolve slow performance issues
- Allows you to create out-of-the-box dashboards to view information just the way you want
- Generates clear graphs to identify problems
- Integrates with SolarWinds Loggly for analyzing log traces
Feature Distinction
The highlight of this tool is its ease of use, as we can move across application metrics, traces, and custom data to solve performance.
Why do we recommend it?
AppOptics Application Performance Monitoring is recommended for its comprehensive monitoring and in-depth analysis of HAProxy servers. It offers a balance between system performance insights and detailed HAProxy monitoring.

Who is it recommended for?
This tool is ideal for organizations looking for a scalable cloud service that can monitor multiple platforms like Docker, Azure, and Hyper-V, and for those who require detailed visualizations of their network's health and performance.
Pros:
- Offers great visualizations reflecting live and historical health metrics and resource consumption
- Is easily scalable cloud service
- Tracks all major resources focusing on over 180 different metrics
- Can monitor Docker, Azure, and Hyper-V platforms, offering more flexibility than competing options
Cons:
- Would like to see a longer trial period
Contact the sales team for a quote. Click here for a fully functional 30-day free trial.
Final Words
To conclude, HAProxy is a popular load balancing server that powers some of the most popular high-traffic websites. This free and open-source tool also doubles up as HTTP and proxy servers when needed.
Since this is a critical resource of organizations, it requires constant monitoring, and the tools that we have described earlier can handle this for you.
HAProxy Health Monitoring Tools FAQs
How does HAProxy monitor server health?
HAProxy can monitor server health using several methods, including checking TCP or HTTP responses, monitoring server response times, and checking server availability.
What are some common server health metrics monitored by HAProxy?
Common server health metrics monitored by HAProxy include server response time, error rate, and availability.
How does HAProxy react to unhealthy servers?
HAProxy can react to unhealthy servers by removing them from the load balancing rotation or by directing traffic to healthy servers.
What are some common causes of unhealthy servers in HAProxy?
Common causes of unhealthy servers in HAProxy include server overload, network connectivity issues, and server hardware failures.
How can I troubleshoot HAProxy health issues?
To troubleshoot HAProxy health issues, you can use HAProxy logging and monitoring tools to identify unhealthy servers and analyze server response times and error rates. You can also use server and network monitoring tools to identify potential hardware or network issues.
How can I optimize HAProxy health?
To optimize HAProxy health, you can use techniques such as load balancing algorithms, server weighting, and session persistence to ensure that traffic is directed to healthy
What are some best practices for maintaining HAProxy health?
Best practices for maintaining HAProxy health include regularly monitoring server health metrics, configuring load balancing algorithms and weighting, setting up alerts and notifications, and performing regular maintenance and updates.


