

In today's complex networks, load balancers are integral as they increase the capacity and help to balance the load across different servers. The most significant advantage with load balancers is they ensure the availability of your applications at all times, as the load is spread across two or more servers.
Further, if one server is down, it automatically routes traffic to other servers, so there is little to zero downtime.
Here's a list of the well-known tools that provide ELB health checks:
- ManageEngine Applications Manager – FREE TRIAL The ELB monitoring feature gathers real-time performance and plots them on a graph, so anomalies are evident. Accordingly, it sends alerts. Start a 30-day free trial.
- Site24x7 – FREE TRIAL This tool gathers critical performance metrics and metadata of AWS ELB and, through it, empowers you to monitor its performance and availability. Access a 30-day free trial.
- Datadog Monitors and optimizes AWS ELB for its optimum performance. It also sends notifications of potential issues, so you can fix them before it impacts your end customers.
- Paessler PRTG This is a sensor-based tool where you can measure different metrics using sensors. It offers the flexibility to customize the monitoring tool to meet your specific needs.
- Dynatrace This unified ELB monitoring tool provides quick insights into the working of your AWS ELB to empower you to make the appropriate decisions and create strategies.
- Splunk This monitoring tool has partnered with AWS to provide detailed insights into the working of ELB and the overall AWS ecosystem.
- Sumo Logic This monitoring tool stays on top of the performance of ELB and helps to optimize its configuration with detailed visual analytics.
- Instana from IBM is a comprehensive ELB monitoring and management tool that provides the insights you need to make the most of your AWS ELB.
The other advantage is that it helps with resource optimization, as it strives to direct traffic across multiple servers.
Out of the many load balancers available, Amazon Web Services' load balancing service called the Elastic Load Balancer (ELB) is the most popular. This service does the following:
- Routes incoming traffic according to server load and availability
- Scales resources automatically to meet demand
- Can be used with a single availability zone or across multiple zones
- Helps to maintain consistency in application performance
- Detects unhealthy instances and spread traffic through healthy channels and servers only
- ENsures high availability of applications
- Supports IPv4 and IPv6
- Comes with optional support for cipher, public key authentication, and SSL certificates.
As you can see, ELB plays a vital role in providing availability and fault tolerance for all applications hosted on AWS.
Types of Load Balancers
AWS ELB supports three types of load balancers, and each of these addresses the different requirements within a network. The three types of balancers are:
- Application Load Balancer – Handles the traffic coming from different applications and routes it in the most efficient and optimized way possible
- Network Load Balancer – Handles TCP traffic and maintains low latency rates
- Classic Load Balancer – Distributes incoming traffic from applications across multiple EC2 instances
Since this is a critical part of the infrastructure, it's crucial to ensure that the ELB is working fine at all times. This is done by many tools offered by different vendors that continuously monitor the health and availability of the ELB.
Our methodology for selecting the best ELB Health Check tool:
Priority is given to tools that provide real-time monitoring of Elastic Load Balancer (ELB) health and immediate alerts for any deviations or issues.
- We look for tools that can gather and analyze a wide range of metrics such as latency rate, error rates, request counts, and connection statistics.
- Tools that offer clear, visual representations of ELB performance metrics for easy interpretation and analysis are preferred.
- The ability to identify potential causes of ELB errors and provide insights for troubleshooting is crucial.
- Tools that seamlessly integrate with AWS and offer a holistic view of both ELB and the broader AWS ecosystem are highly valued.
- Tools that allow customization, such as setting threshold values for alerts and adapting to specific monitoring needs, are preferred.
Essential ELB health check tools
Let's do a deep dive into each of these tools, and accordingly, you can zero in on the tool that best fits your needs.
1. ManageEngine Applications Manager – FREE TRIAL
ManageEngine Applications Manager comes with many features, such as the ELB monitoring feature, ensuring that the ELB is always in good health and sends alerts when the metrics fall below threshold levels.
Key Features:
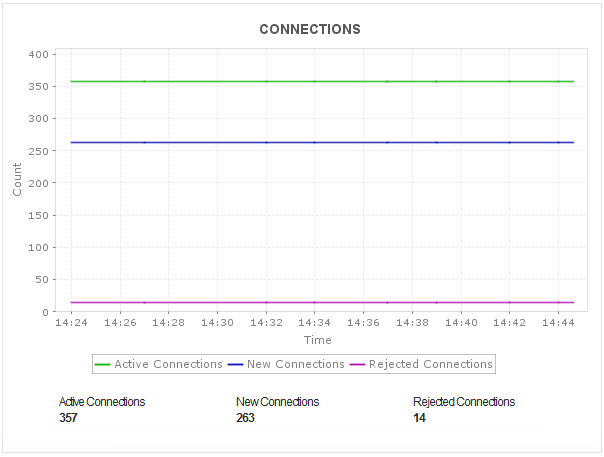
- Gathers metrics such as the latency rate, requests, error rates, and more
- Plots the metrics on a graph to get a visual representation of the deviations
- You can set the threshold values, so alerts are automatically sent when the metrics deviate significantly from the baseline values
- Checks the performance of ELB when multiple connections are established simultaneously
- Sends instant notifications of bottlenecks so that you can address the problem right away
- Checks the number of rejected connections to gauge the ELB's ability to connect and route a request
- Measures the number of rules and bytes processed by the ELB to gauge its capacity
- Tracks the number of healthy hosts as a fall in these numbers can increase latency
- Gathers statistics on the number of client and server errors generated by the ELB
- Identifies potential causes of errors to point you in the direction of the problem
- Detects problems in real-time
- Provides system-wide visibility on resource utilization, application performance, and operational health of the AWS infrastructure

Why do we recommend it?
We recommend ManageEngine Applications Manager for its comprehensive ELB monitoring capabilities. It ensures optimal health of ELB by tracking various metrics, sending alerts for deviations, and identifying potential causes of errors. Its ability to provide system-wide visibility on resource utilization and operational health enhances AWS infrastructure management.
Who is it recommended for?
This tool is ideal for organizations using AWS infrastructure, needing detailed monitoring and alerting capabilities for their Elastic Load Balancer. It's particularly beneficial for those who need on-premise or cloud deployment options and seek a tool that can map interdependencies between applications.
Pros:
- Offers on-premise and cloud deployment options, giving companies more choices for install
- Can highlight interdependencies between applications to map out how performance issues can impact businesses operations
- Offers log monitoring to track metrics like memory usage, disk IO, and cache status, providing a holistic view into your database health
- Can automatically detect databases, server hardware, and devices for real-time asset management
Cons:
- Can take time to fully explore all features and options available
Click here for a personalized quote that best meets your requirements. Click here to download a free version.
EDITOR'S CHOICE
ManageEngine Applications Manager is our top choice for ELB health check due to its comprehensive feature set and versatility. Its ELB monitoring capabilities ensure that Elastic Load Balancers remain in optimal health, with features like real-time metrics gathering, visualization through graphs, and customizable alerts. The tool's ability to check ELB performance under multiple connections, along with tracking the number of healthy hosts and identifying potential error causes, makes it exceptionally effective in maintaining ELB efficiency.
Additionally, the tool offers system-wide visibility, enhancing the operational health of the overall AWS infrastructure. Its flexibility in deployment, interdependency mapping, and extensive log monitoring capabilities provide a holistic view of database and infrastructure health, making it an ideal choice for organizations seeking thorough and reliable ELB monitoring solutions.
Download: Download a 30-Day Free Trial
Official Site: https://www.manageengine.com/products/applications_manager/
OS: Windows, Linux, and Cloud-Based
2. Site24x7 – FREE TRIAL
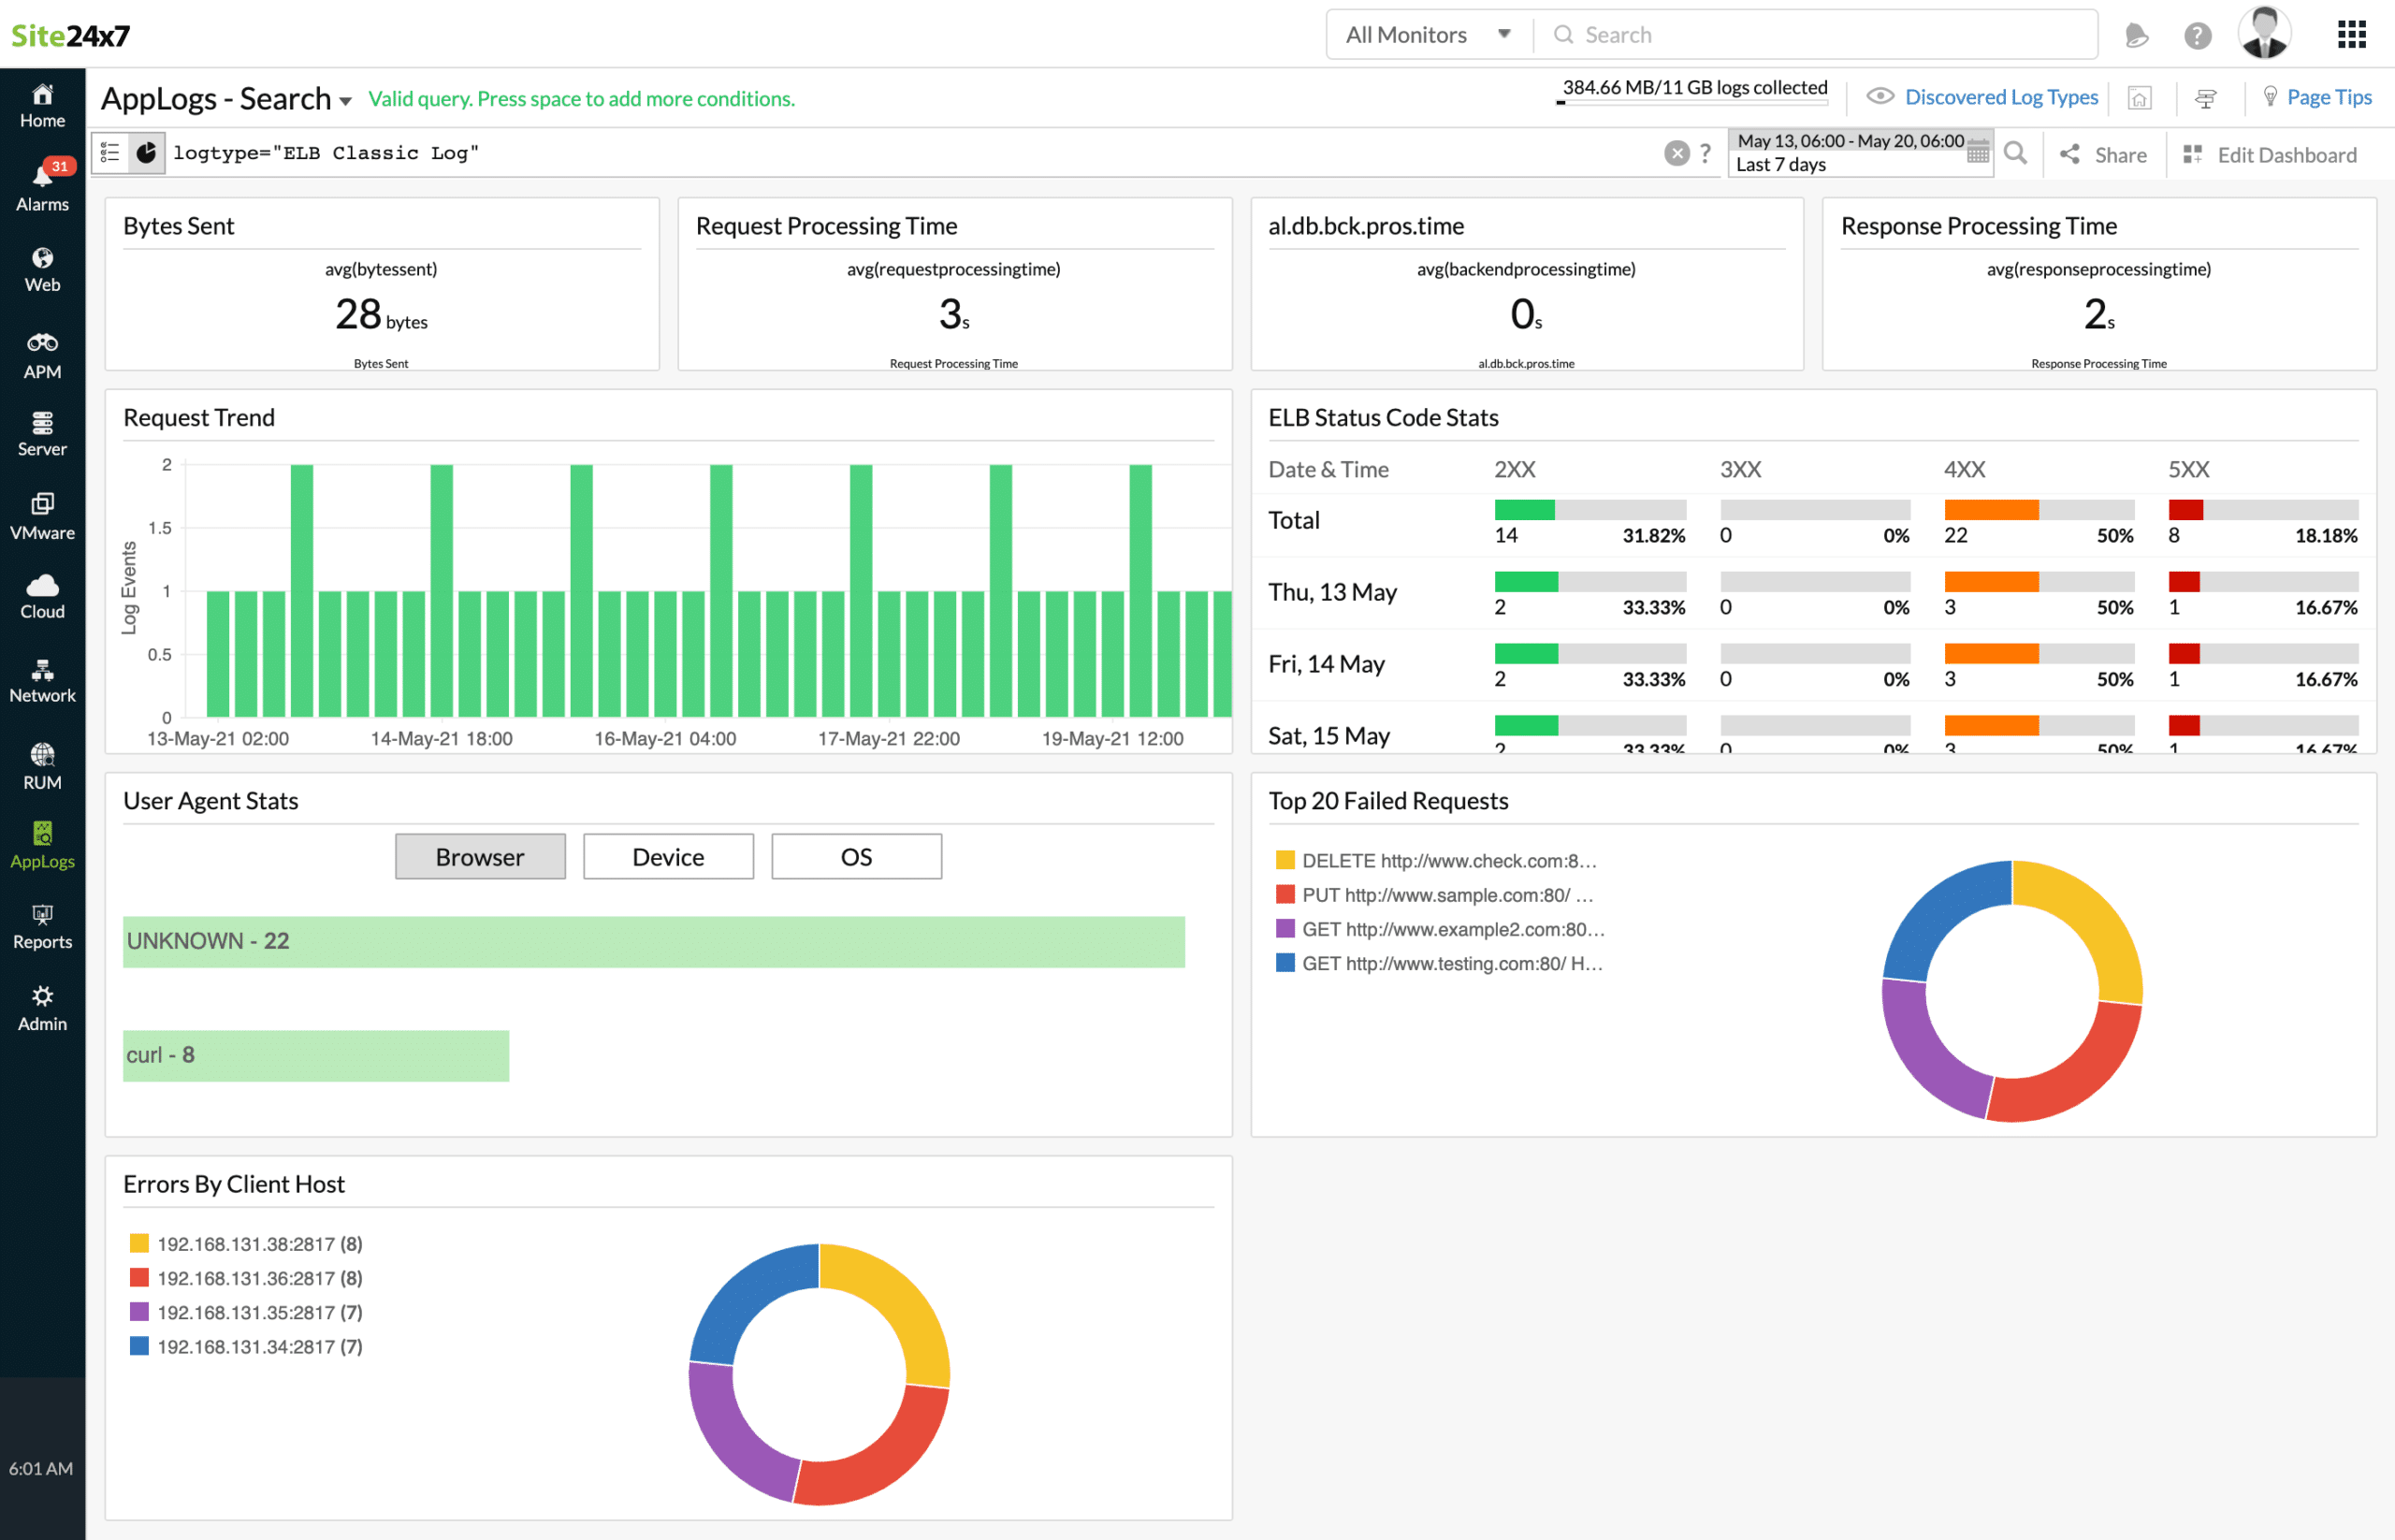
Site24x7 monitors AWS ELB metrics and metadata to monitor its performance and availability and ensure that the application requests received by the ELB are routed to the appropriate targets.
Key Features:
- Tracks the number of client requests received and routed by ELB
- Monitors the average request rate to give you an idea of the traffic demands of your applications
- Makes it easy to decide on auto-scaling options
- Identifies latency patterns
- Analyzes resource utilization to help with capacity planning
- Helps to configure thresholds and alerts to prevent request spillover
- Gathers statistics on HTTP error response codes
- Helps to identify the availability of EC2
- Sends alerts when metrics go below established thresholds
- Tracks the number of new and active TCP connections
- Provides insights into the scalability of ELB

Why do we recommend it?
Site24x7 is recommended for its effective monitoring of AWS ELB metrics and metadata, helping ensure performance and availability. Its features like tracking client requests, identifying latency patterns, and analyzing resource utilization make it a reliable tool for ELB performance monitoring.
Who is it recommended for?
This tool is ideal for administrators needing cloud-based monitoring with a range of out-of-box options and dashboard templates. It's especially useful for those looking to optimize uptime and implement effective capacity planning.
Pros:
- Flexible cloud-based monitoring option
- Offers a host of out-of-box monitoring options and dashboard templates
- Allows administrators to view dependencies within the application stack, good for building SLAs and optimizing uptime
- Offers root cause analysis enhanced by AI to fix technical issues faster
Cons:
- Site24x7 is a feature-rich platform with option that extended beyond databases management, may require time to learn all options and features
Site24X7 starts with a base price of $9 per month and allows you to include the add-ons you need for your business. Depending on what you add, your cost varies accordingly. Start with a 30-day free trial.
3. Datadog
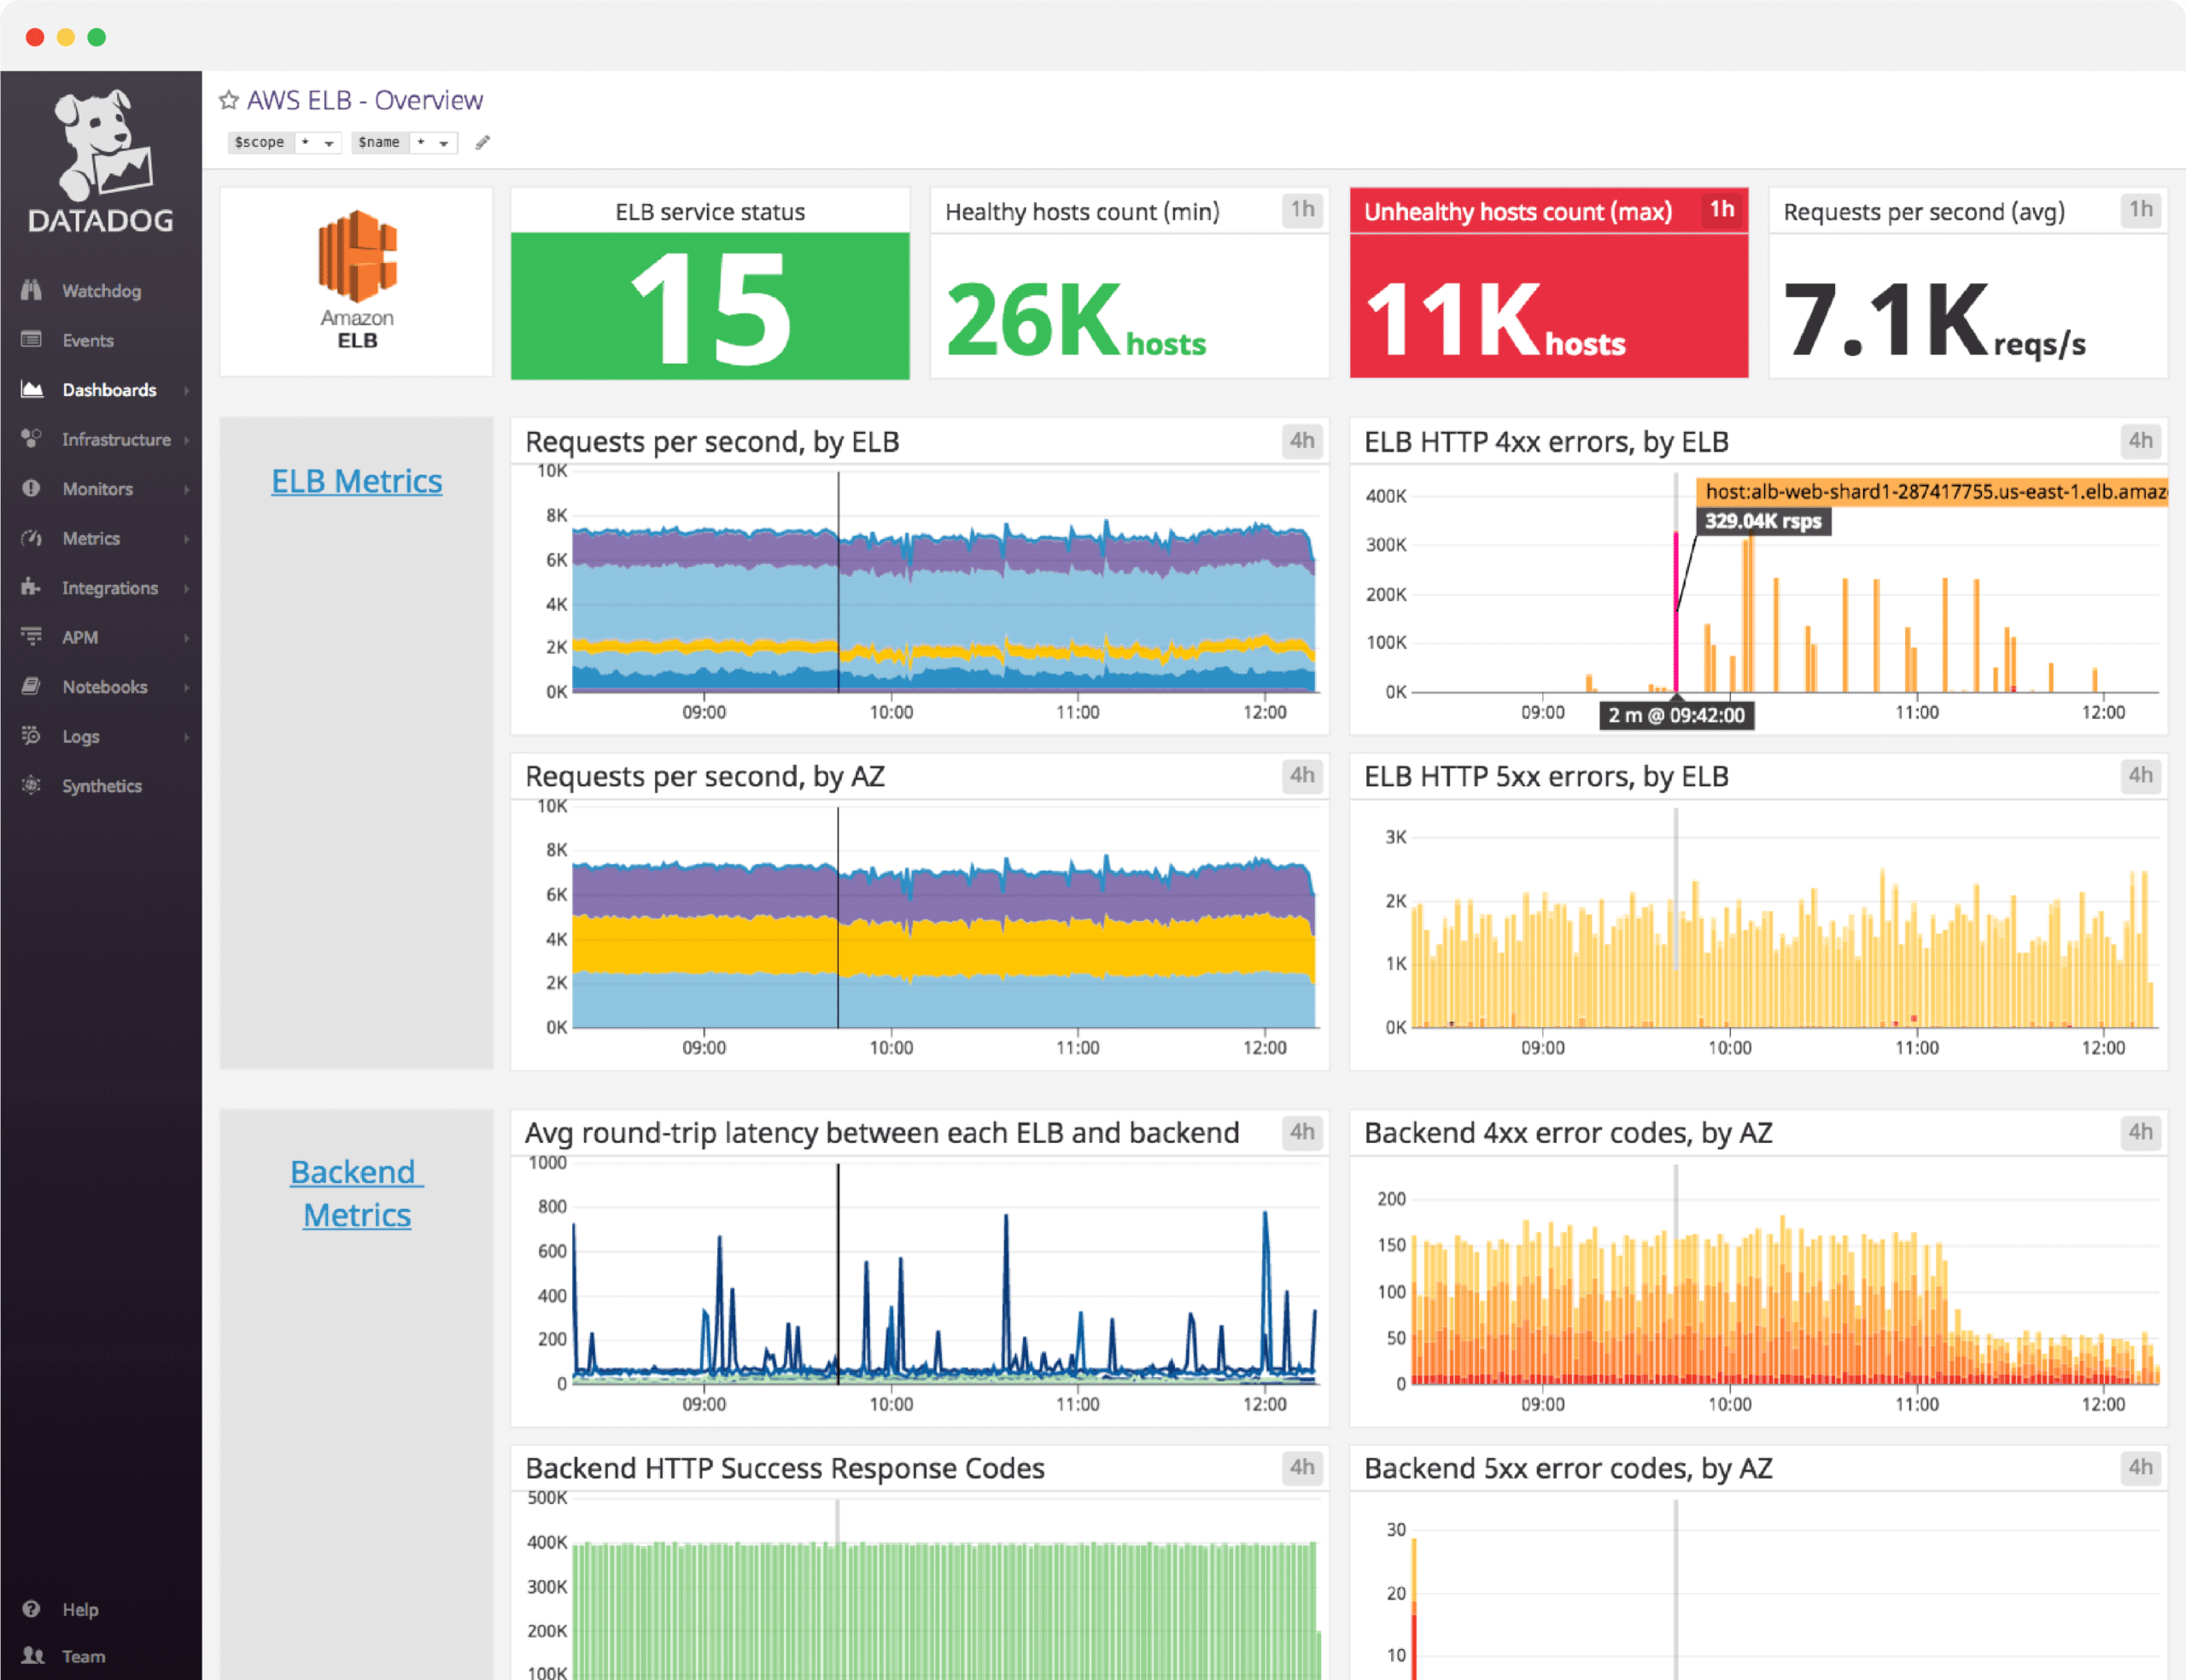
Datadog is an advanced tool that monitors and optimizes your AWS ELB to ensure that it is always in good health. It continuously checks the performance of ELB against established metrics and sends notifications in case of deviations.
Key Features:
- Monitors the workloads, client connects, host health, and application performance of ELB in real-time
- Collects more than 180 metrics that determine the health of the ELB
- Identifies misconfigurations and inefficiencies
- Points to the sources of traffic causing inefficiencies
- Uses a real-time service map to identify the root cause of problems
- Has AI-powered synthetic monitors to help you fix issues at the earliest
- Combines infrastructure metrics, logs, traces, user data, and more within a single platform to give you a comprehensive idea of the problem
- Uses Webhooks to generate rollbacks automatically
- Monitors both the front and backend to isolate problems related to specific areas
- Generates vital insights into the performance of different applications
- Helps to resolve incidents using a combination of other metrics
- Comes with self-maintaining browser and API tests to measure the availability of services
- Offers in-depth insights that are integrated across the entire stack
- You can use composite alerts to reduce false negatives

Why do we recommend it?
Datadog is recommended for its ability to monitor and optimize AWS ELB performance comprehensively. It collects a wide range of metrics, offers real-time service mapping, and uses AI-powered synthetic monitors for proactive issue resolution, making it a powerful tool for ELB health monitoring.
Who is it recommended for?
Datadog is suitable for businesses that require a holistic view of their network performance and accessibility, both internally and externally. It’s particularly beneficial for organizations looking to scale their monitoring efforts and need a tool that can reflect network changes in near real-time.
Pros:
- Offers numerous real user monitors via templates and widgets
- Can monitor both internally and externally giving network admins a holistic view of network performance and accessibility
- Changes made to the network are reflected in near real-time
- Allows businesses to scale their monitoring efforts reliably through flexible pricing options
Cons:
- Would like to see a longer trial period for testing
Pricing: With Datadog, you start with a basic bundle and add services as and when you need them. The base plan comes in three editions, and they are:
- Free – $0
- Pro – $15/host/month
- Enterprise – $23/host/month
Click here to get started for free.
4. Paessler PRTG
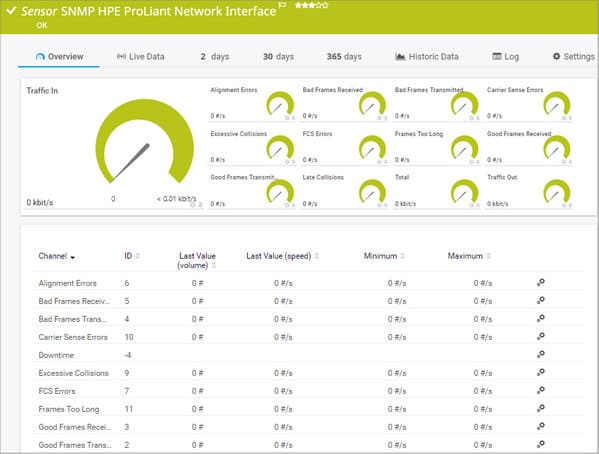
Paessler's PRTG is a flexible monitoring tool that gives you the option to choose what you want to monitor. Given that it's a sensor-based system, there's fine granular control over the metrics you want to monitor for any service or application. Such granularity ensures that you get just the insights you want to improve the performance and availability of your applications through a robust ELB.
Key Features:
- This sensor supports both the load balancer and the availability zone of AWS
- Requires access rights for Amazon Cloudwatch
- You have the flexibility to set the scanning interval, with the minimum being 15 minutes
- Supports the IPv6 protocol
- You can choose as many devices you want to monitor
- Allows you to set priorities in sensors
- Supports most AWS regions
- Displays the monitoring results in an intuitive graph
- Settings can be inherited from objects that are higher up in the hierarchy

Why do we recommend it?
Paessler PRTG is recommended for its sensor-based system that offers granular control over ELB monitoring metrics. Its flexibility, support for various AWS regions, and intuitive graphical display of monitoring results make it a versatile choice for ELB health monitoring.
Though the channels monitored by PRTG depend on the monitored device, available components, and the configuration settings, here is a broad list of channels it can support:
- Backend Connection Errors
- Downtime
- Healthy Hosts
- HTTPCode Backend 2XX
- HTTPCode Backend 4XX
- HTTPCode ELB 5XX
- Latency
- Requests
- Surge Queue Length
- Unhealthy Hosts
Metrics
Some of the metrics that PRTG can monitor with its sensors are:
- RequestCount (Sum)
- SpilloverCount (Sum)
- HealthyHostCount (Minimum)
- UnHealthyHostCount (Maximum)
- BackendConnectionErrors (Sum)
- HTTPCode_Backend_2XX (Sum)
- HTTPCode_Backend_3XX (Sum)
- HTTPCode_Backend_4XX (Sum)
- HTTPCode_Backend_5XX (Sum)
- HTTPCode_ELB_4XX (Sum)
- HTTPCode_ELB_5XX (Sum)
- Latency (Average)
- SurgeQueueLength (Average)
Who is it recommended for?
PRTG is well-suited for IT teams that require customizable monitoring solutions and want to monitor specific aspects of their AWS ELB. It's particularly beneficial for those needing a comprehensive platform with a range of alert mediums.
Pros:
- Uses a combination of packet sniffing, WMI, and SNMP to report network performance data
- Fully customizable dashboard is great for both lone administrators as well as NOC teams
- Drag and drop editor makes it easy to build custom views and reports
- Supports a wide range of alert mediums such as SMS, email, and third-party integrations into platforms like Slack
- Supports a freeware version – great for small businesses
Cons:
- Is a very comprehensive platform with many features and moving parts that require time to learn
The cost depends on the number of sensors you use. The existing plans are:
- PRTG 500: 500 sensors cost $1,750
- PRTG 1000: 1000 sensors cost $3,200
- PRTG 2500: 2500 sensors cost $6,500
- PRTG 5000: 5000 sensors cost $11,500
- PRTG XL1: Unlimited sensors for one installation cost $15,500
- PRTG Enterprise: 20,000+ sensors. Contact the sales team
Click here for a free trial.
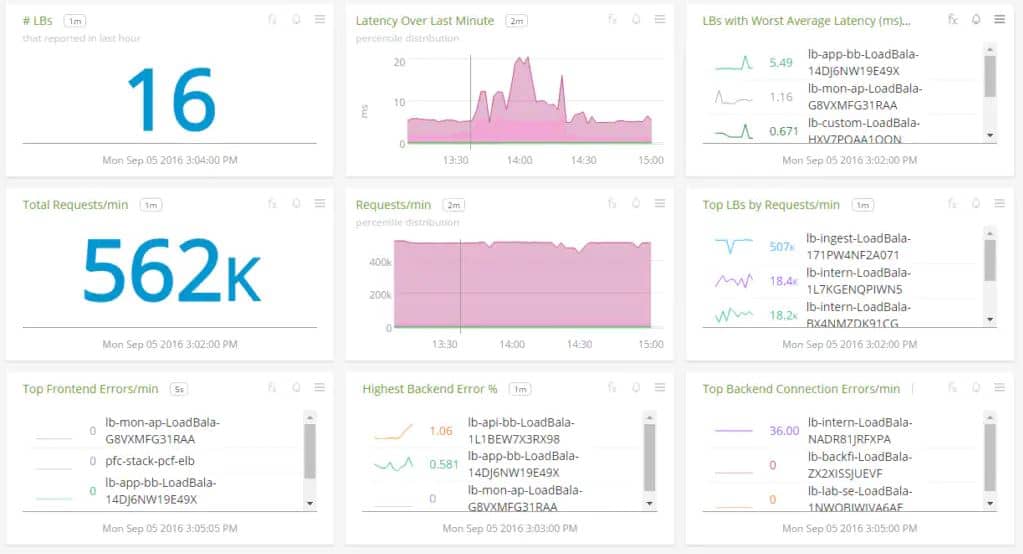
5. Dynatrace
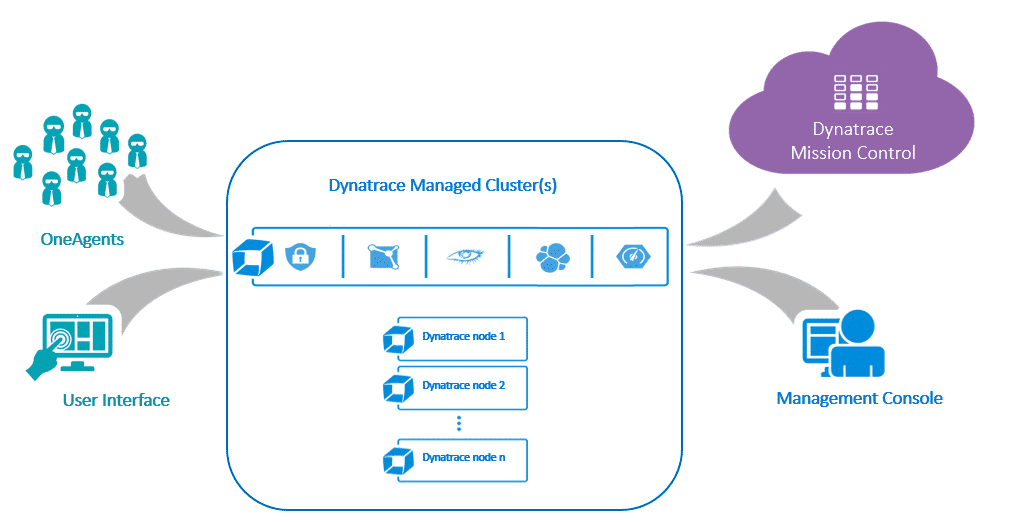
Dynatrace is a unified ELB monitoring system that provides insights into AWS ELB and the entire ecosystem with comprehensive metrics. Source:
Key Features:
- Provides out-of-the-box insights into latency, requests, backend connections, 4xx and 5xx errors, and EC2 failure rate
- Easy to set up and use, as the company claims that the entire monitoring can be up and running in under five minutes
- Its AI automatically discovers your ecosystem and its dependencies
- Detects anomalies and the associated root causes so that you can get to them quickly
- Scales up to 100,000+ hosts to give you high levels of flexibility and scalability when needed
- Can be deployed as pure-SaaS, managed, or on-prem.
- Comprehensive and covers all AWS resources
- Dashboards are intuitive and require no prior technical knowledge to navigate

Why do we recommend it?
Dynatrace is recommended for its unified approach to ELB monitoring, providing quick insights and anomaly detection. Its scalability, ease of setup, and comprehensive coverage of AWS resources make it an efficient tool for monitoring ELB performance.
Who is it recommended for?
Dynatrace is ideal for larger networks and enterprise organizations that require a sleek, customizable interface for real-time LAN and WAN monitoring. It's suited for environments that include virtual and cloud-based infrastructures.
Pros:
- Can secure complicated Azure/hybrid cloud environments with ease
- Sleek, customizable interface
- Real-time LAN and WAN monitoring that supports virtual environments, great for MSPs and large enterprise networks
Cons:
- Dynatrace is more suited for larger networks and enterprise organizations
Dynatrace offers six pricing plans. Below is a snapshot of what each offers.
- Full-stack monitoring that provides full-stack observability for apps, microservices, and infrastructure – $69 per month for an 8-GB host
- Infrastructure monitoring that provides observability for cloud platforms, containers, and data center technologies – $21 per month for an 8-GB host
- Digital experience monitoring that optimizes user experience across mobile, web, hybrid, and IoT applications – $11 per month for 10k digital experience monitoring units
- Application security that provides runtime application vulnerability detection and optimizes applications for cloud and Kubernetes – $10 per month for an 8-GB host
- Open ingestion that extends observability with log monitoring custom metrics and events – $25 per month for 100K Davis Data units
- Cloud automation provides full lifecycle observability, enabling intelligent, risk-free, and faster delivery – Contact for custom pricing
Click here for a free trial.
6. Splunk
Splunk offers comprehensive analytics and visibility into AWS workloads and ELB performance to guide your teams to address issues and leverage the potential of the AWS ecosystem. Source:
Key Features:
- Helps to make sense of the large amounts of data and align it with business goals and strategy
- Prototypes many different use-cases to reduce the time from discovery to value
- Gives insights into cybersecurity aspects in real-time to scale security operations
- Improves compliance to industry standards
- Helps to drive a sector-focused strategy that can lead to high growth
- Connects ecosystems to give you a comprehensive understanding of its performance
- Correlates data across your infrastructure
Why do we recommend it?
Splunk is recommended for its comprehensive analytics and visibility into AWS workloads and ELB performance. Its ability to make sense of large data volumes and align them with business goals enhances the strategic management of AWS resources.

Who is it recommended for?
Splunk is particularly suited for enterprises seeking a tool that can cater to large network environments, offer real-time cybersecurity insights, and improve compliance with industry standards.
Pros:
- Uses excellent visuals to display collected data and insights
- Supports a multitude of environments for data collection
- Uses machine learning to identify new data sources and monitor behavior
- Caters to enterprises with excellent support and a wide range of integrations
Cons:
- Many features and services cater to large enterprise networks
Contact the sales team for a custom quote. Click here for the free version.
7. SumoLogic
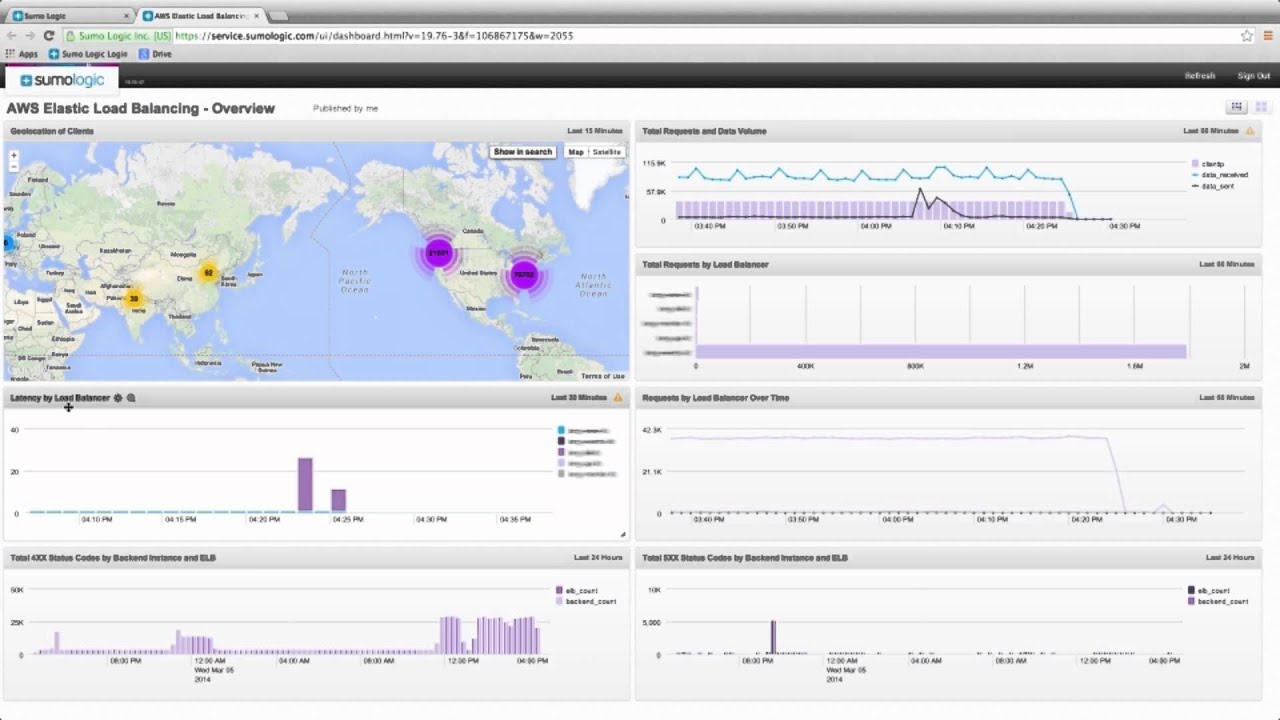
SumoLogic monitors your ELB configuration in real-time and suggests changes to its configuration for optimization.
Key Features:
- Converts raw data from logs into easy-to-understand visual analytics
- Provides deep forensic analysis of log data
- Discovers latency and its underlying cause
- Maximizes ELB capabilities with real-time monitoring
- Improves troubleshooting capabilities
- Optimizes user experience
- Comes with an intuitive UI that makes it easy to understand and navigate
- Offers deep insights into lag, IP traffic patterns, alert codes, and more
- Helps to assess the overall traffic patterns and their associated problems
- Automates events to trigger established thresholds
- Provides proactive analytics and vibrant visualization

Why do we recommend it?
SumoLogic is recommended for its real-time monitoring and optimization of ELB configurations. Its features like converting raw log data into visual analytics, and providing deep forensic analysis make it a powerful tool for ELB performance optimization.
Who is it recommended for?
SumoLogic is well-suited for small to medium-sized businesses looking for a tool with robust alerting and reporting capabilities, and for those who need a user-friendly platform with templates and premade assets.
Pros:
- Flexible and robust alerting and reports
- Supports multiple environments (Linux, Windows, and Mac OS)
- Simple installation – Uses wizards to streamline install and add-ons
- Has a host of templates and premade assets making the experience user friendly
Cons:
- Better suited for small to medium-sized businesses
Sumo Logic offers five pricing plans to suit different users. They are:
- Free
- Essentials – $305 for 3GB
- Enterprise operations – $675 for 5GB
- Enterprise security – $718 for 5GB
- Enterprise suite – $2,408 for 15 GB
Click here to start your free trial.
8. Instana
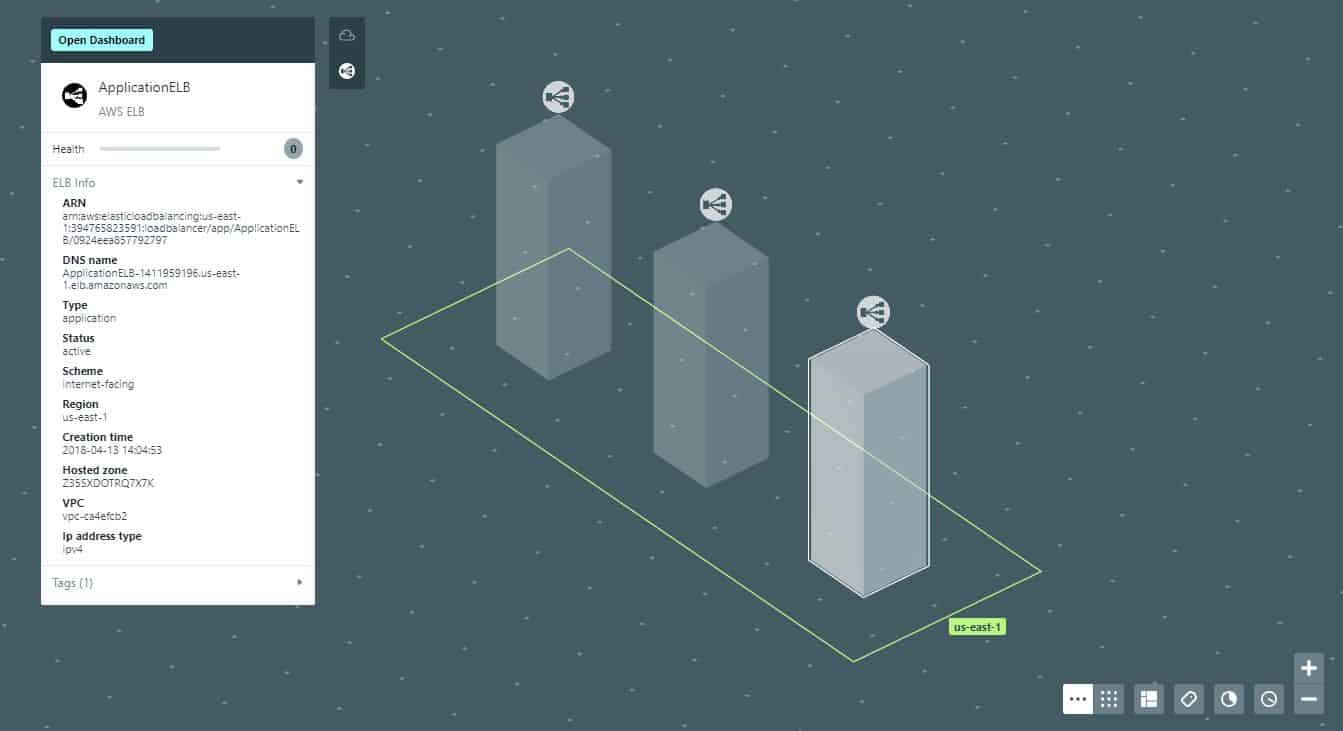
Instana from IBM optimizes application performance and provides a comprehensive view of the working and performance of your AWS ELB.
Key Features:
- Automatically discovers ELB's existing configurations and suggests changes for its optimization
- Maps and visualizes load balancers and service dependencies
- Provides end-to-end tracking of requests
- Offers service and application health monitoring
- Monitors across the entire stack to deliver comprehensive application insights
- Deploys monitoring sensors for tracing applications and requests
- Automatically determines the health of AWS ELB
- Leverages AI to detect issues
- Its monitoring data can be divided into configuration, performance, and health categories to give you a comprehensive idea of the ELB's performance across these areas
Why do we recommend it?
Instana is recommended for its comprehensive approach to application performance optimization and ELB monitoring. Its automatic discovery of ELB configurations, service and application health monitoring, and AI-driven issue detection make it a highly efficient tool for AWS ELB management.
Who is it recommended for?
Instana is ideal for enterprise companies relying on cloud services and looking for a solution to monitor microservices and cloud applications effectively. It's beneficial for teams needing a wide range of integrations and support.
Pros:
- Ideal for monitoring microservices and cloud apps
- Designed with enterprise teams and operations in mind
- Offers a wide variety of integrations and support
Cons:
- Better suited for enterprise companies that rely on cloud services
It starts at $75 per host per month and includes all the features necessary for comprehensive monitoring. Click here for a free trial.
Conclusion
To conclude, AWS ELB is an essential part of every network as it routes traffic intelligently, provides fault tolerance, optimizes the use of resources, and balances the load across servers. Such a critical piece of the tool also requires regular monitoring to ensure that its performance and non-availability don't have a wide-reaching impact across the entire organization.
The tools mentioned above are market leaders in AWS ELB monitoring and can offer comprehensive insights into the health and performance of your ELB at all times. In addition, some of these tools extend the tracking across the entire AWS stack to provide a comprehensive understanding of your overall infrastructure and ecosystem.


