
The Microsoft Exchange Server, developed by Microsoft as a mail and calendaring server, is a collection of applications primarily enabling the configuration of host email and collaboration services within an organization IT environment, protecting the data of organizations across the world through the provision of secure email software and integrating itself as a critical infrastructure in all organizations using it as their primary method of communication in their workplaces.
Here is our list of the best Exchange Server monitoring tools:
- ManageEngine Exchange Reporter Plus – EDITOR'S CHOICE An auditing and monitoring system for Exchange Server and Outlook that includes security logging. Installs on Windows Server. Start a 30-day free trial.
- ManageEngine OpManager – FREE TRIAL A network monitoring tool that is able to identify activity generated by Exchange Server and improve performance. Available for Windows Server and Linux. Get a 30-day free trial.
- Site24x7 – FREE TRIAL A monitoring service that includes Exchange Server oversight within a broader full-stack platform and also provides system management functions. Get a 30-day free trial.
- Paessler PRTG Network Monitor – FREE TRIAL This package of monitoring tools covers networks, servers, and applications, including Exchange Server. Runs on Windows Server. Get a 30-day free trial.
- Quest Foglight for Exchange This specialized monitoring system for Exchange includes system tuning facilities to improve performance. Runs on Windows, Windows Server, and Linux.
- Nagios Exchange Monitoring Tool A package of monitors for networks, servers, and applications that includes Exchange monitoring. Runs on Linux or on Windows over a hypervisor.
- SolarWinds Server & Application Monitor This on-premises package tracks the activity of applications, including Exchange Server, and measures the resources that they use.
- Netwrix Auditor for Exchange Monitors on-premises or cloud implementations of Exchange Server. Available for Windows and Windows Server.
Popular and widely used, Microsoft Exchange is available solely for Windows Server operating systems as either hosted or cloud services, and while the Microsoft Exchange Server is installed on a Windows Server operating system, providing services and features related to the server side of Microsoft Exchange, Microsoft Exchange Client is installed at client nodes, with inbound emails first received at the Exchange Server before being routed to their destination clients.
With a built in safety belt, a mechanism named back pressure, Microsoft Exchange will either slow down or stop certain services to prevent its collapse when it senses performance deterioration, providing it meets certain thresholds, with the aim of the continuous, uninterrupted running of Microsoft Exchange so as not to negatively impact the user experience, productivity and workflow within an organization.
The monitoring of Microsoft Exchange becomes vital in this aspect, as does the use of additional tools and software to achieve this, particularly as there is constant modification in Microsoft Exchange environments due to the frequency of updates in an organization, with larger organizations easily recording thousands of events in a single week.

The tools and software designed for this task allow for the automatic tracking and monitoring of all Microsoft Exchange activities, which would otherwise be implausible due to its complexity, enabling administrators to take proactive steps to ensure the Microsoft Exchange Server is in good health, available and performing properly.
These tools and software further allow for the easier identification of issues before they become a problem, potentially taking the Microsoft Exchange Server down, thereby creating an unknown extent of financial loss, through the overseeing of the operational parameters of Microsoft Exchange, running of tests to ensure all emails are correctly handled as well as a wide range of other tests, sending alerts when vulnerabilities are detected and if anything falls out of its normal range.
The data collected is usually stored in a database, used for the building of operational dashboards presented in user-friendly interfaces, to gain understanding of the Microsoft Exchange Server through the provision of a clear overview of the evolution of Microsoft Exchange Server parameters monitored, further generating periodic reports which aid in the troubleshooting of individual components and problematic performance, allowing for the more efficient resolving of issues arising, saving both time and money.
Therefore, in the case of managing and troubleshooting Microsoft Exchange and keeping data secure, the use of Microsoft Exchange diagnostic tools and software notably simplify and speed up the process, and we have gathered the best diagnostic tools and software for your perusal, detailing their capabilities and strengths, with download links and pricing structures listed beneath each tool.
The Best Exchange Server Monitoring Tools
Our methodology for selecting Exchange server monitoring tools and software
We reviewed various Exchange server monitoring tools and analyzed the options based on the following criteria:
- Support for various alerting and reporting capabilities
- Support for various Exchange environments
- A facility to analyze Exchange performance over time
- Graphical interpretation of data, such as charts and graphs
- A free trial period, a demo, or a money-back guarantee for no-risk assessment
- A good price that reflects value for money when compared to the functions offered
1. ManageEngine Exchange Reporter Plus – FREE TRIAL
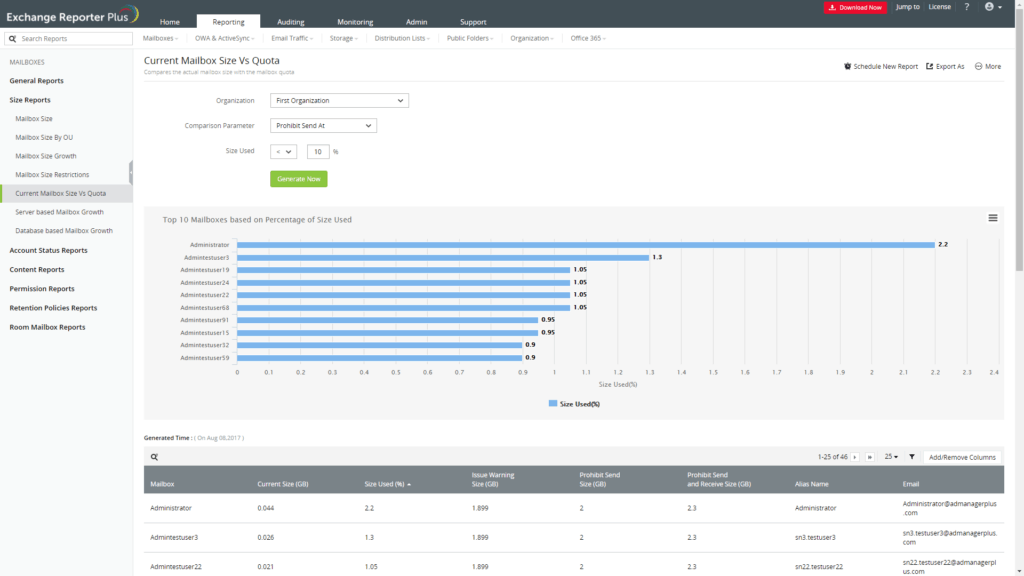
ManageEngine Reporter Plus is a web-based reporting and analysis solution for Microsoft Exchange, providing over 100 reports on each aspect of the server environment, thereby equipping administrators with precise, detailed and actionable data, and its comprehensive dashboard shows summaries of alerts count,with those most recent and their severity, critical servers and databases, the top ten servers utilizing the CPU and memory and more.
Key Features:
- Over 100 detailed reports
- Real-time alerts
- Comprehensive Exchange monitoring
- Mail traffic analysis
Why do we recommend it?
We recommend ManageEngine Exchange Reporter Plus for its extensive reporting capabilities and real-time alert system. It provides critical insights into Exchange servers, databases, and user mail activities.
It presents all of the automatically collected information in graph format through a single window, with the option of auditing all Microsoft Exchange event logs, assisting administrators in sourcing relevant data monitored by ManageEngine Reporter Plus easier and quicker for the identification of overall Microsoft Exchange server health, and its real-time alerts of changes occurring within your organization further allows for preemptive actions for the prevention of and the troubleshooting of issues arising.
ManageEngine Reporter Plus covers three vital components of Microsoft Exchange, its servers, databases and database availability groups, further monitoring client access roles such as IMAP, POP, web service and ECP connectively, producing data on uptime and average latency, as well as mailboxes roles, monitoring mail flow health, and other Microsoft Exchange roles such as HUB, UM Roles amongst others, all of which can be analyzed by administrators for the recording of the respective downtime for each service with statistics of Exchange Server Public Folders viewable in thorough report formats.
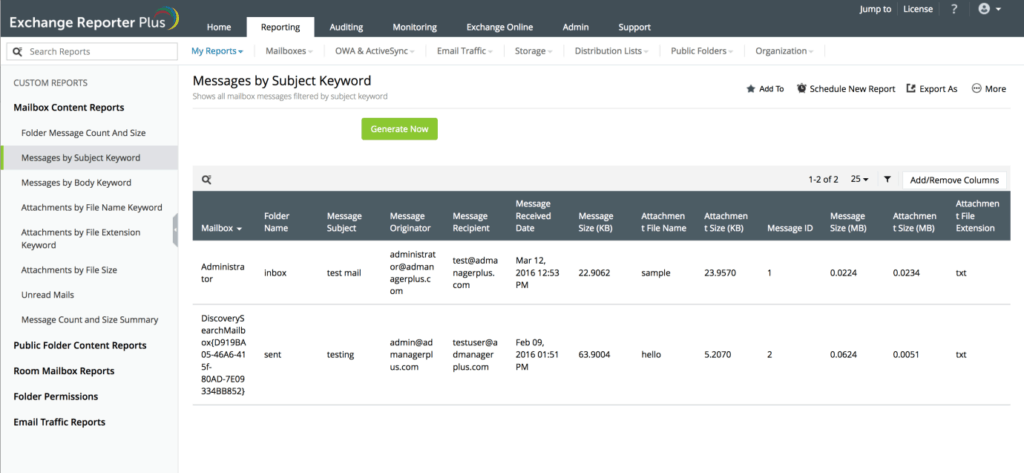
You can also gain insight into mailbox sizes and growth, easily comparing the data against quota limits, viewing precise data on inactive and active mailboxes, tracking incoming and outgoing emails as well as their content through the filter set up by ManageEngine Reporter Plus.
This allows for the tracing of content via keywords, mail attachment properties, folder properties and more, while taking it a step further in the ability to filter web access and activity data by user, browser and client IP address, amongst others, and the utilization of Microsoft Exchange traffic analysis allows the traffic to each mailbox to be monitored and filtered, with reports for distribution lists generated.
Who is it recommended for?
This tool is best suited for administrators who require detailed, actionable data on their Microsoft Exchange environment, including server performance, database health, and user mail activities.
Pros:
- Offers on-premise and cloud deployment options, giving companies more choices for install
- Can highlight interdependencies between applications to map out how performance issues can impact businesses operations
- Offers log monitoring to track metrics like memory usage, disk IO, and cache status, providing a holistic view into your database health
- Can automatically detect new exchange servers and provide live exchange metrics
Cons:
- Can take time to fully explore all features and options available
Pricing for ManageEngine Reporter Plus starts at $345.00 for 100 mailboxes under the standard version or $595.00 for 100 mailboxes under the professional version. You can download a 30-day free trial which automatically reverts to a free version, limited to 25 mailboxes, once the trial ends unless the standard or professional versions of the software are bought.
EDITOR'S CHOICE
ManageEngine Exchange Reporter Plus is our top pick for Exchange Server monitoring because it gives administrators live visibility into message flow, server uptime, database health, and storage use across Microsoft Exchange environments. ManageEngine Exchange Reporter Plus also tracks email activity in detail, including message volume, delivery timing, and sender-recipient patterns, which helps teams investigate delays and identify developing bottlenecks. Its reporting tools add further value by supporting compliance checks, trend analysis, and faster troubleshooting, while real-time alerts surface downtime and unusual mail flow as soon as they occur. The dashboard makes daily monitoring easier, and longer-term resource tracking helps teams plan for storage growth and future performance needs.
Download: Get a 30-day FREE Trial
Official Site: https://www.manageengine.com/products/exchange-reports/download.html
OS: Windows Server
2. ManageEngine OpManager – FREE TRIAL
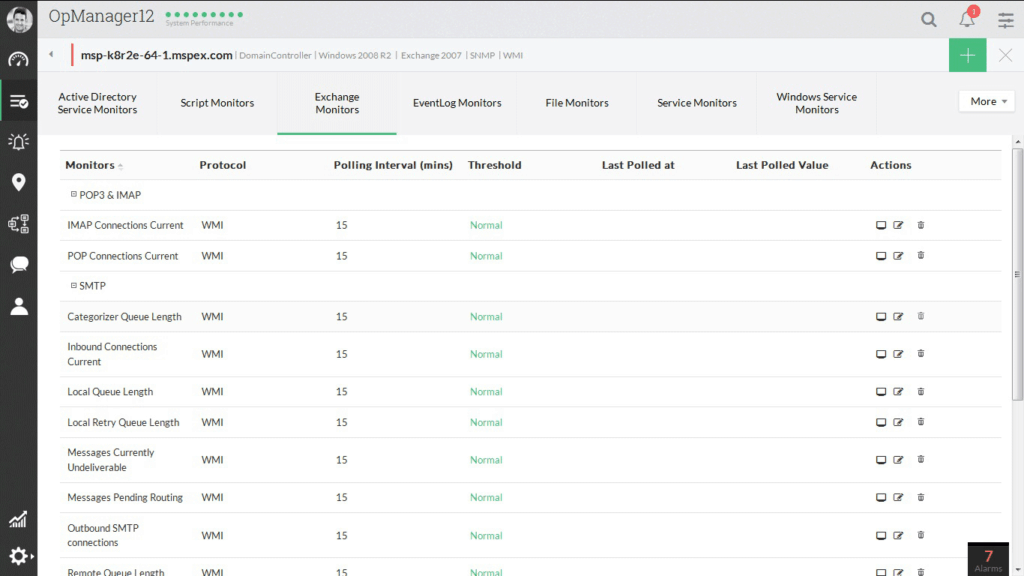
ManageEngine OpManager is a complete network monitoring tool with auto-discovery and Microsoft Exchange capabilities built into it, including more than sixty critical parameters needing to be monitored, several of which are provided with pre-configured thresholds, which can be used as a starting point and fine tuned later to the baseline values in your particular organization, and also comes with pre-built reporting formats as well as supporting customized reports on data collected.
Key Features:
- Pre-configured monitoring thresholds
- Advanced alerting system
- Mobile app accessibility
- Mailbox performance monitoring
Why do we recommend it?
ManageEngine OpManager is recommended for its comprehensive monitoring features, including pre-configured thresholds and an advanced alerting system. The mobile app enhances accessibility for administrators.
Its advanced alerting system notifies you instantly if anything falls out of its normal operating range, allowing administrators to quickly identify potential or existing problems, points of failure, troubleshoot and resolve them, ideally preventing and at the very least limiting down time, and further assists in this aspect with the option of navigating its user friendly dashboard, which shows the overall health of Microsoft Exchange and its individual components, through mobile apps on smart phones and tablets, giving quick access to the state of Microsoft Exchange from anywhere, at any time of the day.

In the aim of increasing performance, the ManageEngine OpManager monitors mailbox performance counters, overseeing active and inactive mailboxes, removing the latter, in an effort to ensure database storage capacity is kept within its limits while also notifying you of the detection of the imminent failure of Microsoft Exchange through its monitoring of queues and connections, assisting in the identification of bottlenecks, possible spam attacks or the failure of Microsoft Exchange to close connections, stifling the performance of Microsoft Exchange and causing unwanted disruptions to communication within an organization.
In order to further simplify and speed up troubleshooting, it can examine outlook connectivity, such as number of requests per second, average response time as well as streamlining all voice messages and emails into a single mailbox for easier viewing, while producing a list detailing the status copies of all servers and databases in the database availability group, and in the effort of providing better security against spam and viruses,it monitors scan time, scan requests rejected, blocked recipients and more.
Who is it recommended for?
It's ideal for network administrators who need a robust tool for monitoring Microsoft Exchange servers, focusing on mailbox performance and proactive issue resolution.
Pros:
- Supports a freeware version
- Uses both SNMP and NetFlow for monitoring giving it more coverage options than other tools
- Can scale easily, Enterprise package supports up to 10,000 endpoints
- Utilizes automatic network discovery to create live inventories and network maps for administrators to track assets and network size
- Viable for both large and small networks
Cons:
- OpManager is dense with features, integrations, and settings, and may take time to fully learn
You can examine the platform with a 30-day free trial.
3. Site24x7 – FREE TRIAL
Site24x7 places Exchange monitoring inside its wider observability platform instead of presenting it as a separate tool. That gives administrators a way to assess Exchange performance in relation to the surrounding infrastructure rather than viewing it on its own. Site24x7 tracks message flow, server availability, disk usage, processor load, and memory consumption, providing a current picture of how the Exchange environment is performing under load.
Key Features:
- Observes core Exchange Server performance indicators
- Tracks availability, mail flow, processor demand, memory use, and disk consumption
- Shows delivery delays, message queue conditions, and timing issues
- Follows both inbound and outbound mail activity
Why do we recommend it?
Site24x7 is recommended for the way it supports early fault detection across the Exchange environment. It keeps Exchange services and related processes under continuous observation, allowing the platform to generate alerts when behavior starts to move away from normal operating conditions. That gives administrators time to intervene before declining service becomes a wider communication failure. Instead of waiting for user complaints, teams can act on warning signs that appear during the earlier stages of a problem.
The reporting functions add more depth than live monitoring alone. Administrators can examine present conditions or use historical records to look for longer-term trends, repeated failures, and signs of growing strain. Reports can focus on specific measurements or be used to judge the overall condition of the Exchange environment. That makes the service useful not only for immediate troubleshooting but also for identifying recurring weaknesses and supporting operational planning.

Mail flow monitoring is another important part of the package. Incoming and outgoing traffic is tracked continuously, bringing delays, stalled delivery, and undelivered messages into view. That makes it easier to pinpoint delivery slowdowns and determine where the messaging path is failing. Because this activity is exposed directly, administrators can move from symptom to cause more quickly when email performance becomes inconsistent.
The wider Site24x7 platform also strengthens the value of its Exchange monitoring. Because the service already includes network and infrastructure monitoring, Exchange can be assessed alongside the servers, databases, and supporting components around it. That broader correlation improves troubleshooting and gives teams a stronger basis for root cause analysis.
Who is it recommended for?
This package is most useful in Exchange environments that are not simple or static, particularly where multiple mail servers are involved or where on-premises and cloud-based elements coexist. Organizations that depend on continuous availability and need to reduce the operational risk of mail disruption will get the most value from it.
Pros:
- Exposes bottlenecks and undelivered mail quickly
- Supports immediate alerting for abnormal Exchange behavior
- Highlights outages and performance decline early
- Tracks Exchange services and supporting processes continuously
Cons:
- Covers on-premises Exchange Server in more depth than Microsoft 365
Site24x7 is delivered as a cloud service through multiple editions. What changes between those plans is mainly the level of module capacity included in each one. Entry tiers are sized for very small businesses, while larger environments require higher-capacity plans at higher prices. Infrastructure Monitoring starts at $9 per month, and the managed service provider edition starts at $35 per month. The full Site24x7 platform can be tested through a 30-day free trial.
4. Paessler PRTG Network Monitor – FREE TRIAL
The Paessler PRTG Network Monitor is an integrated network monitoring solution that monitors your entire IT infrastructure, including a number of dedicated, pre-configured sensors for the monitoring of a Microsoft Exchange server in its features, which are created automatically during the installation and Auto Discovery process, all with the core aim of avoiding delays, malfunctions in exchange and the potential loss of information which can be a costly occurrence.
Key Features:
- Customizable Microsoft Exchange sensors
- Continuous server monitoring
- Variety of alert mediums
- Comprehensive mail server testing
Why do we recommend it?
Paessler PRTG Network Monitor is recommended for its tailored Microsoft Exchange monitoring capabilities, offering a variety of customizable sensors and continuous server performance tracking.
With the additional provision of optional sensors which can be added to the Microsoft Exchange server a few clicks away, the setting up of Microsoft Exchange monitoring becomes simple and quick, and its user friendly dashboard displays all the data collected in an organized, detailed manner, further assisting administrators in the faster and smarter identification of server issues as well as the of overall health of the Microsoft Exchange server.
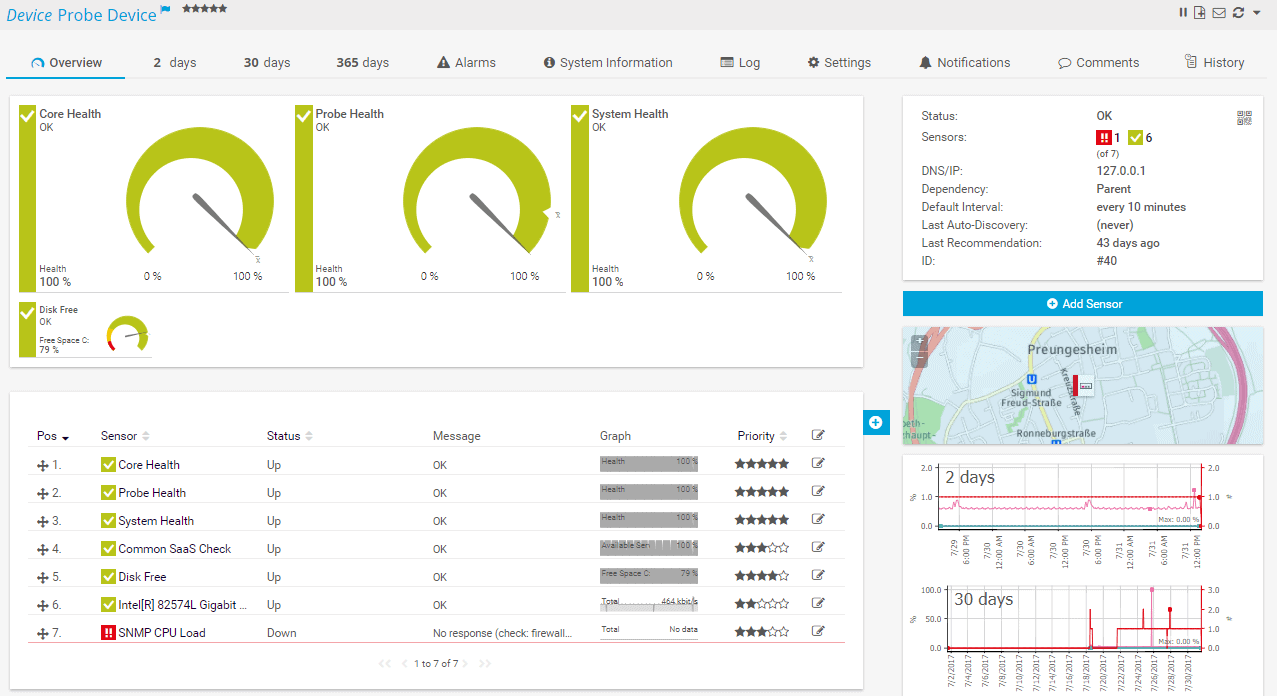
The Paessler PRTG Network Monitor continuously monitors the Microsoft Exchange server performance and availability, its database capacity, load and traffic patterns, and ensures emails are delivered in a timely manner, without interruption.
It will automatically alert you, by either email, SMS or push notification in the app, if the mail server is down or if there are identified performance issues, which allows for the prompt and proactive reaction to any potential disturbances.
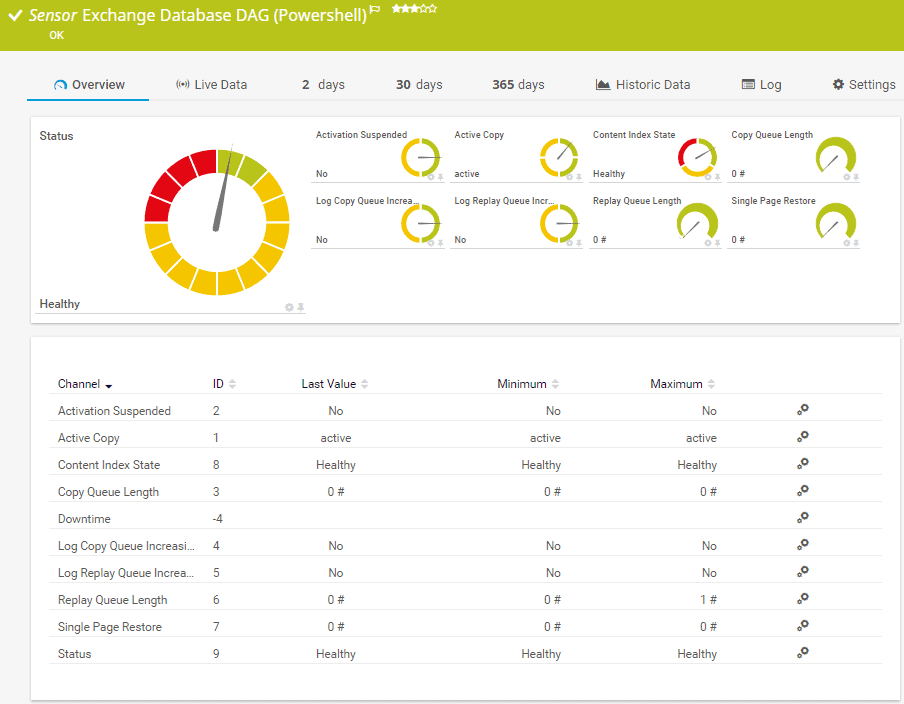
One of the goals of the Paessler PRTG Network Monitor is to ensure its monitoring capabilities fit to your specific needs and it does this with its PowerShell sensors, each addressing a specific aspect of Microsoft Exchange monitoring, allowing for the complete customization and adaption of monitoring to your specific hardware, with the option of further tailoring monitoring with WMI.
The multiple sensors supplied by the Paessler PRTG Network Monitor cover the monitoring of mailbox sizes, logins and latest emails, the status of database availability groups, the number of emails in the mail queue at any given time, the Microsoft Exchange server’s public folders, including their size and access amongst other data, the response time of SMTP and IMAP servers, end-to-end delivery of emails and the availability of email servers, all while verifying that backups of all data are conducted at scheduled intervals to reduce the risk of information loss.
Who is it recommended for?
This tool is suitable for IT professionals seeking a versatile monitoring solution for Microsoft Exchange servers, focusing on performance, database capacity, and mail flow health.
Pros:
- Uses a combination of packet sniffing, WMI, and SNMP to report network performance as well as discover new devices
- Autodiscovery reflects the latest inventory changes almost instantaneously
- Drag and drop editor makes it easy to build custom views and reports
- Supports a wide range of alert mediums such as SMS, email, and third-party integration
- Supports a freeware version
Cons:
- Is a very comprehensive platform with many features and moving parts that require time to learn
The pricing structure starts at $1600.00 for 500 sensors and one server installation. You can download a 30-day free trial which automatically reverts to the free version after the trial ends unless a license is purchased.
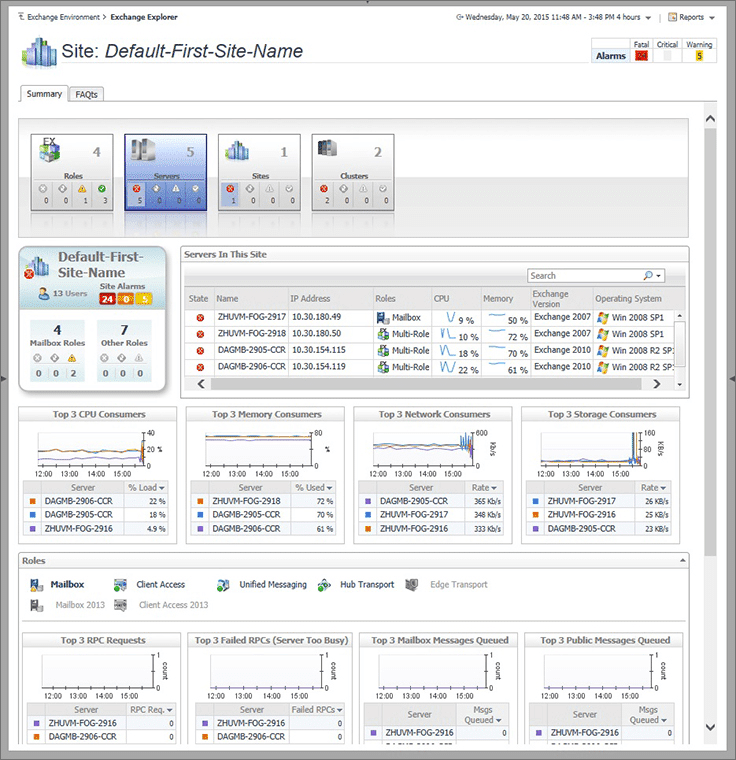
5. Foglight for Exchange
Foglight for Exchange is a dedicated Microsoft Exchange monitoring tool, created by Quest, and its consolidated, logically laid out and architectural representations make the detection, diagnosing and resolving of Microsoft Exchange problems across physical, virtual and cloud environments go quicker and easier, with its reports aiming for the monitoring of service levels from a business perspective, allowing for the focus of administrators to be spent more on ensuring performance and high availability, with less time needed for the troubleshooting of issues.
Key Features:
- Architectural representations
- SLA and diagnostic reporting
- Office 365 monitoring
- Advanced permission controls
Why do we recommend it?
Foglight for Exchange is recommended for its ability to simplify the detection and diagnosis of Exchange issues. Its detailed reports and Office 365 monitoring capabilities make it a valuable tool for Exchange server management.
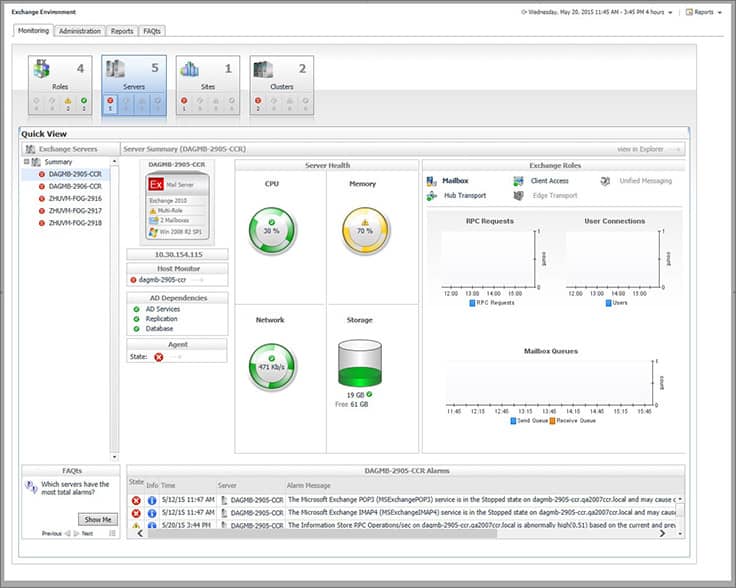
The intuitive dashboard of Foglight for Exchange shows critical load areas, any abnormal flows of data as well as top consumers of resources across Microsoft Exchange, further allowing you to view the different components in Microsoft Exchange and understand their relationships, resource sharing in clustered Microsoft Exchange servers, and provides the ability to isolate components on virtual infrastructure, troubleshooting issues found directly in the virtualization layer, all with the overall aim of simplifying the resolving of all potential issues and ensuring optimal server performance and health.
Office 365 monitoring is also made available in the 5.7 release of Foglight for Exchange, enabling on-premises authentication monitoring as well as cloud-based mailboxes through its interface, gaining insight while retaining all historical data and visibility, and the advanced permission controls of Foglight for Exchange make the setting of specific, role-based user access to certain parts of the software fast and convenient.
A drag-and-drop tool, unique to Foglight for Exchange, easily produces both ad hoc and scheduled, automated reports, such as SLA, diagnostic and availability reports, which yield more detailed and effective troubleshooting capabilities, with built-in customizable alerts, notifying you of issues, deviations, performance and operational problems, while also optionally highlighting best practices.
Who is it recommended for?
It’s best suited for administrators managing Exchange servers across physical, virtual, and cloud environments, with a focus on ensuring high performance and availability.
Pros:
- Built specifically for monitoring only Exchange servers
- Can quickly provide a health report of Exchange services, mailboxes, and resource consumption
- Can support cloud-based mailboxes alongside on-premise deployments
- Supports proactive monitoring and SLA reports
Cons:
- The interface could use improvement
Price Information: Quotes on pricing for Foglight Exchange can be requested here.
Download: You can download a free 30-day trial here
6. Nagios Exchange Monitoring Tool
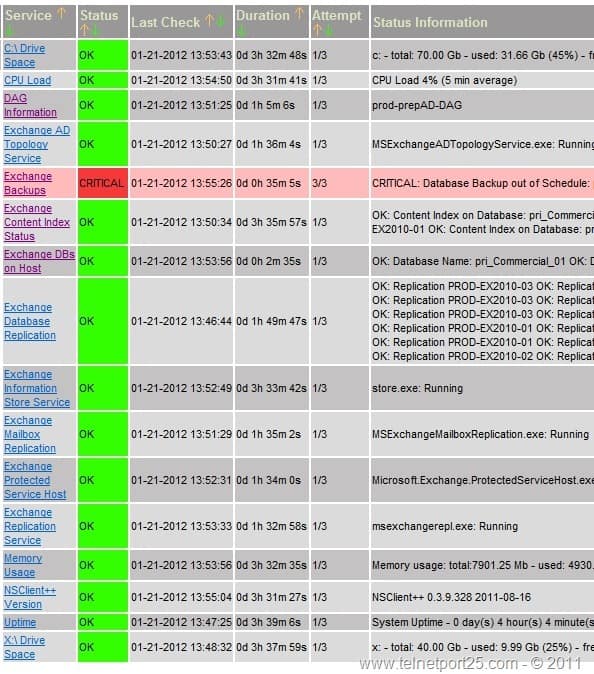
The Nagios Exchange Monitoring Tool comprehensively monitors Microsoft Exchange servers with the aim of achieving increased server, services and application availability, with faster detection of network outages, protocol failures, potential email server failures as well as delays which could significantly impact the performance of Microsoft Exchange, doing this through its effective monitoring of mail servers and email, producing Microsoft Exchange server and mail server statistics, which aids in the troubleshooting of issues arising, and keeping a close eye on message count, the ability to send and receive emails within the organization and ensuring emails are delivered to their destinations successfully.
Key Features:
- Comprehensive server monitoring
- Real-time notifications
- Customizable reporting tools
- Spam blacklist monitoring
Why do we recommend it?
Nagios Exchange Monitoring Tool is recommended for its thorough monitoring capabilities, providing detailed server and mail server statistics, and effective spam blacklist monitoring.

Notifications will automatically be sent you by the Nagios Exchange Monitoring Tool if it identifies that any of the parameters set are off their threshold limits and it provides the ability to test the full operation on an email server by sending an email to an SMTP server, polling an IMAP folder for reception, which is particularly useful for evaluating the effectiveness of spam filtering, further monitoring for whether any mail servers are on a real-time spam blacklist (RBL) or not, thereby staying on top of Microsoft Exchange performance and providing advanced reporting tools, which can create reports customized to your needs, assisting with the overall viewing of Microsoft Exchange server health as well as both potential and existing issues.
Who is it recommended for?
This tool is ideal for organizations looking for an open-source, comprehensive monitoring solution for Microsoft Exchange servers, focusing on server availability and email deliverability.
Pros:
- Is open-source and completely free, with a paid option for enterprises
- Supports autodiscovery for easy device management
- Highly customizable and detailed dashboard
Cons:
- Network mapping visualizations need improvement
- Not nearly as comprehensive as some of our top choices
- Must pay extra for support
Pricing starts at $1995.00 for the standard edition and can be viewed here. You can download a fully functional 60 day trial here.
7. SolarWinds Server & Application Monitor
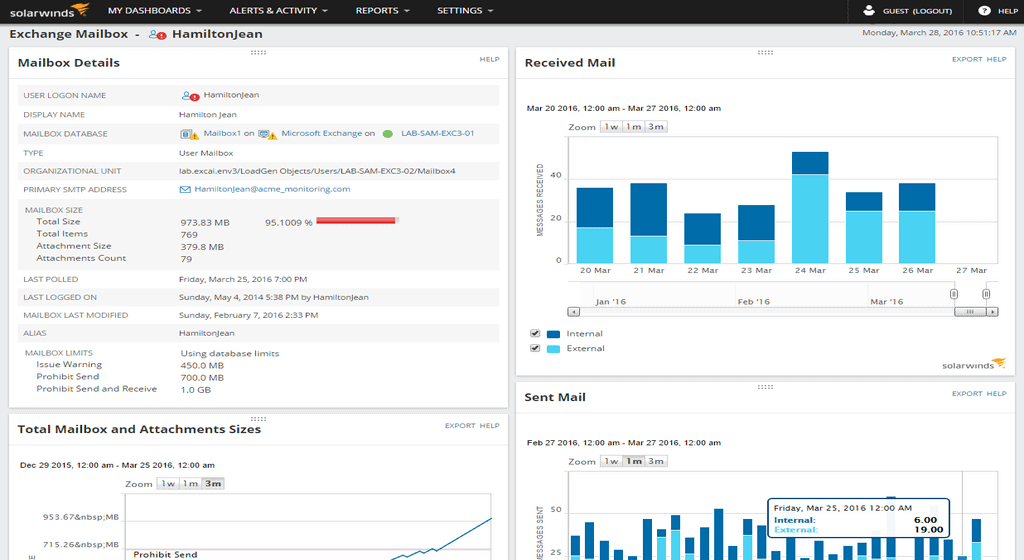
The SolarWinds Server & Application Monitor, while a generic monitoring tool supporting both physical and virtual servers, provides advanced Microsoft Exchange monitoring features, and is an ideal tool for troubleshooting a Microsoft Exchange server as it offers the ability to comprehensively investigate issues, with its dashboard designed to show a detailed overview of your entire IT infrastructure as well as individual components affecting Microsoft Exchange, and it scales seamlessly from small networks to larger networks with numerous servers spread over multiple sites.
Key Features:
- Advanced Exchange monitoring
- Customizable user interface
- Mailbox database capacity planning
- Forecast storage metrics
Why do we recommend it?
SolarWinds Server & Application Monitor is recommended for its specialized Microsoft Exchange monitoring capabilities. It offers comprehensive issue investigation tools and customizable dashboards for both real-time and historical data analysis.
SolarWinds Server & Application Monitor’s powerful auto-discovery process enables its set up to be simple, with its user interface customizable to show data and stats automatically collected in either a graph or table format, showing both historical and real-time performance, with alerts sent out for any issues detected for the faster troubleshooting of Microsoft Exchange, while also detailing the operational parameters of the Microsoft Exchange server, easing the overall monitoring of its performance and health.

Mailbox database capacity planning is made possible by using the data collected through alerts on free space, database use, size of transaction logs and the average mailbox, and determining the overall capacity constraints, with the option of drilling into individual mailboxes to source potential issues, such as the need to relocate a particular mailbox to a separate database to load balance capacity.
In the aim of further optimizing Microsoft Exchange server performance, the use of forecast storage metrics, made up of both past and current data, can be used in the process of pinpointing, troubleshooting root causes to volume capacity or IOPS, before storage issues identified potentially make the storage of additional emails impossible due to the lack of available disk space, or performance issues arise due to high latency. Automated alerts on abnormal queues of hub transport messages, compared against baseline thresholds set, are also available for immediate or advance action, before Microsoft Exchange stops working, interrupting workflow within an organization.
For the even faster identification and troubleshooting of a specific user’s mailbox issues, the Users By % Mailbox Quota Used widget in the SolarWinds Server & Application Monitor allows administrators to type a user’s name into a search bar, retrieving the size and number of mailbox attachments, synced devices and sent/ received mail trends of the user, potentially indicating a spam issue with the user’s account, which aids in the effective resolution of issues.
Who is it recommended for?
This tool is ideal for IT professionals managing both physical and virtual servers, especially those who need detailed insights into Microsoft Exchange server performance and health.
Pros:
- Offers “done for you” dashboards, monitors, and templates designed for your environment
- Provides live monitoring through its agentless architecture
Cons:
- SolarWinds SAM is a feature-rich enterprise tool that can take time to fully explore
Start a 30-day free trial.
8. Netwrix Auditor for Exchange
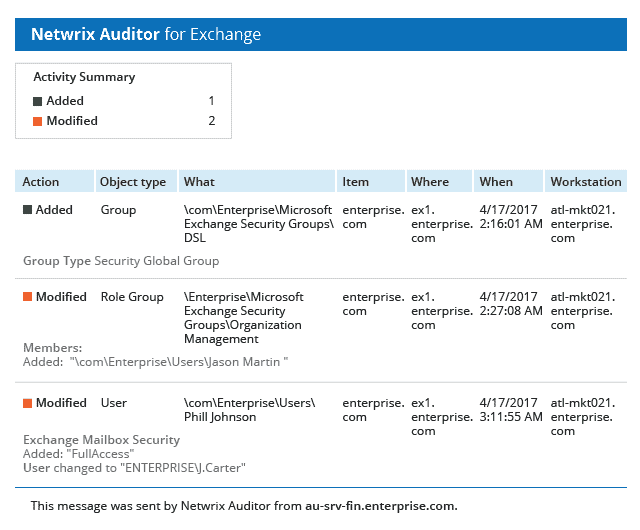
Netwrix Auditor for Exchange is a complete Microsoft Exchange reporting solution and monitoring tool, one piece of the Netwrix unified auditor platform, providing the ability for constant, effective and automated monitoring of all exchange infrastructure, giving better control over mailbox access through its support of granular access control, allowing for permission-based access to particular individuals, while storing a complete audit trail, assisting in historical verification and analysis, which combined with its interactive search feature aids in the quick identification and diagnoses of root causes of problems, with its compliance reports offered mapped to regulatory compliance standards.
Key Features:
- Granular access control
- Detailed auditing and reporting
- Non-owner mailbox access monitoring
- Data discovery and classification
Why do we recommend it?
Netwrix Auditor for Exchange is recommended for its in-depth auditing and reporting capabilities. It excels in maintaining a secure Exchange environment by monitoring mailbox access and sensitive data handling.
Alerts are immediately sent when parameters go past threshold limits and Netwrix Auditor for Exchange further notifies you of any suspicious activities, providing actionable data on each critical event in the Microsoft Exchange server, such as modifications to transport rules, mailboxes databases and permission changes to Exchange mailbox, with the addition of extensive investigation abilities into changes made, allowing for the fast identification and reversion of unwanted modifications, ensuring that mail flow and organization operations are not affected or halted.
With regards to data sensitivity and the guarding of critical work information relayed via and contained in emails within an organization, the ability to keep close tabs on each non-owner access attempt becomes vital, and Netwrix Auditor for Exchange assists in this task by allowing you to view who accessed which mailbox, the timing of access and which workstation was used, providing further crucial details on which specific items were viewed, edited or deleted, with the aim of preventing the occurrence of a data breach due to unauthorized activity through its comprehensive investigation and alerting capabilities.
Through its additional ability to perform data discovery and classification in all mailboxes, sensitive information and attachments can be revealed, helping administrators to ensure that no critical information is stored in shared mailboxes or sent to unauthorized users, while also identifying and alerting you of traces criminal activities found.

Who is it recommended for?
It’s recommended for administrators who need a robust tool for Exchange server auditing, focused on security, compliance, and preventing unauthorized access to sensitive information.
Pros:
- Offers detailed auditing and reporting that helps maintain chain of custody for sensitive files
- Offers hardware and device monitoring to track device health alongside security
- Allows sysadmin to implement automated remediation via scripts
- Integrates with popular help desk platforms for automatic ticket creation
Cons:
- The trial could be a bit longer for testing
For pricing and licensing you can request a quote here. You can download a 20-day free trial or request/ launch an in-browser demo here.
Conclusion
With the constant demand for communication to be free flowing within organizations, the effective and continuous monitoring and managing of Microsoft Exchange has become a necessity, with the use of additional tools and software significantly influencing the process, aiding in the early detection of security threats, potential performance issues and the troubleshooting of deviations found, ensuring sensitive data is kept protected and the Microsoft Exchange server is always up and running, avoiding disruptions to workflow as well as financial loss due to down time.
The different types of software offered and their value to organizations will alter dependent on the size and nature of organizations as well as the costs involved, but the underlying and essential need for additional tools and software to monitor Microsoft Exchange across organizations cannot be dismissed due to its complex and ever-changing environment, and we hope the information gathered here helps in choosing the best solution to suit your particular needs.
Exchange Server Monitoring Software FAQs
Can Exchange server monitoring be automated?
Yes, Exchange server monitoring can be automated using tools that automate monitoring and alerting processes.
What are some best practices for Exchange server monitoring?
Best practices for Exchange server monitoring include establishing a monitoring plan, using a centralized monitoring platform, setting up alerts and notifications, performing regular maintenance and updates, and analyzing data to identify trends and potential issues.
What types of information can be collected by an Exchange server monitoring tool?
An Exchange server monitoring tool can collect information about server performance, email queue lengths, message delivery status, mailbox size, and other metrics related to Exchange server performance.
What are some common Exchange server monitoring tools?
Common Exchange server monitoring tools include SolarWinds Server & Application Monitor, ManageEngine Exchange Health Monitor, and Microsoft System Center Operations Manager.
How can an Exchange server monitoring tool help me troubleshoot email communication issues?
An Exchange server monitoring tool can help you troubleshoot email communication issues by providing insights into message delivery status, mailbox size, and other metrics related to email communication.


