
Today we're going to jump into finding the Best Hyper-V Monitoring Software & Tools to ensure your virtualized environment is fully monitored. Virtualization is a critically important aspect of modern businesses. Information Technology systems have made the move away from physical systems to virtual ones.
Here is our list of the best Hyper-V Monitoring tools:
- ManageEngine OpManager – EDITOR'S CHOICE A network and server monitor that is well-placed to examine the complexities of virtualizations and has a specialized screen for Hyper-V monitoring. Available for Windows Server and Linux. Download a 30-day free trial.
- Paessler PRTG – FREE TRIAL A collection of network, server, and application monitoring tools that includes a section from monitoring Hyper-V implementations. Runs on Windows Server. Download a 30-day free trial.
- Site24x7 Infrastructure – FREE TRIAL A server and application monitoring system that includes a special integration for Hyper-V systems. This is a cloud-based platform. Access a 30-day free trial.
- Datadog Infrastructure This cloud-based monitoring platform can track the issues of virtual systems, including Hyper-V, and the physical servers that support them.
- Dynatrace A cloud-based infrastructure monitoring service that exposes the full support stack of Hyper-V implementations.
- SolarWinds Virtualization Manager A monitoring and management system for a range of virtualization brands, including Hyper-V.
- LogicMonitor A cloud-based infrastructure monitor that will automatically discover and map your Hyper-V VM allocations and the resources that support the entire system.
- Veeam ONE Free An excellent, free community-supported monitor that can track the performance of vSphere and Hyper-V implementations. Runs on Windows.
Part of these reasons have to do with cost, and others to do with redundancy and convenience. There are plenty of other benefits too, which we will go into while looking at some of these applications. Most people are familiar with VMware as a virtualization platform as it is certainly one of the most popular platforms, but we will be looking at Microsoft’s offering: Hyper-V.
Decide on the features you need
While there are many built in features and reporting tools that you can tap into with Hyper-V by default. Many IT professionals find that using a third-party tool and monitoring solution adds extra functionality to the platform. This is especially useful if you need to generate reports for management regarding resource allocation and headroom.
Perhaps you need to report on performance and activity monitors to show how traffic is being generated and allocated to each virtual host. Being able to dynamically allocate resources while keeping an eye on the organizational thresholds of your company’s available resources is critical if you are in a systems capacity or planning role.
What are your requirements?
Whatever your requirements, you are more likely to find the features that you are looking for when you are using a third-party application or software solution. Not many people realize how important the reporting and information side of Hyper-V monitoring is, so we have highlighted some of these features where they are featured.
Third party solutions are definitely a way to make Hyper-V management and daily use much better and easier for you. Lucky for us there are plenty of different solutions available on the market for just this.
Hyper-V, while not as widely used as ESXI and the now ubiquitous VMWare solutions, is still a very popular virtualization platform. There are many great features that it brings to the table, and as such there is a need for additional management and monitoring solutions and tools.
The best Hyper-V Monitoring tools
1. ManageEngine OpManager – FREE TRIAL
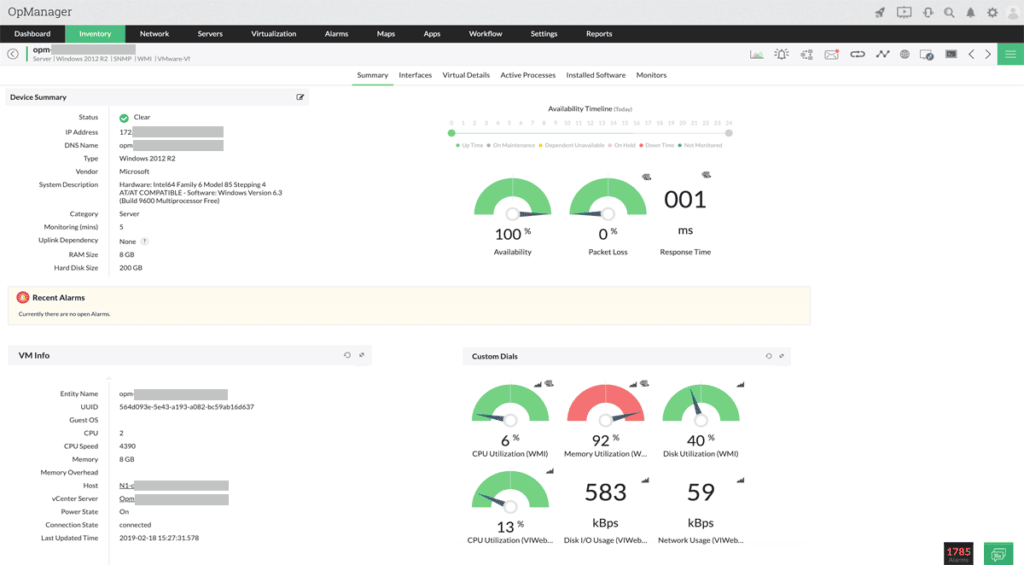
ManageEngine OpManager is a general monitoring tool that gives you control over your general networked environment. It also has some good Hyper-V support and can give you detailed information about the current state of your Hyper-V setup. OpManager uses WMI to find out about your Hyper-V installation and it monitors these devices through this mechanism.
Key Features:
- Comprehensive Monitoring: Delivers full oversight of networked environments, including specialized Hyper-V support.
- WMI-Based Hyper-V Insights: Utilizes WMI for detailed monitoring of Hyper-V installations.
- Active Inventory Tracking: Features real-time tracking of network resources to manage inventory sprawl effectively.
- Extensive Hyper-V Metrics: Offers over 40 monitors for deep insights into CPU, memory, disk, and network usage of Hyper-V hosts and guests.
- Fault Management Module: Provides immediate alerts for Hyper-V related faults, enabling quick response.
Why do we recommend it?
ManageEngine OpManager stands out for its robust network monitoring capabilities, extensive Hyper-V support, and advanced fault management. Its ability to provide comprehensive insights and real-time updates on network resources makes it a powerful tool for managing complex IT environments.
Setting it up is relatively straightforward. It requires that you setup the WMI credentials which will allow the application to discover all the Hyper-V hosts on your network. Like most virtual management solutions, OpManager helps you to combat inventory sprawl by letting you identify your currently deployed resources. It uses an active inventory tracker that gives you near real-time statistics on the currently installed resources on your network.
OpManager is able to monitor all changes and update this inventory list, even if there is a live migration on a specific virtual cluster. It also gives you a complete overview of your Hyper-V infrastructure by giving you key information about the current state of your resources. OpManager has over 40 different monitors that cover everything from CPU, memory, Disk and Network utilization for each Hyper-V host as well as the guests installed on them. Your administrators can monitor everything from services to websites and Windows services and processes.

If you have specific files and folders that need to be monitored then that can also be setup as well. There are many useful features that OpManager offers over and above Hyper-V monitoring support. If any of your Hyper-V resources should go down, then you can leverage OpManager’s fault management module. It notifies you instantly whenever there are any Hyper-V related faults, allowing you to quickly take the appropriate steps.
Reporting is another area that OpManager excels at. There are over 70 built in reports that give you detailed and useful information about how the performance of your Hyper-V systems are performing. These reports can be scheduled to run automatically, giving you a deeper understanding of what is happening over longer periods.
Who is it recommended for?
This solution is highly recommended for IT professionals and network administrators in need of a detailed, versatile monitoring tool capable of handling diverse network environments, especially those with a significant focus on Hyper-V infrastructure.
Pros:
- Versatile Environment Support: Capable of monitoring VMWare, Hyper-V, and various other network environments.
- Advanced Detection Methods: Uses ping and SNMP to accurately track device uptime and performance.
- Real-Time Network Topology: Automatically generates and updates a network topology map for easy visualization.
- Detailed Log Collection: Collects and analyzes logs for enhanced monitoring and troubleshooting capabilities.
Cons:
- Technical Complexity: Designed with IT professionals in mind, which might challenge non-technical users.
They are available in many different formats such as PDF, CSV and XLS. If you need custom data for your reports, then you can generate your own instead of using the built-in reports. ManageEngine offer a 30-day free trial.
EDITOR'S CHOICE
ManageEngine OpManager is our top pick for a Hyper-V monitoring tool for tracking VMs and hosts because this package will discover and map your virtual environment as well as the surrounding IT system. The package is able to monitor VMware, Citrix Xen, and Nutanix GCI systems as well as Hyper-V implementations. The Hyper-V dashboard draws attention to the VMs that are using up the most resources, such as CPU time or memory. The package simultaneously watches the availability of resources on the physical server that supports the hypervisor. The system also scans the network and registers all network devices in a hardware inventory. Thus, OpManager keeps track of all physical and virtual devices in your IUT system. A fault with any one of these devices could grind your system to a halt. The package provides automated monitoring because it will raise an alert if a device or virtual system develops a problem. The service can be set up to forward alerts to technicians by email or SMS. These notifications mean that support staff can assume that the system is running correctly unless they are notified otherwise.
Download: Get a 30-day free trial
Official Site: https://www.manageengine.com/network-monitoring/download.html
OS: Windows Server, Linux, AWS, and Azure
2. Paessler PRTG Network Monitor – FREE TRIAL
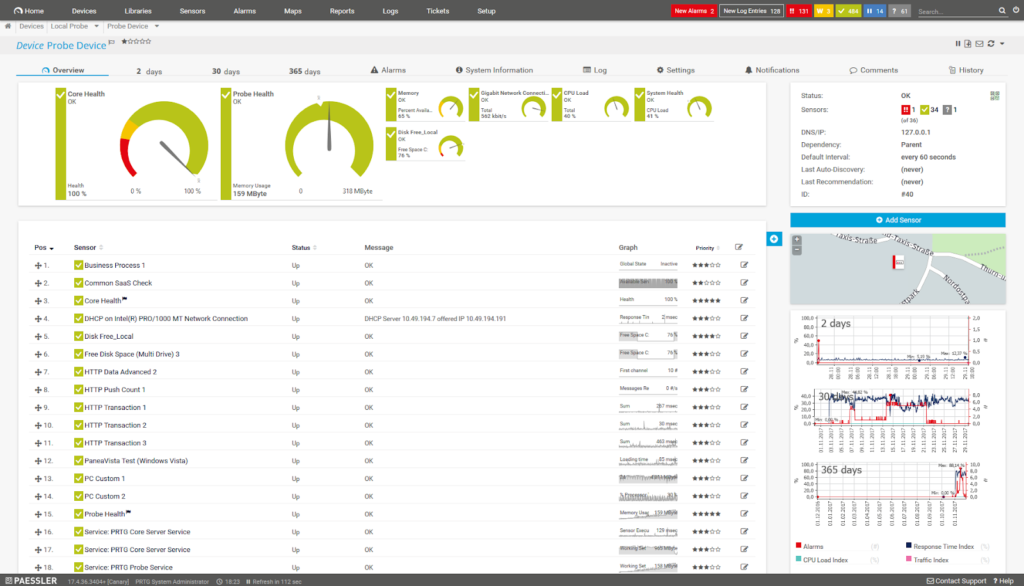
Paessler PRTG Network Monitor lets you monitor all of your systems and devices. It is great for tracking traffic as well as application usage and impact across your environment. PRTG Network Monitor also has a Hyper-V capability that is really good for keeping an eye on your virtual systems. The Hyper-V Host Server sensor is one of many elements that is responsible for this within PRTG.
Key Features:
- Versatile System Monitoring: Offers comprehensive monitoring across all systems, devices, and applications, including robust Hyper-V support.
- Detailed Hyper-V Metrics: Features Hyper-V Host Server sensors among others, for in-depth virtual environment monitoring.
- Resource Utilization Insights: Provides detailed views of CPU usage, including guest and hypervisor breakdowns, and identifies critical performance metrics.
- Customizable Dashboard: Allows for a fully customizable interface, tailored to individual or team needs with drag-and-drop editing.
- Diverse Alerting Mechanisms: Supports a wide array of alert options, including SMS, email, and integration with platforms like Slack.
Why do we recommend it?
Paessler PRTG Network Monitor is highly recommended for its ability to provide a holistic view of network performance, including detailed Hyper-V monitoring. Its versatility, customizable dashboard, and wide range of alerting options make it an indispensable tool for IT professionals seeking to proactively manage and optimize their network environments.
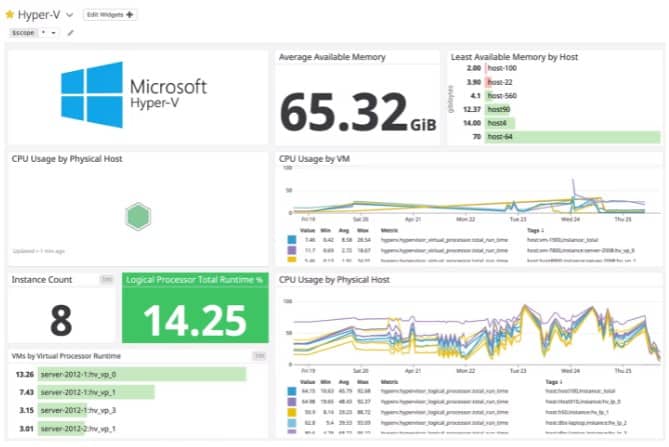
It can monitor and view the important metrics that you need to properly keep an eye on the virtual machines within your Hyper-V environment. Finding out what each of your Hyper-V machines and hosts are doing is important for proactive resource monitoring.
PRTG lets you looks at CPU usage stats such as the breakdown of resource utilization. You can tell what the breakdown is of guests, hypervisor, and total. You can see the total number of issues with the hot’s health, as well as critical values that are causing issues. All of the critical metrics that affect performance are also viewable in graphical elements as well.

PRTG offers plenty of other monitoring features and capabilities, of which Hyper-V is just one. It is able to monitor network links, individual computer systems, software and applications, and much more. PRTG lets you avoid overloads by finding out what is wrong before it becomes a serious issue. The three main components that allow PRTG to do this are the Hyper-V Host Server Sensor, Hyper-V Virtual Machine Sensor, and the Hyper-V Virtual Storage Sensor.
Who is it recommended for?
This solution is ideally suited for IT administrators and NOC teams requiring a comprehensive, all-in-one monitoring tool that can track everything from network traffic and application usage to virtual systems performance. Its freeware version also offers a valuable entry point for smaller operations or those new to network monitoring.
Pros:
- Multi-Protocol Support: Utilizes packet sniffing, WMI, and SNMP for comprehensive network performance data.
- NOC Team-Friendly: The customizable dashboard suits both individual administrators and Network Operations Center (NOC) teams.
- Easy Report Creation: Drag-and-drop editor simplifies the construction of custom views and reports.
- Application-Specific Sensors: Includes specialized sensors for targeted monitoring, such as VoIP activity tracking.
- Freeware Availability: Offers a free version, making it accessible for initial testing or small-scale use.
Cons:
- Complexity: The platform's extensive features and capabilities necessitate a learning curve for full utilization.
PRTG is free for up to 100 sensors, but if you need to go above that then there are different packages to choose from. You can start by download a 30-day free trial. After that, pricing starts at $1600 for 500 sensors.
3. Site24x7 – FREE TRIAL
Site24x7 is a cloud-based infrastructure monitoring and management platform and it includes Hyper-V monitoring in its Infrastructure module. The basic Site24x7 Infrastructure system doesn’t include Hyper-V monitoring out-of-the-box. However, it is available for free – you just have to switch it on. This is one of the “integrations” that Site24x7 offers – it is a plugin.
Key Features:
- Cloud-Based Monitoring: A comprehensive platform for infrastructure monitoring, including Hyper-V environments.
- Hyper-V Integration: Offers Hyper-V monitoring as a plugin, enhancing the service's versatility.
- Automatic VM Discovery: Automatically identifies and maps VM allocations to servers for insightful resource tracking.
- Performance Alerts: Establishes performance benchmarks for Hyper-V systems, issuing alerts for deviations.
- Extended Monitoring Options: Provides the flexibility to integrate network monitoring for thorough Hyper-V oversight.
Why do we recommend it?
Site24x7 stands out for its cloud-based, all-encompassing monitoring capabilities that not only cover Hyper-V but also extend into network, application, and user monitoring. Its ease of use, combined with the ability to scale, makes it a versatile tool for IT professionals looking to maintain optimal performance across their infrastructure.
Site 24×7 Infrastructure is a server and application monitoring that automatically discovers and maps the allocations of VMs to servers and also identifies the underlying resources operated by the physical server that support the Hyper-V implementation. By linking together the relationships within the application and the dependencies of other resources that relate to the Hyper-V implementation. Site24x7 makes it very easy to identify the root cause of any performance issues that the hypervisor experiences.
There is a level of acceptable performance that Site24x7 places on all monitored Hyper-V status. If performance dips below these levels, Site24x7 generates an alert. This can be forwarded to technicians by SMS or email. So, IT operations staff can assume that the Hyper-V system is working correctly unless otherwise notified.
Site24x7 offers Infrastructure subscribers the option of adding on the Network Monitoring system. This will give you a complete tracking service for all Hyper-V issues from the server through to the end-users of the VMs. Another Site24x7 bundle that includes Hyper-V monitoring is the All-in-one plan. This package includes all of the monitoring systems of the Site24x7 platform.

Who is it recommended for?
This solution is ideal for IT administrators and operations teams in need of a comprehensive, scalable monitoring solution that can grow with their infrastructure needs. It's particularly beneficial for those who value the convenience of a SaaS platform and the ability to monitor a wide range of IT environments from a single interface.
Pros:
- Scalability: Excellently scales as a SaaS product, fitting various sizes of IT environments.
- Monitoring Versatility: Enables seamless expansion into network, application, or real user monitoring.
- User-Friendly Interface: Boasts a straightforward and intuitive interface for easy operation.
- Free Version Availability: Offers a free version, making it suitable for small-scale or test environments.
Cons:
- Complexity of Features: The platform's extensive capabilities may require time to fully navigate and utilize.
Download a 30-day free trial.
4. Datadog Infrastructure
Datadog Infrastructure is part of a cloud-based platform of system monitoring and management tools. The Infrastructure unit works as a standalone package but it can also be integrated with other Datadog systems, such as its APM or its Network Monitoring package. A tool monitors all of the services and applications that support user-facing software down through to the resources of physical servers. Hyper-V operates within that stack and is fully tracked by Datadog Infrastructure.
Key Features:
- Comprehensive Monitoring: Tracks all levels of infrastructure, including applications, services, and physical server resources.
- Hyper-V Integration: Offers specific monitoring capabilities for Hyper-V, providing a network-wide infrastructure view.
- Cloud-Based Flexibility: Enables monitoring across multiple locations and cloud resources for a unified overview.
- Resource Optimization: Identifies underutilized VMs, aiding in resource reallocation and capacity planning.
- Extensive System Support: Not limited to Hyper-V, allowing for the inclusion of other virtualization systems and applications.
Why do we recommend it?
Datadog Infrastructure is a robust, cloud-based monitoring solution that excels in providing a comprehensive view of your entire IT ecosystem, including detailed Hyper-V monitoring. Its ability to integrate with a wide range of systems and offer real-time insights makes it invaluable for managing and optimizing infrastructure performance.
Hyper-V monitoring packages that you install on your own servers give you a network-wide view of your infrastructure. As Datadog is based in the cloud, it isn’t limited to monitoring just one location. IT is able to consolidate the monitoring effort for all of your sites plus cloud resources. So, you can get an overview of all Hyper-V implementations, no matter where they are.

The Infrastructure monitor offers drill down paths from the overview so that you can see Hyper-V instances on each site and then on each server. It is able to identify the activity that your VMs support, watch activity within the virtual structure, and track the availability and performance of the physical server resources that Hyper-V relies on.
The dashboard for Hyper-V monitoring in Datadog identifies abandoned and inactive VMs so that you can quickly reallocate resources to make the most of your server capacity. See the performance of load balancers and server CPU, memory, and disks so that you can quickly see when resources are running short or services are presenting performance problems.
The Datadog Infrastructure system isn’t limited to monitoring Hyper-V, you can include performance tracking for other virtualization systems in the same account and also watch over other applications. Datadog will watch databases and Web servers, plus file server performance and connection properties for links to cloud services and remote sites.
Who is it recommended for?
This platform is ideal for IT and network administrators seeking to oversee and optimize a diverse set of infrastructure components, from virtualization environments like Hyper-V to applications and cloud services. Its scalability and holistic monitoring capabilities make it a perfect fit for businesses aiming to grow their monitoring strategies alongside their IT environments.
Pros:
- User-Centric Templates: Features a variety of user monitors, templates, and widgets for customized tracking.
- Holistic Network View: Monitors internal and external network performance, offering a comprehensive perspective.
- Real-Time Updates: Reflects changes to the network in near real-time, ensuring up-to-date monitoring.
- Scalable Monitoring: Supports business growth with flexible pricing options, making it easy to scale monitoring efforts.
Cons:
- Trial Limitations: An extended trial period would be beneficial for a thorough evaluation.
Datadog Infrastructure is available in three plans: Free, Pro, and Enterprise. The Free edition is limited to monitoring five hosts. The Pro plan is the standard package and the Enterprise edition adds a machine learning system to predict potential resource shortages in interlinked systems. You can get of either of the paid plans.
5. Dynatrace
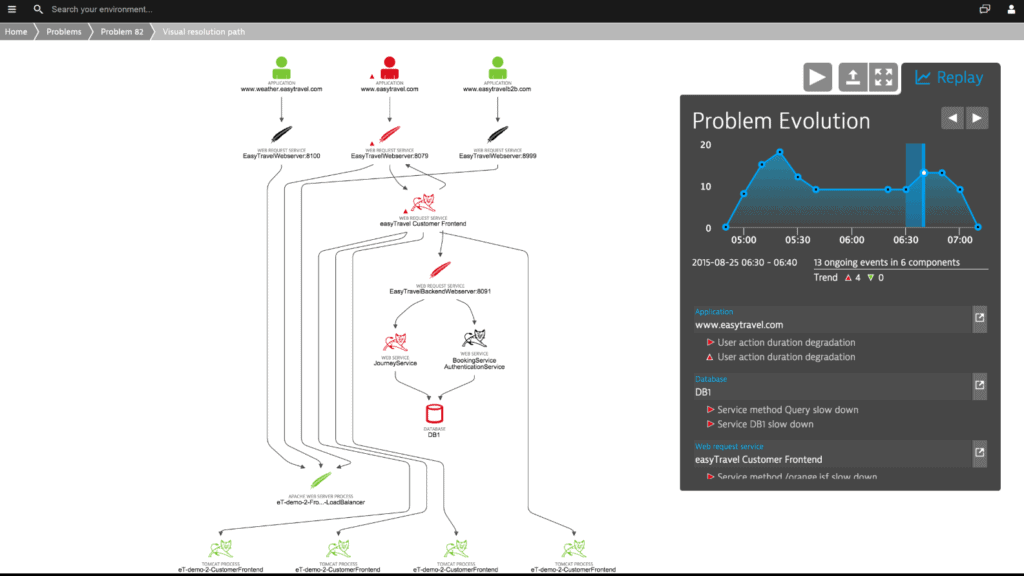
Dynatrace lets you see an interactive map of your Hyper-V resources within your environment. This allows your team to make correlations between the different components and dependencies on your network, and allows you to make the most from your companies resources. Using a visual tool can often help to make sense of complicated environments, so Dynatrace is a very useful resource to make use of.
Key Features:
- Interactive Resource Mapping: Provides a dynamic map of Hyper-V resources, enabling clear visualization of network components and their dependencies.
- Application and Process Tracking: Monitors the processes and applications running on Hyper-V instances for comprehensive oversight.
- Automatic Issue Analysis: Identifies and analyzes problems automatically, pinpointing root causes in both virtualization and application layers.
- Automated Configuration: Simplifies setup with automated monitoring component configuration and detection of new virtual devices.
- Scalable Architecture: Designed to support large-scale environments, capable of managing over 100,000 hosts per cluster.
Why do we recommend it?
Dynatrace stands out for its innovative approach to Hyper-V resource visualization, combined with its ability to automatically analyze and pinpoint issues within virtualized environments. Its user-friendly, scalable design makes it an excellent choice for large organizations seeking to optimize their network resources and ensure the smooth operation of applications and services.

It also tracks the processes and applications that run on your Hyper-V instances as well, making this a good way to see exactly what is happening on your network. Any issues that are picked up are automatically analyzed with Dynatrace. This allows you to discover how your virtualization configuration is causing issues with your applications and services, as well as the impact on users.
It is able to pinpoint the root cause in the virtualization and application layers. Configuring your monitoring components is also done automatically. If you deploy new virtual devices then those will also show up automatically. Because the initial setup is largely automated there is a lot of customization that you wont necessarily get from this app.
The application is good for larger organizations and it is built to scale, with over 100,000 hosts per cluster being achievable. This is a good application for ease of use as the setup is very simple, but for larger organizations with more complicated requirements you might need to look at something else.
Who is it recommended for?
This solution is particularly suited for larger enterprises or Managed Service Providers (MSPs) that manage complex Azure or hybrid cloud environments. Its capacity for large-scale network management and automated monitoring capabilities make it a powerful tool for organizations prioritizing ease of use and comprehensive oversight.
Pros:
- Enhanced Cloud Security: Efficiently secures complex Azure and hybrid cloud environments.
- User-Friendly Interface: Offers a sleek, customizable interface for a tailored monitoring experience.
- Comprehensive Monitoring: Provides real-time monitoring capabilities that extend to LAN, WAN, and virtual environments, making it ideal for MSPs and large enterprises.
Cons:
- Focus on Larger Networks: Primarily tailored for the needs of larger networks and enterprise organizations, which may limit its applicability for smaller setups.
Download a trial version from here.
6. SolarWinds Virtualization Manager
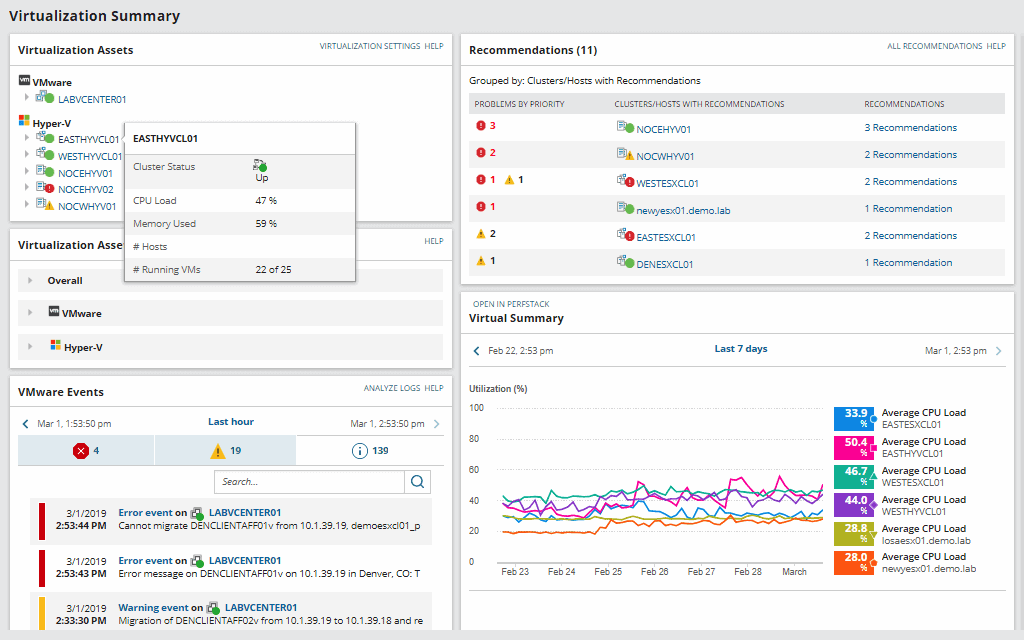
SolarWinds Virtualization Manager offers a lot of features right out of the box that you would expect from such a solid software developer. They have predictive recommendations, VM Sprawl Control, and many more useful features that relate to virtual machine management in general. Other great features include a comprehensive management suite for all of your virtualization needs, on-premise, hybrid and cloud management, and visibility across the entire application management stack.
Key Features:
- Comprehensive Virtualization Suite: Offers a full suite of management tools for virtual environments across on-premise, hybrid, and cloud platforms.
- Predictive Recommendations: Provides actionable insights for optimizing VM performance and capacity.
- VM Sprawl Control: Includes features to identify and manage unused virtual resources, enhancing efficiency.
- Cloud Monitoring: Features specialized monitoring for Azure and AWS, with alerts for infrastructure metrics.
- Centralized Console: Enables streamlined management and scripting capabilities from a single dashboard.
Why do we recommend it?
SolarWinds Virtualization Manager is a top-tier solution for managing virtual environments, notable for its predictive analytics, VM sprawl control, and extensive cloud monitoring capabilities. Its ability to provide comprehensive visibility and actionable recommendations makes it indispensable for optimizing virtualization infrastructure.
Key benefits that come from using this software include faster troubleshooting. This is because you have full visibility across the Hyper-V installation instances on your network and within your environment, no matter where it is hosted. This could be a local installation, a hybrid installation, or a full cloud deployment.
You can also monitor all of the connected software and storage infrastructure. Cloud infrastructure monitoring deserves its own special mention here because it offers alerts for both Azure and AWS infrastructure metrics. Better than that, it offers all of this from a single location and dashboard for the ultimate control.
SolarWinds also has a Virtualization Manager console that allows you to complete many of the tasks that you need to get your basic workload completed from one single location. These are either triggered manually or they can be scripted with your alerts. Other great features include VM Sprawl Alerts which lets you know when you have unused virtual resources.
This can help you to cut costs and maximize your virtual pool of resources, which saves you money in the long term, and will help to increase the overall performance of your environment as well. This is especially useful for Hyper-V installations as all of the necessary features are available for you to quickly and easily monitor and manage these systems.

Who is it recommended for?
This tool is ideal for IT professionals and organizations in enterprise environments that manage large virtual infrastructure across multiple platforms, including cloud services. It's particularly beneficial for those seeking to improve performance, reduce costs, and enhance operational efficiency in their virtualized systems.
Pros:
- Scalable Dashboard: Excellently handles the monitoring of numerous hosts and VMs, suitable for enterprise-level environments.
- VM Resource Monitoring: Supports detailed tracking of individual virtual machine resources.
- Cloud Integration: Seamlessly integrates with cloud services like Azure and Amazon EC2 for comprehensive monitoring.
- Optimization Insights: Delivers improvement recommendations and visual health metrics for easy understanding.
- Capacity Planning: Offers tools for precise capacity planning and generates in-depth reports.
Cons:
- Enterprise Focus: Primarily designed for large-scale deployments, making it less suitable for home users and small businesses.
Get Started by registering and downloading a 30-day free trial.
7. LogicMonitor
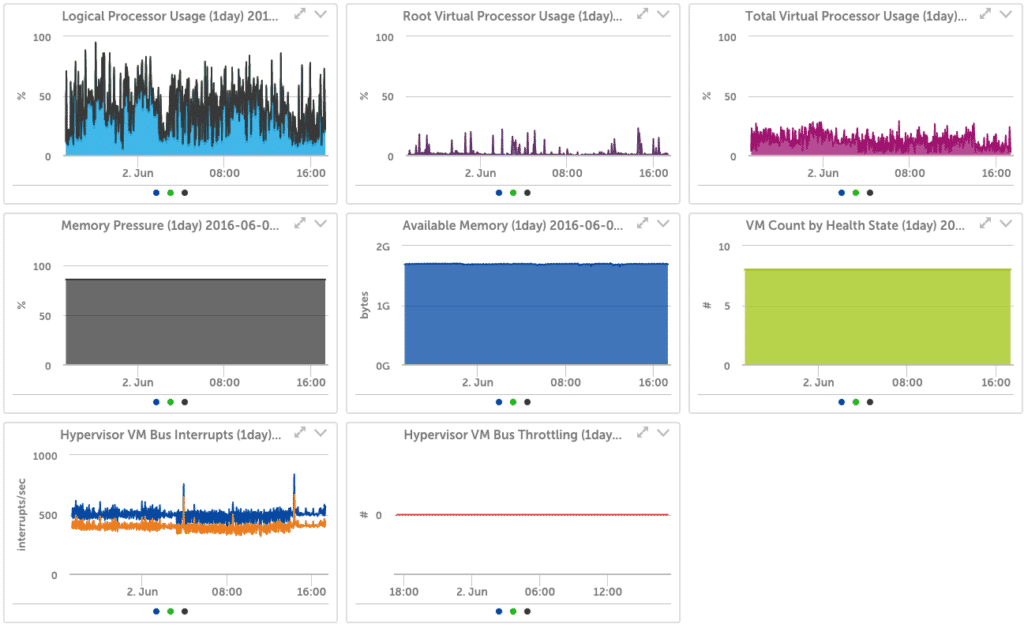
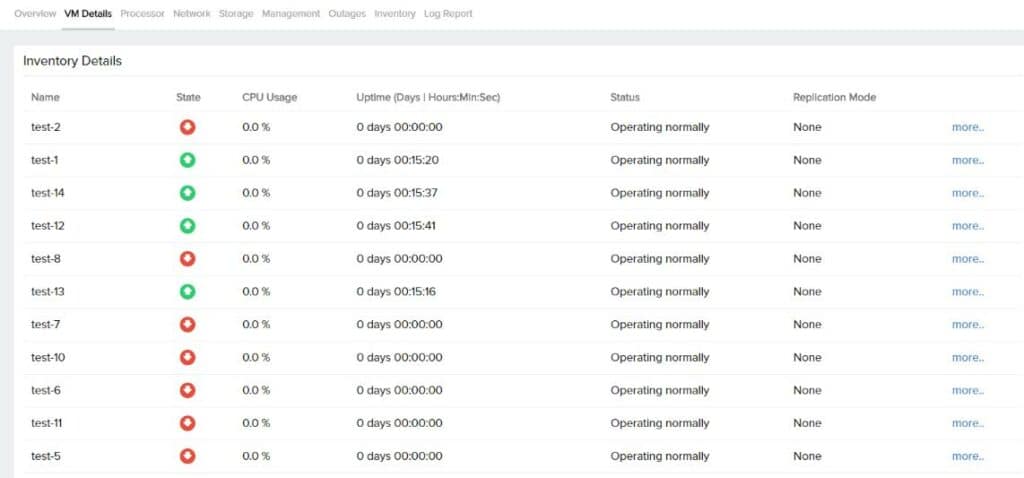
LogicMonitor looks to help users identify how well their current resources are being used by offering real-time monitoring within Hyper-V. It shows you hypervisor health and performance, VM heath and performance, the current state of your virtual storage devices, virtual network adapters and more. On top of all of these features you can also manage snapshots and hardware health too.
Key Features:
- Comprehensive Hyper-V Monitoring: Offers detailed insights into hypervisor health, VM performance, virtual storage, and network adapters.
- Operations Intelligence: Utilizes Hyper-V internal metrics for enhanced visibility and operational intelligence.
- Alert Customization: Enables predefined alert configurations with straightforward messaging for ease of understanding.
- Automatic VM Discovery: Automatically identifies and begins monitoring all virtual machines within the network.
- Capacity Planning Support: Provides a broad overview of network usage, aiding in effective capacity planning.
Why do we recommend it?
LogicMonitor stands out for its ability to provide a holistic view of Hyper-V environments, combining real-time monitoring with extensive operational intelligence. Its user-friendly alert system and automatic discovery of virtual machines simplify the complexity of managing virtualized networks, making it a valuable tool for enterprises and MSPs seeking detailed insights into their IT infrastructure.
Hyper-V internal metrics offer LogicMonitor a lot of data to work with. This results in operations intelligence and great visibility. Hypervisor monitoring gives you a better understanding of how all of the components within the systems work together. This includes processors, logical processors and memory.

You can set up pre-defined alerts and have them trigger when certain conditions are met, and the messaging language is easy to understand for non-technical users. All of these features are especially useful when trying to manage a Hyper-V environment, especially when not all of the management staff have the necessary technical backgrounds to understand the information being generated. Virtual machine monitoring is another element of LogicMonitor that makes it great to use. It automatically discovers and monitors all of the virtual machines on your network.
The virtual machine overview section gives you a larger view of what you are using on your network. This is a good way to see how well your capacity planning is working and will let you see where there are any shortfalls.
Who is it recommended for?
This platform is particularly suitable for enterprises and Managed Service Providers that require in-depth monitoring across both traditional and cloud-based environments. Its capabilities in automatic VM discovery and customizable alerting make it a robust solution for organizations aiming for proactive management of their Hyper-V resources.
Pros:
- Cloud-Based Application Monitoring: Enables performance monitoring of applications through cloud technology.
- Hybrid Cloud Capability: Efficiently monitors assets across hybrid cloud environments.
- Customizable Dashboards: Offers dashboard customization, allowing for tailored views suited to different teams or individual preferences.
- Enterprise and MSP Focus: Ideally suited for the demands of enterprises and Managed Service Providers (MSPs).
Cons:
- Limited Trial Duration: Offers a 14-day trial period, which may not suffice for thorough evaluation needs.
Check here for pricing.
8. Veeam One Free
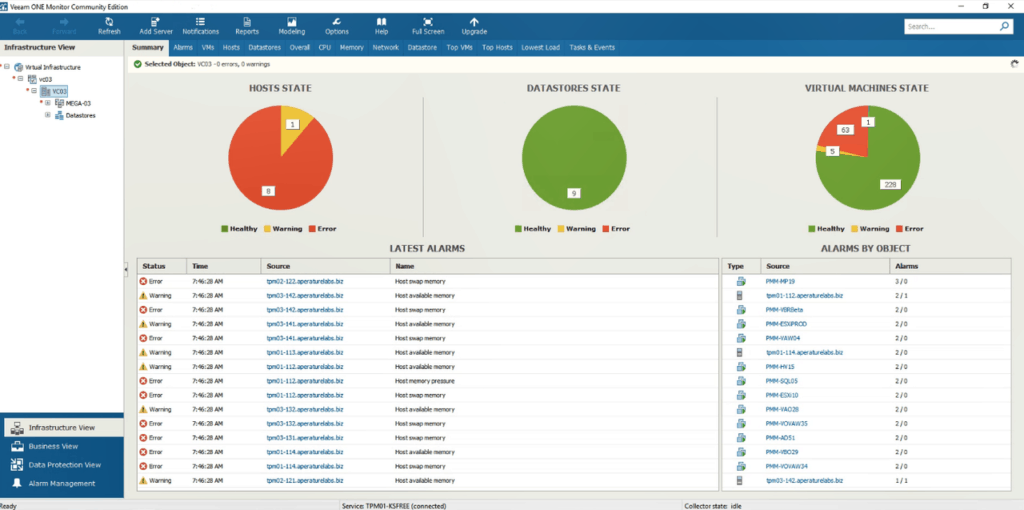
Veaam One Community Edition is a free solution that allows you to monitor up to 10 instances of Microsoft Hyper-V infrastructure. It lets you use all of the powerful reports and data views that you have come to expect from Veaam, as well as the alarms that it provides. There is application level monitoring that lets you monitor an unlimited number of applications on up to three VMs.
Key Features:
- Comprehensive Hyper-V Monitoring: Allows monitoring of up to 10 Microsoft Hyper-V instances with full access to powerful reports and data views.
- Application-Level Monitoring: Offers unlimited application monitoring on up to three VMs, ideal for mission-critical applications.
- Customizable Alarms: Features an easy setup for new alarms with various parameters for tailored monitoring needs.
- Visual Heatmaps: Provides heatmaps for a visual overview of resource load distribution, aiding in decision-making during system stress.
- Detailed Analysis and Audits: Enables forensic analysis of backups and tracks changes for a comprehensive audit trail.
- Advanced Reporting Features: Includes reports on backup job evolution, daily backup status, and agents lacking backup copies, enhancing backup management and compliance.
- Operational Insights: Offers insights into Hyper-V installations' operational requirements, with resources sortable by location, department, or SLA.
- Dynamic Categorization and Role-Based Access: Supports dynamic categorization and role-based access control for enhanced management and security.

Why do we recommend it?
Veeam One Free is highly recommended for its comprehensive monitoring capabilities, customizable alarms, and detailed reporting features, all available without cost for up to 10 Hyper-V instances. Its user-friendly interface and support for system-level recovery and backups make it an invaluable tool for small businesses and home users looking for reliable infrastructure monitoring and data protection.
This is good for mission critical apps that need to stay up and running no matter what. Creating new alarms is quick and easy, and there are many different parameters that can be set to allow for differential alarms, depending on what you need to monitor and track.
Heatmaps are another feature that comes with this version of the product, which gives you a visual indication of how the load is being spread across your resources. This can help you to make better decisions in times of overload and system stress as the better option is clearly visible.
Analysis and audits are another way that Veeam One Free brings value to your setup. It helps to track changes and keeps a record of the important data that needs to be recorded. You can perform a forensic analysis on backups and see what changes were affected by specific users for a time period of your choosing. Other important features include:
- Veeam Agents Backup Job and Policy Historical Information Report:
This feature determines how policies and jobs have evolved over time and alerts you to any negatively affecting trends that might be developing. - Agent Backup Status Report:
This feature provides daily backup information on all protected workloads and gives you a better idea of how these backups are performing. - Agents with No Backup Copy Report:
This feature identifies the agents that may be lacking archived backup copies to ensure end users and service providers are following best backup practices. This is especially important in a production environment where backups are essential for continued operations in the event of a system failure.
Veeam One also lets you gain deeper insights into the operational requirements of each of your Hyper-V installations.
You can order these resources by location, department or even SLA.
This means that you can get a better sense of your current environment by simply looking at your dashboard. There is dynamic categorization, role-based access control and much more.
Who is it recommended for?
This solution is ideally suited for small businesses and home users seeking an effective, cost-free option for monitoring their Microsoft Hyper-V infrastructure. Its ease of use and robust reporting features also make it suitable for organizations requiring detailed insights into their operational environments and backup management practices.
Pros:
- User-Friendly Interface: Designed for ease of use by both technical and non-technical users, simplifying complex monitoring tasks.
- System-Level Recovery Support: Facilitates system-level recovery and backups, ensuring data protection and continuity.
- Cross-Platform Compatibility: Runs on both Windows and Linux operating systems, offering flexibility in deployment.
- Small Business and Home Use Ideal: Perfectly suited for small businesses and home users needing robust monitoring without the cost.
Cons:
- Limited Hardware Integrations: Could benefit from more integrations with hardware storage solutions and NAS devices for enhanced storage management.
Pricing is free and you can download a copy from here.
Conclusion
The main reasons to implement and use virtualization technologies is for the cost benefits and overall reliability that comes with it. Hyper-V offers a compelling platform to manage your virtual infrastructure from, and there are many tools that not only help to enhance this experience, but they can make it a much less time consuming affair.
As we have seen, there are many different approaches to the way companies have developed these different products. How these approaches manifest themselves in each product shows us the differing requirements that each one has identified for their potential client base. Some of these applications concentrate on the management and deployment end of the scale, with monitoring and alerts coming as part of the package.
Others look at backups and capacity planning, while others focus on reporting. In most environments you will find that there is a need for a multi-pronged approach, with there being overlapping between different products and services. Hyper-V has many different aspects to it that require a lot of planning, maintenance and monitoring if it is to be implemented and maintained properly.
There are many reasons to look at Hyper-V as a go-to solution for your organization, and with the selection of tools that we have shown you today, we hope that you will find exactly the right one for your needs.


