
When your business needs to stay running 24 hours a day, 7 days a week, you know that downtime is simply unacceptable. It is for this reason that IT infrastructure monitoring software and tools have been developed. They allow IT professionals to monitor and receive alerts relating to network equipment and performance in the event of there being any issues.
Here is our list of the best IT infrastructure monitoring tools:
- Progress WhatsUp Gold – EDITOR'S CHOICE A network device and server monitor that can be extended to cover bandwidth utilization and application performance. Runs on Windows Server. Start a 30-day free trial.
- AdRem NetCrunch – FREE TRIAL A complete network monitoring tool that provides instant visibility into your environment for quick responses to failure or performance degradation. Download a 30-day free trial.
- Site24x7 Infrastructure Monitoring – FREE TRIAL A monitor for servers and services with network monitoring included to check device health and traffic volumes. This is a cloud-based service.
- Paessler PRTG – FREE TRIAL A package of network, server, and application monitors that the user tailers by deciding which sensors to activate. Installs on Windows Server.
- ManageEngine OpManager Nexus – FREE TRIAL A system monitoring service that covers all aspects of IT infrastructure. Available for Windows Server and Linux.
- ManageEngine OpManager – FREE TRIAL A powerful network monitoring software that can monitor almost every device and service in your infrastructure.
- Datadog Infrastructure Monitoring A monitoring service that focuses on the services and server resources that support front-end software. This is a cloud-based service.
- ITRS OP5 Monitor All IT infrastructure from networks up to applications are covered by this tool that also supports business processes, such as SLA and data protection standard conformance. Available for Linux, on Windows over a hypervisor, or on Azure or Amazon.
- Nagios XI An infrastructure monitor that covers networks, servers, and applications and is based on the free Nagios Core. Runs on Linux.
- Zabbix A free monitoring system with attractive data visualizations that covers networks, servers, and applications. Runs on Linux, macOS, and Unix.
- SolarWinds Network Performance Monitor An SNMP-driven network device status monitor that provides live monitoring with status alerts when acceptable performance thresholds get crossed. Runs on Windows Server.
Today we'll review some of the best software for managing your IT infrastructure and how they can assist you in keeping uptime at an all-time high and minimize any network and server issues!
This is an excellent way to stay ahead of any trouble on your network, and can mean the difference between being open for business and losing money due to a system outage.
We will take a look at some of the most popular examples of network monitoring software, as well as some of the most common features that you can expect to find.
Let’s get started!
Our methodology for selecting the best IT infrastructure monitoring tools:
- We prioritize tools that can grow with an organization and adapt to varying network sizes and complexities.
- The ability to monitor a wide range of devices and parameters, such as servers, routers, and network performance, is essential.
- We look for tools with intuitive interfaces that simplify monitoring for IT professionals, including customizable dashboards.
- Features like network insights, intelligent maps, and troubleshooting tools are crucial for effective problem resolution.
- The tool should offer reasonable licensing costs and provide value for money, particularly for enterprise environments.
The best IT Infrastructure Monitoring Tools
1. Progress WhatsUp Gold – FREE TRIAL
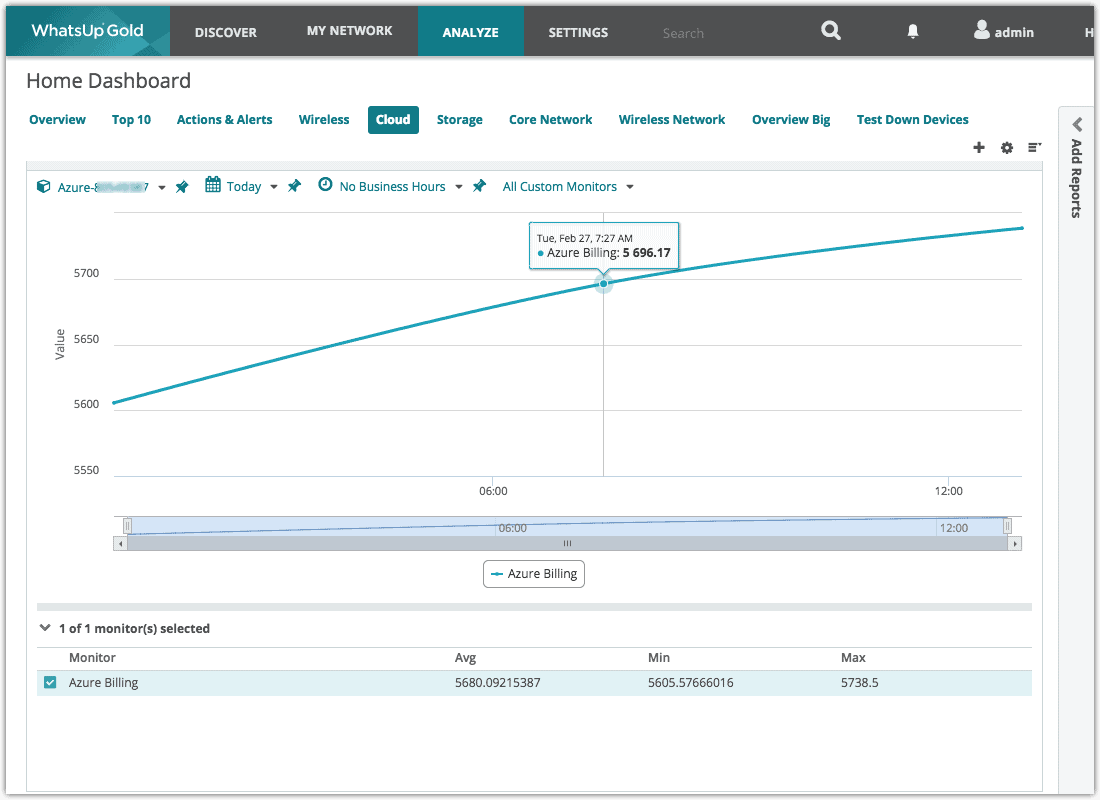
Progress WhatsUp Gold is another monitoring suite that has a strong focus on network connectivity and performance. It is able to monitor cloud infrastructure such as AWS and Azure, and can automatically discover, map and monitor Amazon Web Services and Azure Servers. This allows you to report and monitor status performance of your online environment via WhatsUp Gold 2017’s own native API.
Key Features:
- Monitors cloud infrastructure and network performance
- Automated discovery and network mapping
- Wireless monitoring features
- Customizable dashboards and reporting
Why do we recommend it?
WhatsUp Gold is recommended for its strong focus on network connectivity and performance, including cloud infrastructure monitoring. Its automated discovery and mapping features, along with customizable dashboards, provide an efficient monitoring experience.
The new overlay features offer a visual tool for users to picture clearly the entire network and components throughout the regions, which looks very similar to a heatmap. Congested links highlight as red, while optimal connections remain green.
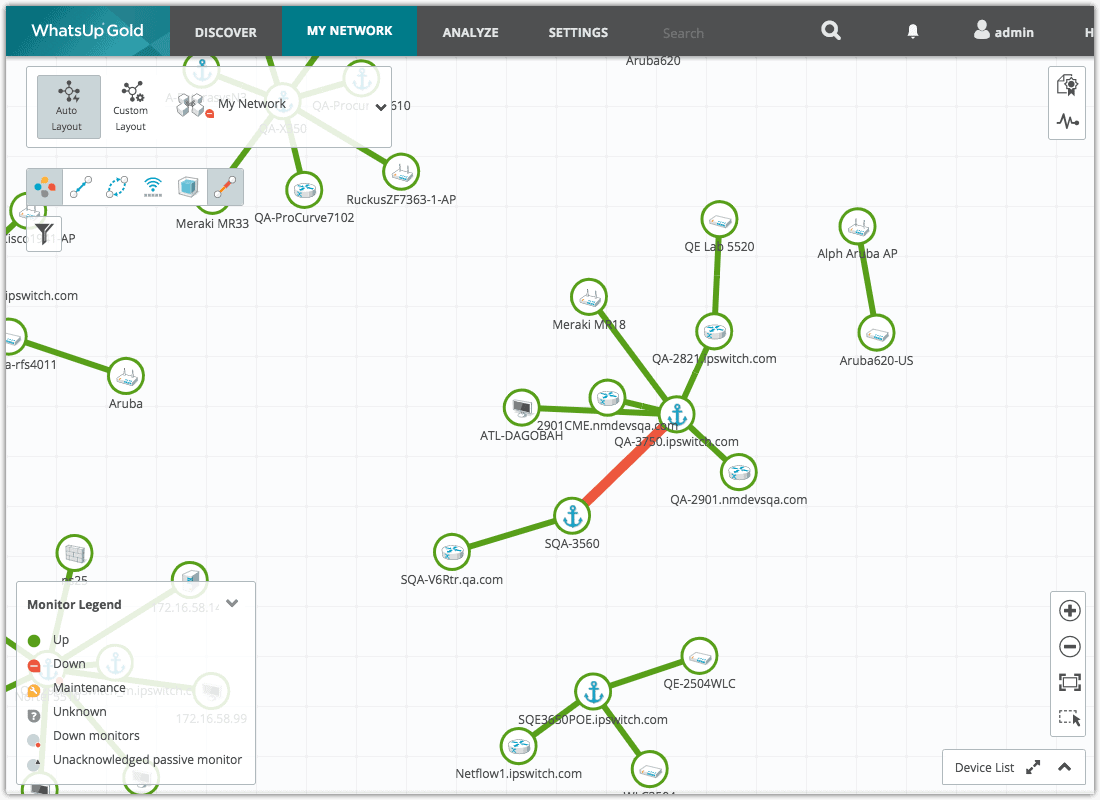
Wireless monitoring features strongly, and environment layouts can be generated very easily, helping again with the visualization of a particular environment based on the network layout and components that are found there.
Dashboards also feature strongly, so you can access all of the essential data that you need from one central location, while active alerts and warnings provide real-time awareness to your daily checks.
Who is it recommended for?
This tool is suitable for small to medium-sized businesses and IT professionals who require a comprehensive monitoring solution that is easy to set up and manage, with a focus on cloud, LAN, and WAN environments.
Pros:
- Uses simple visualizations to help provide at-a-glance insights
- Supports modular pricing, allowing companies to pay only for features they intend to use
- Ideal for SMB environments
- Excellent dashboard and reporting visuals
- Can monitor LANs, WANs, and cloud-based applications such as container environments
Cons:
- Modular upgrades might not be a good fit if you intend on utilizing all aspects of a networking monitor
Pricing: Register for a 30-day free trial and to receive a quote.
EDITOR'S CHOICE
WhatsUp Gold is our pick for the best IT infrastructure monitoring software because it provides comprehensive visibility into the performance and availability of every device that’s connected to your network. It supports servers, routers, storage devices, wireless platforms, virtual machines, cloud devices, and more. It even creates an interactive map that puts these devices in a context, so you can easily identify issues and fix them. Along with devices, it also monitors applications and generates reports on their performance, response times, and other metrics. It analyzes network traffic as well to identify bandwidth hogs and suspicious applications and connections. Armed with this information, the IT team can troubleshoot quickly to improve performance and prevent inefficiencies in your network.
Download: Get a 30-day free trial
Official Site: https://www.whatsupgold.com/
OS: Windows Server 2012 or later
2. AdRem NetCrunch – FREE TRIAL

AdRem NetCrunch is a comprehensive infrastructure monitoring system that covers a wide range of devices, services, sensors, applications, cloud services, and more. It combines data from all these sources and analyzes them to provide detailed insights about potential issues or vulnerabilities. It also generates alerts and provides contextual information for each to speed up troubleshooting.
Key Features:
- Agentless monitoring that requires minimal setup and installation.
- Monitors bandwidth to identify the top users.
- Comes with more than 670 targets for out-of-the-box monitoring.
Why do we recommend it?
NetCrunch is an easy-to-use tool for monitoring the different aspects of your network. Its extensive coverage, coupled with its ease of use, makes it a good choice for organizations of all sizes. We recommend this tool in particular for its advanced alert system, which ensures you can respond quickly.
Another aspect that we like is its dashboards. All the relevant information about your environment is displayed on intuitive charts that you can further explore and drill down to get detailed information about a specific metric.
NetCrunch comes with 670 monitoring targets that can be used straight out of the box for monitoring, thereby reducing the time required for setup and installation. Its monitoring templates also help with reporting and compliance.

Who is it recommended for?
It is recommended for system administrators and MSPs of large and complex environments with multiple device types.
Pros:
- Extensive coverage of devices and environments.
- Live maps and dashboards that update in real time for instant visibility
- Sends meaningful alerts with contextual information.
- Comes with predefined sensors for easy monitoring.
Cons:
- It can take time to fully understand the tool.
NetCrunch offers two editions – Professional priced at $3,600/year and Enterprise at $5,950, respectively. Large environments can switch to the Enterprise plan priced at $22,500/year. Download a 30-day free trial.
3. Site24x7 Infrastructure Monitoring – FREE TRIAL
Site24x7 is a cloud-based system monitoring platform. Site24x7 Infrastructure is its network, server, and services monitoring module. The Infrastructure system includes the monitoring of a limited number of network interfaces but this can be increased by an upgrade payment. This module covers all of the physical IT hardware in a business.
Key Features:
- Cloud-based network, server, and services monitoring
- Supports various network interfaces
- Network topology mapping and device status pages
Why do we recommend it?
Site24x7 Infrastructure Monitoring is recommended for its versatile cloud-based monitoring capabilities, which include a comprehensive overview of physical IT hardware performance. Its customizable dashboards and detailed network topology mapping are particularly beneficial.
The server monitoring part of the system can supervise servers in different locations, including the cloud, as it doesn’t matter what operating system the servers are running. The system creates an aggregated overview of performance and then allows a drill down through the statistics down to individual servers and their operating statuses.
Although all the processing for this service is performed on cloud servers, there does need to be an agent installed on each server that is being monitored in order to gather statistics. The agent program uploads those statistics over a secure connection to the Site24x7 server for processing.
The dashboard for the monitoring service is also resident in the cloud and each of the screens can be customized. Site24x7 screens all include a drag-and-drop widget system that enables each user to get personalized screens. The system console for Site24x7 can be accessed by technicians through any standard web browser from anywhere.
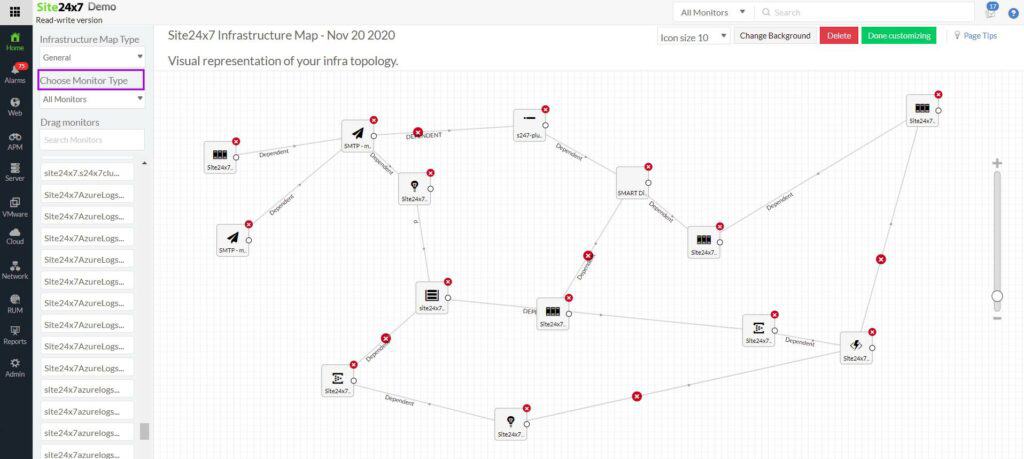
The network monitoring feature starts its service by exploring the network and logging every device that is connected to it. The monitor then draws up a network topology map that is based on the information in the inventory and device health, and also reports on network traffic. Both of these two features are updated automatically when the components of the network change. The network topology map shows live statuses with traffic volumes on each link.
Both the topology map and the network inventory act as menus through to individual device status pages. These pages indicate the memory, CPU, and interface capacity of the device. The system uses SNMP to get regular status reports from devices and it also uses a list of traffic analysis protocols to extract bandwidth usage data per link. The network monitor is able to monitor switches, routers, load balancers, firewalls, VPNs, and wireless network APs.
Both the server and network monitoring tools include a system of alerts. Performance and capacity expectations are interpreted into thresholds. If the performance of a device flags an issue, or if capacity on a link or a device approaches its limit, the system generates an alert. Alerts can be sent to technicians via SMS message or email.
Who is it recommended for?
This tool is well-suited for businesses needing a flexible monitoring solution that can cover servers in different locations, including cloud environments, and offer a detailed analysis of network and server performance.
Pros:
- Flexible cloud-based monitoring option
- Offers a host of out-of-box monitoring options and dashboard templates for SQL server
- Allows administrators to view dependencies within the application stack, good for building SLAs and optimizing uptime
- Offers root cause analysis enhanced by AI to fix technical issues faster
- Can unify SQL monitoring across multi-cloud environments
Cons:
- Site24x7 is a feature-rich platform with options that extended beyond infrastructure management, may require time to learn all options and features
The Site24x7 all-in-one plan includes the server and network monitoring tools as well as all of the other monitoring tools of the Site24x7 platform. That gives buyers two options when they are shopping for an IT infrastructure monitoring tool. Site24x7 Infrastructure is available for a 30-day free trial. Site24x7 Infrastructure is charged for by a subscription of $9 per month when paid annually. There are many paid add-ons for the service and the network interface limit upgrade is one of them. It costs $50 per month for a system with 100 network interfaces, $75 per month for 250 network interfaces, and $200 per month to monitor 1,000 network interfaces.
4. Paessler PRTG – FREE TRIAL
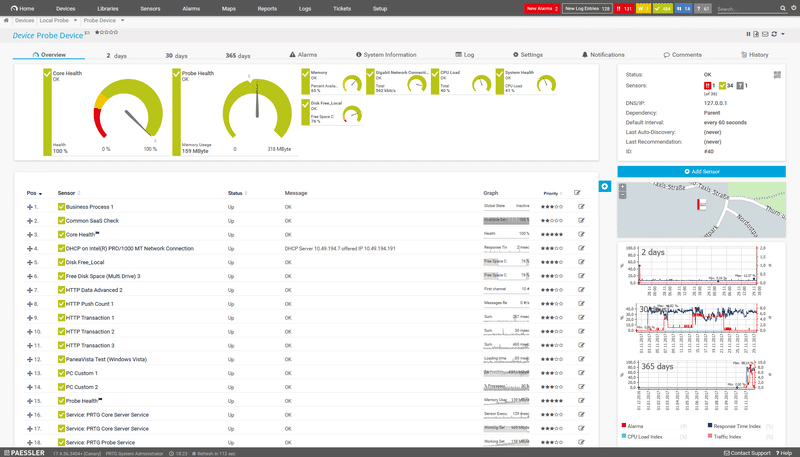
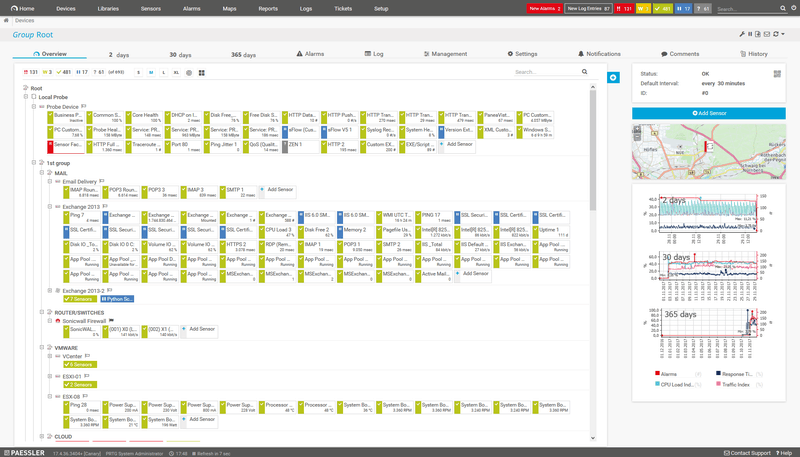
Paessler PRTG has been developed by Paessler, and it has been marketed as a simple-to-use monitoring application that offers all of the important information that you could possibly want at a glance.
Key Features:
- Monitors cloud services, bandwidth, and more
- Intelligent network auto-discovery feature
- Customizable dashboard and mapping features
Why do we recommend it?
Paessler PRTG is recommended for its ease of use and comprehensive monitoring capabilities, which include cloud services, bandwidth, and a range of IT infrastructure components. Its intelligent discovery and customizable dashboard make it highly efficient.
The program itself can be started in just a few minutes, and offers compatibility with many mobile devices, thanks to the use of a functional web interface.
PRTG can help users to monitor the following:
- Cloud Services
- QOS
- Bandwidth
- Websites
- Uptime
- Traffic Analytics
- LAN Analysis and much much more!
PRTG works by using an intelligent network auto-discovery feature, which can scan segments of a network by pinging the ranges of IP addresses that have been defined by the operator. This allows PRTG to automatically recognize as many devices as possible, and can then create the right amount of sensors to accomplish the monitoring tasks that you have In mind.
There is more to PRTG, as they also offer a very useful mapping feature that lets users create the most up to date and relevant web pages with up to the minute accurate details.
Alerts make up the next part of PRTG’s repertoire, and these can be relayed to Android and Apple devices, which makes sure that your IT staff are able to respond to system issues both day and night.
PRTG comes in a few different licensing options, each with its own amount of sensors and options. The first, free version costs nothing, but is limited to only 100 sensors. Further pricing details can be found below.
Who is it recommended for?
This tool is ideal for those who need a versatile monitoring application that offers detailed insights into a wide range of network aspects, from cloud services to LAN analysis, and is especially suitable for environments where quick setup and ease of use are priorities.
Pros:
- Uses a combination of packet sniffing, WMI, and SNMP to scan IP addresses as well as measure device performance
- Fully customizable dashboard is great for both lone administrators as well as NOC teams
- Drag and drop editor makes it easy to build custom views and reports
- Supports a wide range of alert integrations such as SMS, email, and integrations into platforms like Slack
- Supports a freeware version
Cons:
- Is a very detailed platform with many features that require time to learn
As the license prices are determined by the number if sensors that are employed on the network, there are several different options to suit your budget. Get Started with a 30-day free trial download.
5. ManageEngine OpManager Nexus – FREE TRIAL
ManageEngine OpManager Nexus combines a number of services that ManageEngine also markets as standalone modules. At its core is OpManager, a network performance monitor with server monitoring capabilities. OpManager also monitors active directory, web servers, and email servers. The system includes a log manager as well.
Key Features:
- Comprehensive network and server monitoring
- Auto-discovery for network topology mapping
- Intelligent alerting system
Why do we recommend it?
ManageEngine OpManager Nexus is recommended for its robust monitoring capabilities and user-friendly interface. It offers efficient network performance monitoring with advanced features like auto-discovery and intelligent alerting, making it an excellent choice for comprehensive IT infrastructure management.
The “Plus” part of OpManager Nexus are the extra services included. These are a network traffic analyzer, which is able to communicate with switches to get traffic data, capture packet headers, and sample packets. The service includes specialized modules for specific types of devices, including storage servers, and firewalls. The final monitoring service in OpManager Nexus for hardware issues is the IP Address Manager and a Switch Port Mapper. These two services are also marketed separately as OpUtils.
The IP Address Manager (IPAM) in OpManager Nexus is able to coordinate with external DHCP and DNS servers to form a full DDI system. The IPAM isn’t the only system management tool in this bundle that is mostly made up of monitoring services. There is a configuration manager in OpManager Plus as well.
The main network monitoring system in OpManager Nexus is based on the Simple Network Management Protocol. In this, the OpManager module acts as the SNMP Manager. It broadcasts a request for status reports. Each network device is shipped with a resident SNMP agent. This software listens for a request and then sends back a status report. That report also includes information about the device and how it is connected to other devices.
With the information that OpManager Nexus receives back from device agents, the system is able to compile a network inventory. This is an information base for the network topology mapper in OpManager Plus, and can produce network maps. The network inventory gets updated constantly as OpManager plus repeats its SNMP requests. The maps are generated on demand and so always show the latest state of the network.
The OpManager Nexus service also tracks the activities of virtual infrastructure. It can identify and map virtualizations from VMWare, Hyper-V, Citrix, and Nutanix. The virtual infrastructure monitoring is coordinated with a server monitor. These two systems examine the availability of server resources and how they are needed and used within the hypervisor.
All of the statistics that the OpManager Nexus system gathers have performance thresholds imposed upon them. If performance drops or if a resource runs low, the monitor generates an alert that is shown in the system dashboard. Those alerts can be set up so that they will be forwarded by email or SMS to specific technicians.
Who is it recommended for?
This tool is well-suited for businesses and IT professionals who require a detailed, feature-rich monitoring solution that can manage a wide range of network devices and provide insights for better network management.
Pros:
- Designed to work right away, features over 200 customizable widgets to build unique dashboards and reports
- Leverages autodiscover to find, inventory, and map new devices
- Uses intelligent alerting to reduce false positives and eliminate alert fatigue across larger networks
- Supports email, SMS, and webhook for numerous alerting channels
- Integrates well in the ManageEngine ecosystem with their other products
Cons:
- Is a feature-rich tool that will require a time investment to properly learn
ManageEngine OpManager Nexus installs on Windows Server and Linux. You can get a 30-day free trial.
6. ManageEngine OpManager – FREE TRIAL

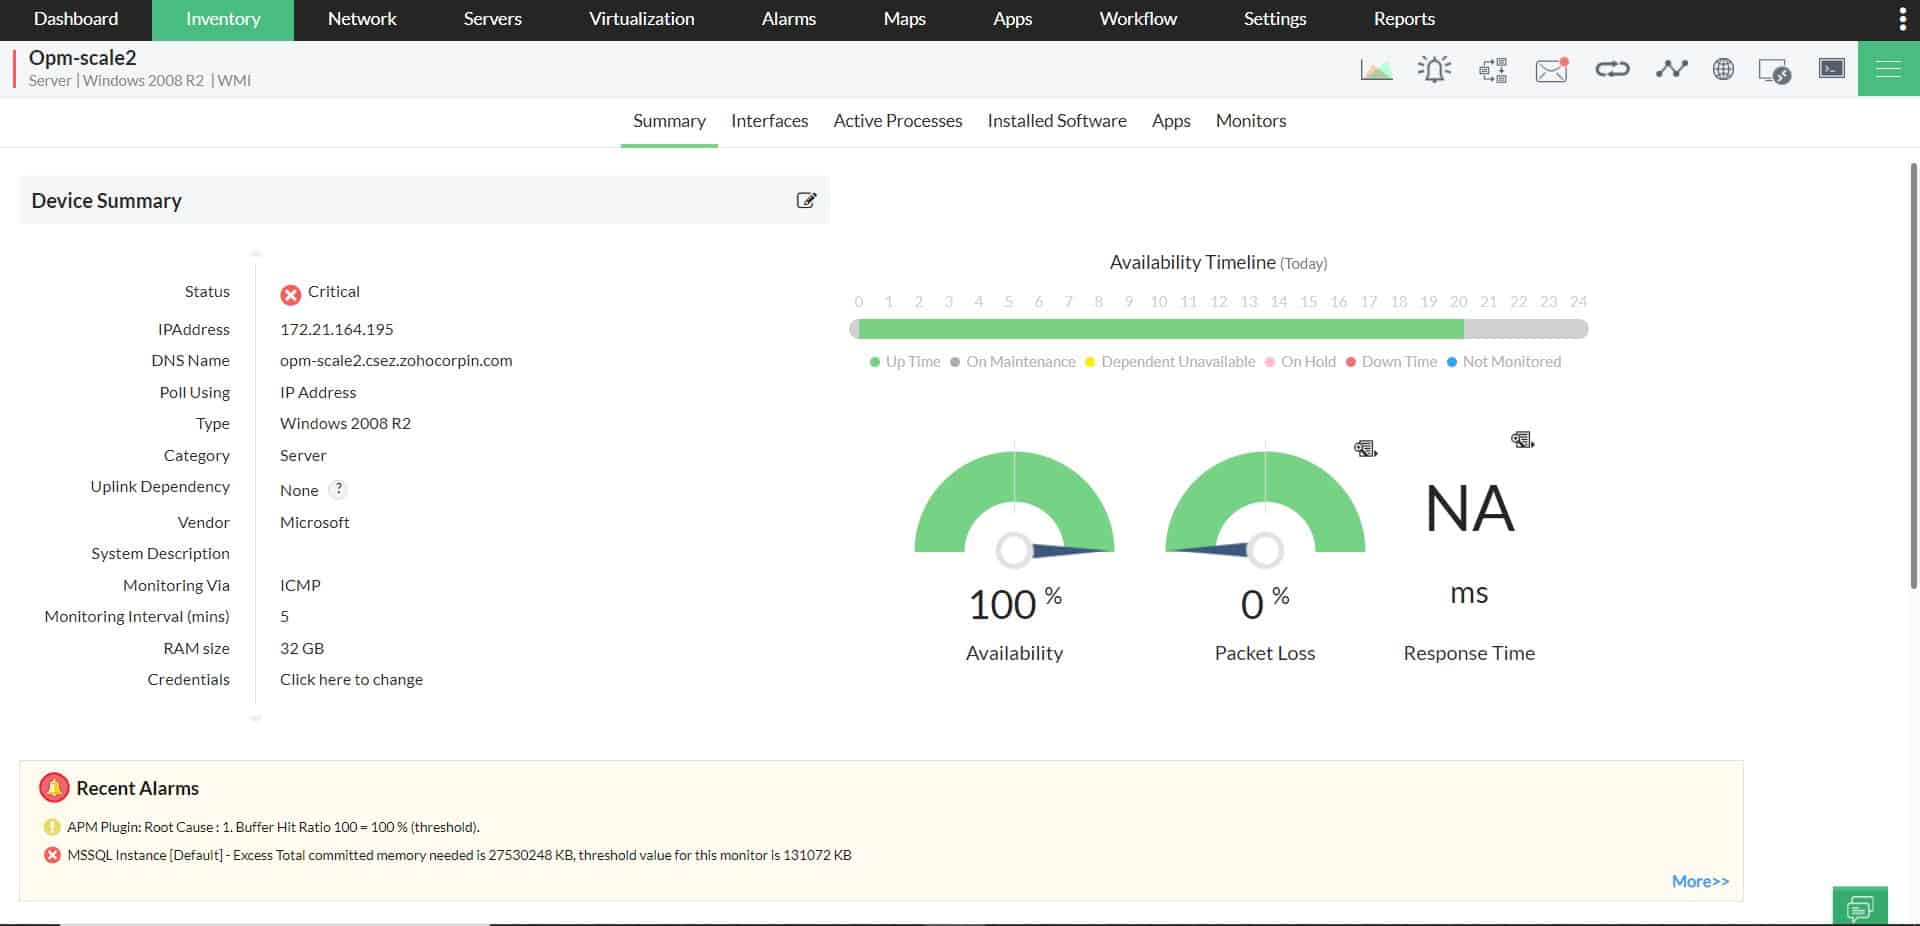
ManageEngine OpManager provides deep visibility into the performance of your network devices like routers, switches, load balancers, LAN controllers, servers, printers, VMs, and firewalls. It correlates data from these devices and analyzes them to provide information about potential issues and their root causes.
Key Features:
- Monitors any IP-based device in real time.
- Covers both physical and virtual servers in your infrastructure.
- Visualizes the availability of WAN links and helps troubleshoot WAN outages.
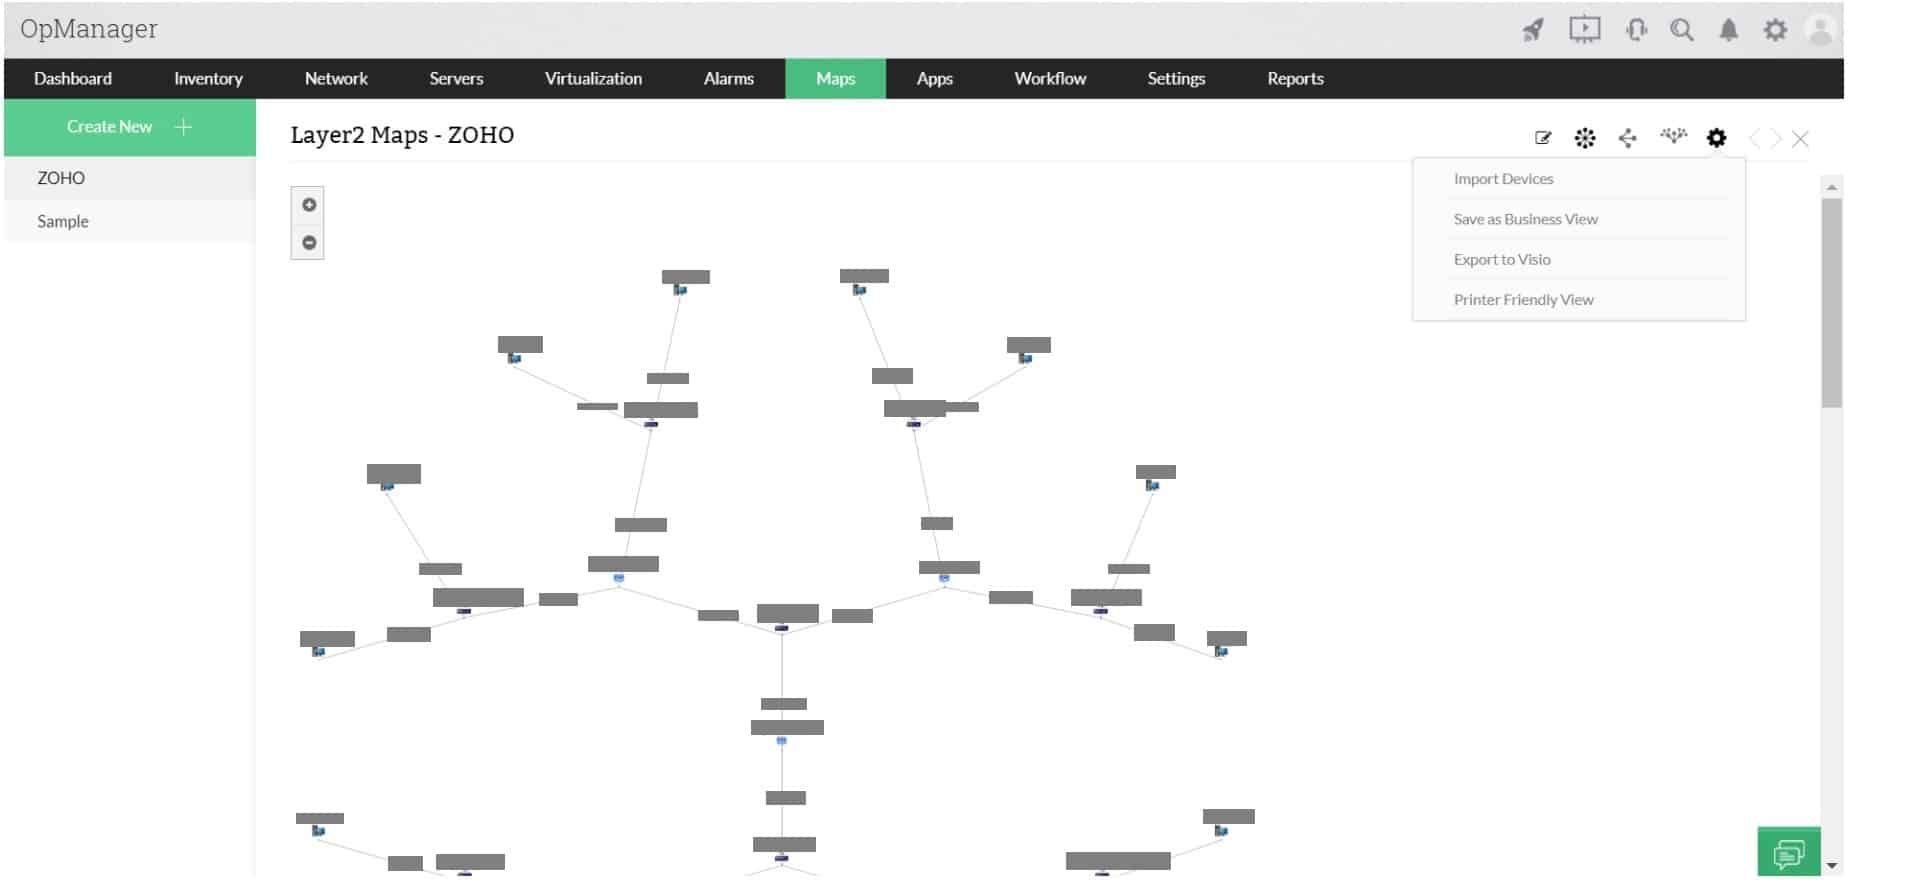
- Offers maps in different formats, including Layer 2 maps, topology maps, business views, and 3D floor and rack views.
- Correlates raw network events to provide meaningful insights.
Why do we recommend it?
OpManager offers extensive coverage, both in the type of devices it can cover as well as the depth of information it can provide. More importantly, it correlates data from across your network to provide actionable insights. Using this information, you can optimize your network’s performance, troubleshoot quickly, reduce disruptions, and even meet compliance requirements.

A standout feature for us is its maps. This tool automatically discovers and creates layer 2 and topology maps. It also offers business views and 3D and floor rack views for complete visibility.
Who is it recommended for?
OpManager is a good choice for system administrators and MSPs who are responsible for maintaining the optimal health and performance of networks. Its dashboards and views can also help network engineers to efficiently troubleshoot issues.
Pros:
- Ensures servers are running at optimal capacity.
- Identifies issues in your network devices.
- Generates extensive reports for audit and compliance.
- Pinpoints the root causes of potential outages.
Cons:
- Some users have experienced a learning curve.
ManageEngine OpManager’s prices start at $245 for the Standard edition, $345 for the Professional edition, and $ 4,595 for the Enterprise edition. Start a 30-day free trial.
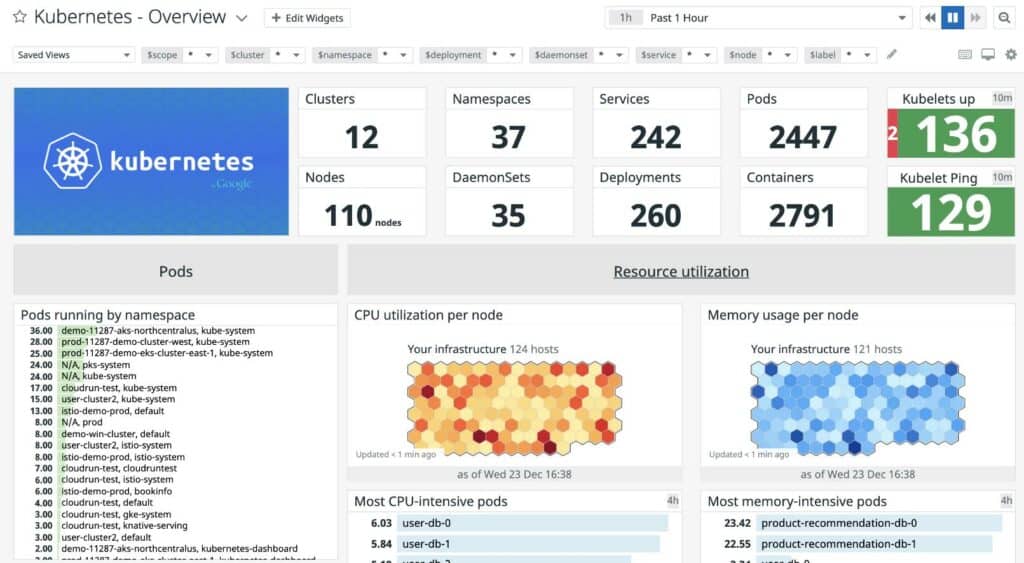
7. Datadog Infrastructure
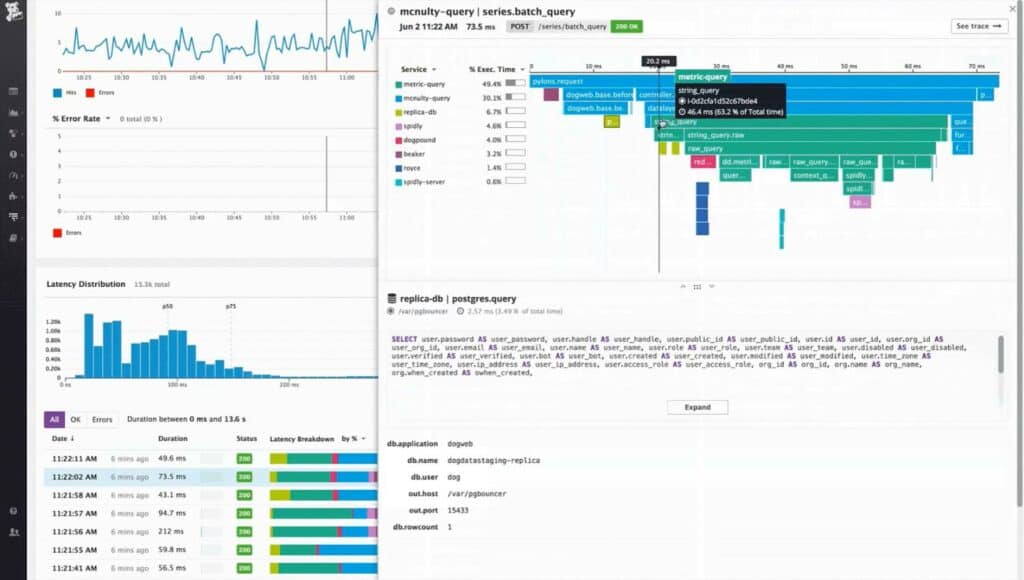
Datadog Infrastructure monitors all of the supporting services and hardware behind the user interfaces of commercial systems. This includes services and applications, such as a Web server, databases, and file managers. This extends down to the operating system and hardware of the server that all of those systems run on.
Key Features:
- Comprehensive service and hardware monitoring
- Integrates with other Datadog services
- Cloud-based with accessible dashboard
Why do we recommend it?
Datadog Infrastructure is recommended for its ability to monitor supporting services and hardware effectively. The cloud-based platform provides a comprehensive view of IT infrastructure, making it easier for network administrators to manage their networks efficiently.
Datadog Infrastructure stops short of offering network monitoring. However, this function can be add-on by also taking out subscriptions on two other Datadog services. The Datadog stable has a range of specialized system monitoring and management tools that are all designed to operate as standalone tools or as a suite.
Datadog Infrastructure is a cloud-based service so all of the processing power for the software is included in the package. You don’t have to buy the monitoring software outright; instead, you pay for a subscription to gain access to the system.
The dashboard for Datadog Infrastructure can be accessed from anywhere through any standard browser. The servers and applications that the service monitors can also be located anywhere, on any site, and also in the cloud. The system will combine the monitoring of servers that are distributed, so they don’t all have to be located on the same site.
The dashboard shows live statistics on application and server performance and imposes performance thresholds. If a threshold is ever crossed, the system raises an alert that notifies technicians of an evolving problem. The alert system gives operators enough time to head of disaster, so they can assume that all is okay unless they receive an alert. This frees up staff for other tasks while Datadog Infrastructure takes care of monitoring normal operations.
Who is it recommended for?
It's suitable for businesses looking for a scalable and flexible monitoring solution, especially those needing a comprehensive overview of their IT infrastructure including servers, databases, and file managers.
Pros:
- Offers numerous real user monitors via templates and widgets
- Can monitor both internally and externally giving network admins a holistic view of network performance and accessibility
- Changes made to the network are reflected in near real-time
- Allows businesses to scale their monitoring efforts reliably through flexible pricing options
Cons:
- Would like to see a longer trial period for testing
Datadog Infrastructure is available in three editions. The lowest of these if free and it covers five hosts. The data retention period on the free version is only one day. To get a longer period, access the Pro plan at $15 per host per month. The Enterprise plan adds on AI-guided thresholds and alerts and that costs $23 per host per month. Get a 15-day free trial of Datadog Infrastructure or any other Datadog monitoring service.
8. OP5
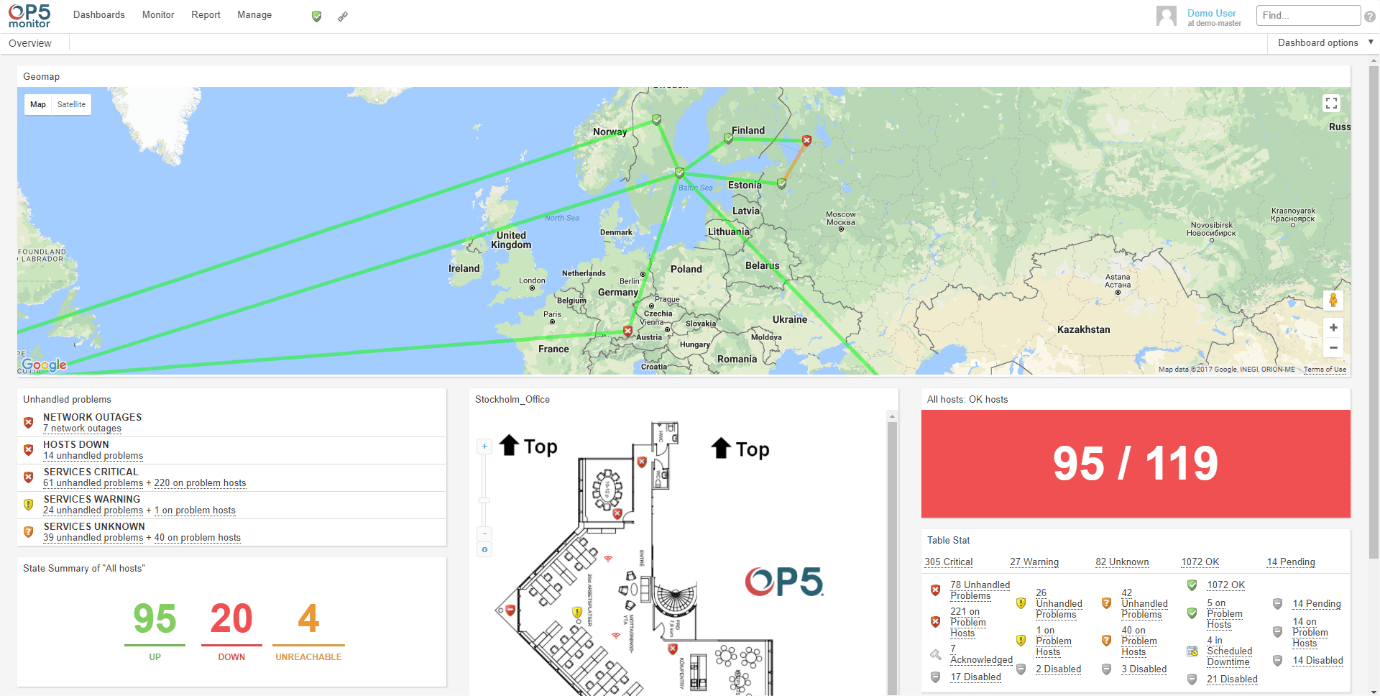
OP5 is an IT monitoring software solution from Sweden, but has been created to serve a global market. It has its roots based in open source, and offers users a surprisingly comprehensive solution right out of the box.
Key Features:
- Scalable, automated monitoring solution
- Geolocation and dependency mapping
- Customizable widgets for dashboard personalization
Why do we recommend it?
OP5 is recommended for its scalability and comprehensive monitoring capabilities, particularly suited for large enterprises. Its real-time monitoring and geolocation mapping features make it a strong contender for managing extensive and complex network environments.
The tool offers a scalable, automated monitoring solution that is sure to give you all of the functionality that you need to monitor, administer and troubleshoot any device or issues that should crop up on your network.
One of OP5’s best points is the fact that it is completely free to download and use, however it is only fully functional for 30 days with unlimited devices and full support. Thereafter, you will be reverted to just 20 devices but you can use the application in this mode indefinitely. When you buy the product, you get full functionality and user support.
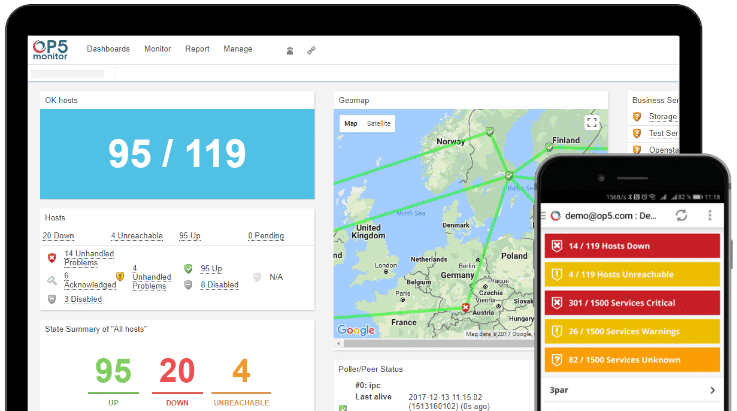
There is all of the standard network monitoring functionality that you would expect; real-time live monitoring of servers, PCs and network devices, as well as maps and connectivity notifications if any of your devices go offline.
Who is it recommended for?
It is ideal for large organizations that need a scalable and robust monitoring solution capable of handling large amounts of data and providing detailed insights into network and device performance
Pros:
- Focuses primarily on offering their services to large enterprises
- All features and interfaces are designed to scale and handle large amounts of data well
- Simple widget customizations can be added or removed
- Offers geolocation mapping, and dependency mapping to help visualize complicated network services
Cons:
- Must contact sales for accurate pricing information
- The interface could be made more user-friendly with fewer menu options
This is an excellent troubleshooting tool that gives you excellent information about what is happening on your network at any given time, and the mobile app is a nice touch as well. For additional pricing information check the link here.
9. Nagios XI
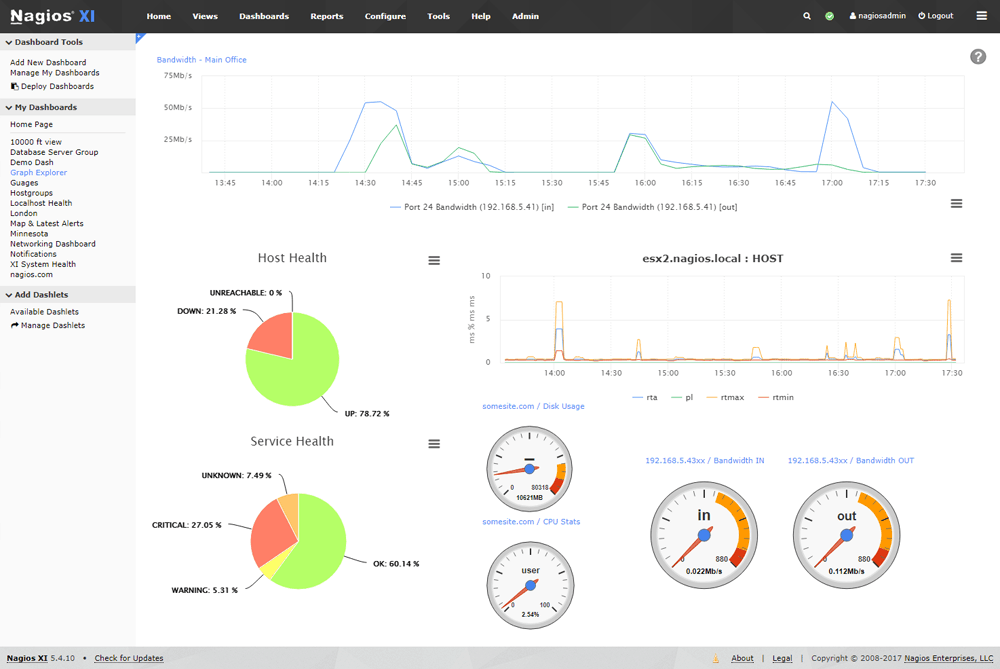
Nagios is a server and network monitoring tool that is suitable for corporate and enterprise businesses with medium to large scale networks, although it also works just as well on smaller networks. It is structured as a comprehensive IT infrastructure monitoring suite that provides monitoring and alerting systems. Nagios is able to monitor applications, services, operating systems, network protocols, systems metrics and network infrastructure.
Key Features:
- Comprehensive IT infrastructure monitoring
- Extensive dashboard and monitoring web pages
- Bandwidth monitoring capabilities
Why do we recommend it?
Nagios XI is recommended for its extensive monitoring capabilities, which make it suitable for corporate and enterprise environments. Its flexibility, enhanced by a range of available plugins, allows for tailored monitoring solutions.
One of the best parts of this product is the fact that you can add additional functionality to your monitoring suite by using third party add-ons.
There are a comprehensive series of dashboards and monitoring web pages that can be looked at, allowing your IT staff to zero in on any issues or abnormalities as they appear. This is excellent for large networks that have hundreds of devices that need to be monitored closely.
Maps are also available, with visual links for easy troubleshooting and error tracking of network issues. Bandwidth monitoring is also available, which means that network performance and data usage can be tracked and monitored, giving you the power to document and report on any abnormal findings.
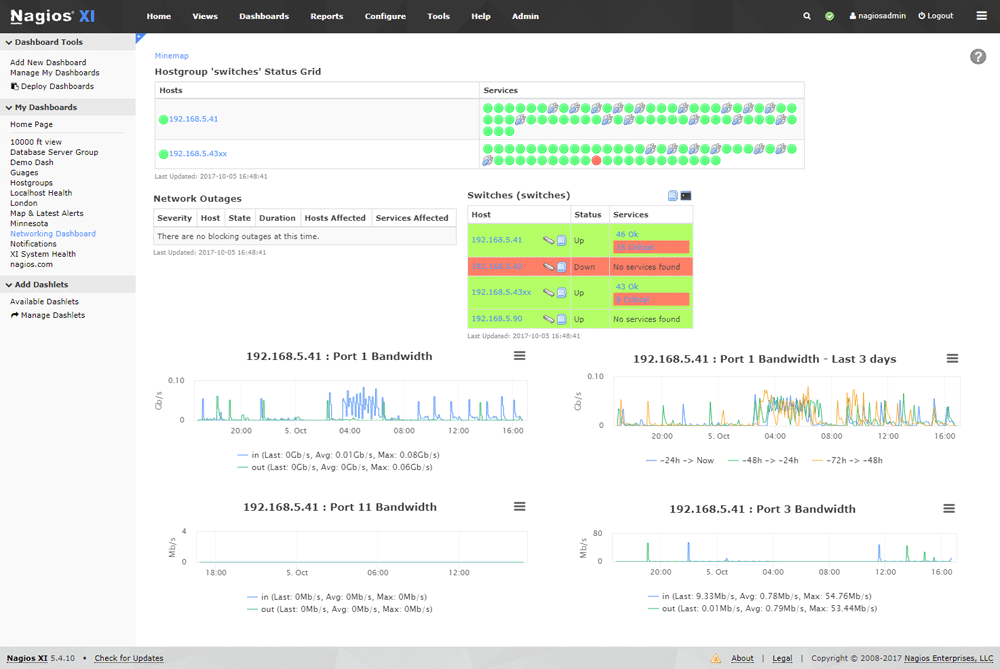
Nagios XI is an excellent suite of tools for anyone that wants to stay in control of their network, with great visual aids giving the user a proper overview of activity. There are many great points to like about Nagios, and its plug-in capabilities give it somewhat of a competitive edge over some of its rivals.
Who is it recommended for?
This tool is best suited for medium to large-scale networks in corporate and enterprise settings that require a detailed and customizable monitoring solution.
Pros:
- Simple, yet informative interface
- Flexible alerting options support SMS and email
- A wide range of community-designed plugins are available for free
Cons:
- The open-source version lacks the support found in paid products
Standard Edition starts from $1,995 while Enterprise begins at $3,495
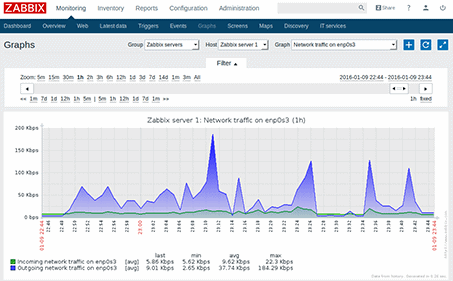
10. ZABBIX
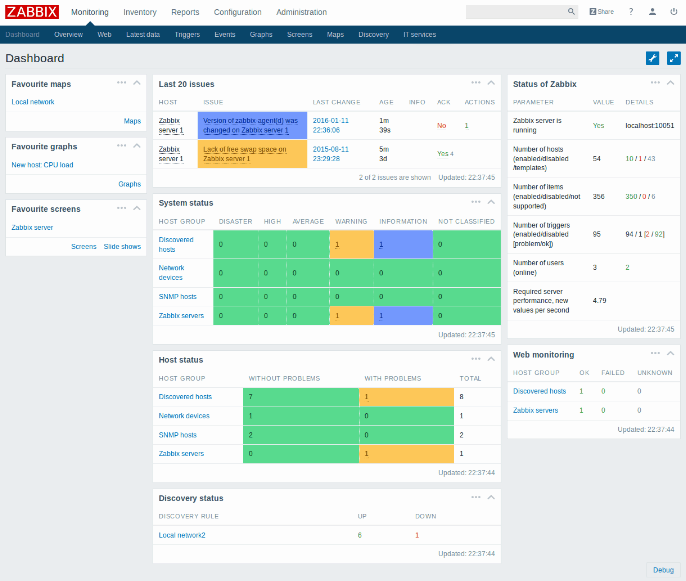
Zabbix is a 100% open source application that quite literally allows you to monitor everything and everything on your network. It offers network monitoring, server monitoring, cloud monitoring, services monitoring, and even KPI and SLA monitoring for good measure. We will be focusing on the network monitoring.
Key Features:
- Comprehensive open-source monitoring solution
- Supports SNMP and ICMP for a broader range
- Real-time monitoring of a wide range of network parameters
Why do we recommend it?
Zabbix is highly recommended for its open-source nature and comprehensive monitoring capabilities. Its ability to monitor a wide range of network parameters in real-time makes it a valuable tool for IT professionals.
It is a truly comprehensive solution, and monitoring capabilities include network bandwidth usage, packet loss rate, interface error rates, CPU and RAM utilization, open TCP connections, aggregates of core routers, and much more.
The Zabbix agent can be installed on a wide variety of platforms, offering enhanced stats and data for the user to draw information from, and the wealth of data that is available becomes essential for building a holistic view of the current state of the environment.
It has a small footprint and does not use many resources, which is great because you never want a monitoring agent to use system resources to such an extent that your system starts to slow down.
Zabbix offers polling and trapping support as well, so all of your passive and active checks can be handled by a singular application with no need to rely on any other data sources. Zabbix can monitor networks, CPU loads, memory, disk usage, services, applications, files and logs, as well as up-time, users and performance counters.
Who is it recommended for?
It is ideal for organizations looking for a transparent and versatile monitoring tool capable of handling a broad range of monitoring tasks across different network types and sizes.
Pros:
- Open-source transparent tool
- Uses both SNMP and ICMP for a broader monitoring range
- Can detect new devices and configuration changes immediately
- Offers useful templates for quick insights
- Robust notification system supports SMS, email, custom script, and webhook
Cons:
- The interface isn’t as intuitive as solutions such as DataDog or Site24x7
- Would like to see better-alerting features, specifically related to reducing false positives
Free and Open Source, although paid support is available if you require it.
11. SolarWinds Network Performance Monitor
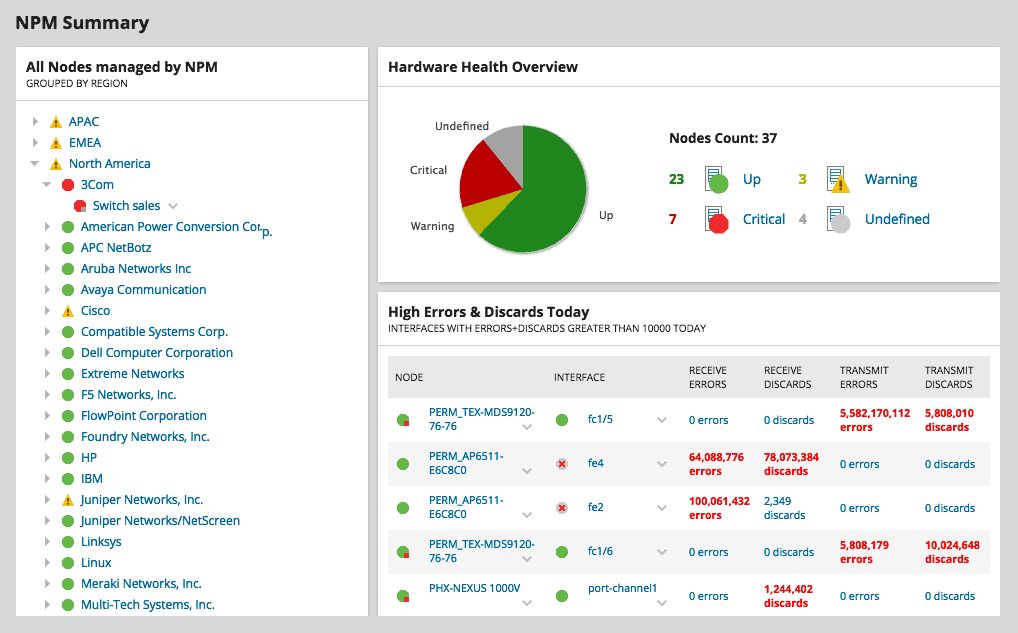
SolarWinds Network Performance Monitor (NPM) is a comprehensive network monitoring suite that is said to reduce network outages while improving performance. It has advanced features that make it an excellent choice for anyone that is tasked with managing and maintaining network infrastructure.
Key Features:
- Multi-vendor network monitoring support
- Enhanced network insights for visibility
- Intelligent mapping of network environments
- NetPath and PerfStack for troubleshooting
- Scalable for large organizations
- Advanced alerting functionality
Why do we recommend it?
SolarWinds NPM is recommended for its comprehensive network monitoring capabilities, which significantly reduce network outages and enhance overall performance. Its advanced features, including multi-vendor support and intelligent mapping, make it an excellent choice for managing complex network infrastructures.
SolarWinds NPM will let you take control of your monitoring, and will let you troubleshoot and diagnose issues on your network before they become a bigger problem.
NPM lets you monitor specific devices on the network, or even being able to trace an entire node map. Customizable dashboards are also available, allowing you to create specific views for different teams. This simple approach clears the clutter that can accompany such a large scale monitoring application, which makes for a highly usable product that is simple to use but does not sacrifice quality or features while doing it.
Netpath is a feature that helps IT professionals when they need a visualization tool, and is especially useful when trying to diagnose and trace network faults.
SolarWinds NPM is able to deliver detailed monitoring information and analysis of your network devices’ performance thanks to the use of SNMP. This means that any devices that use the protocol can communicate with Solarwinds NPM and give it a wealth of information.
These devices include PCs, Laptops, servers, network switches and routers, Wifi access points and much more. Just about anything with an IP address and SNMP will be able to communicate with Solarwinds NPM.
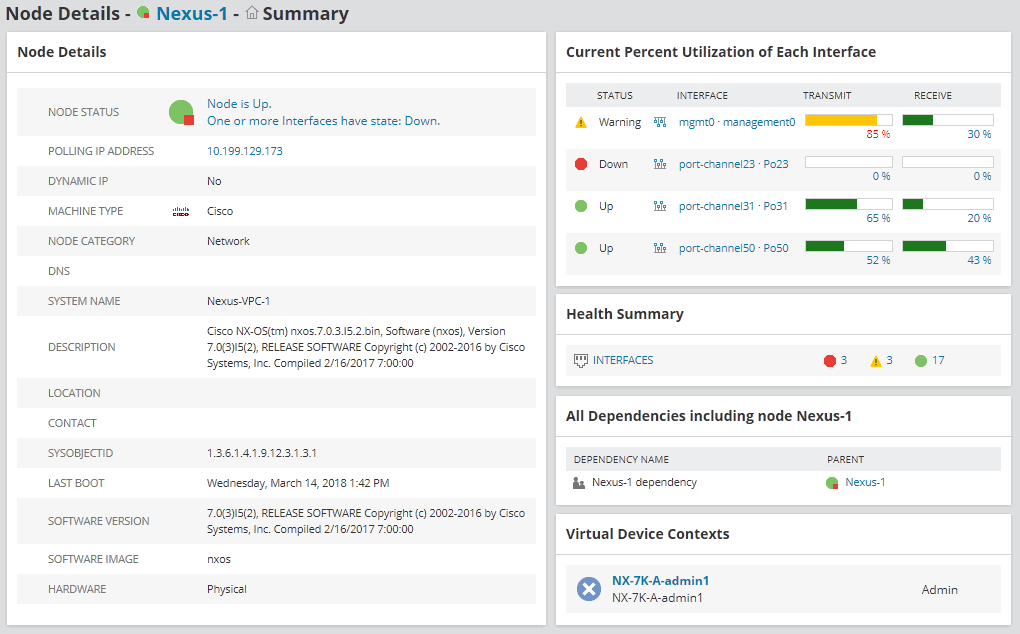
Solarwinds NPM can communicate on 3 fronts:
- Nodes:
A node describes an entire device, and not just its interface. Devices such as routers, switches, VM and physical servers as well as hardware firewalls all count as nodes in Solarwinds NPM. - Interfaces:
Interfaces refer to ethernet ports on a network device. These include switch ports, physical interfaces such as network cards, virtual interfaces, sub interfaces, VLANs and other points of network based traffic. - Volumes:
These are network storage elements that can be monitored remotely.
Who is it recommended for?
This tool is ideal for IT professionals tasked with managing and maintaining network infrastructure, especially in large and growing organizations that require scalable solutions.
Pros:
- Takes a holistic approach to server performance and health monitoring
- Supports auto-discovery that builds network topology maps and inventory lists in real-time based on devices that enter the network
- Supports both SNMP monitoring as well as packet analysis, giving you more control over monitoring than similar tools
- Uses drag and drop widgets to customize the look and feel of the dashboard
- Robust reporting system with pre-configured compliance templates
Cons:
- Designed for IT professionals, not the best option for non-technical users
Get a 30 Day Free Trial Download!


