

All Business networks run using IP Addresses and what better way to understand what's going on in your network than to Deploy an IP Monitoring Software Tool to understand it!
Networks need to be monitored constantly in order to ensure that systems stay online and that businesses can operate without any downtime for as long as possible.
It isn’t practical to sit and watch a screen all day, so companies have created monitoring tools that check connectivity for us.
Here is our list of the top IP Monitoring Tools:
- ManageEngine OpUtils – FREE TRIAL A package of network and server monitoring tools that maps the network after an autodiscovery phase. Available for Windows Server, Linux, and AWS. Access the 30-day free trial.
- Site24x7 Network Monitoring – FREE TRIAL This package is part of a cloud platform that uses SNMP to identify all devices on a network and record them in an inventory. Access a 30-day free trial.
- Paessler PRTG – FREE TRIAL A bundle of monitors for networks, servers, and applications that includes network discovery and topology mapping. Runs on Windows Server. Download a 30-day free trial.
- Nagios Network Analyzer A bandwidth monitor that provides traffic shaping measures to get extra value out of network infrastructure. Runs on Linux or on Windows over a hypervisor.
- Zabbix This free package is a fork of Nagios and can take Nagios plug-ins. It includes network monitoring and it runs on Linux, Unix, and macOS.
- PowerAdmin Network and server monitoring that includes Ping availability tests and SNMP device status checks. Available for Windows Server.
When a server or vital network device goes offline, an automated response from one of these applications alerts the relevant staff when any problems arise.
IP Monitoring can also let you know if there are any potential issues that could cause issues further down the line. These issues can be picked up and dealt with before they become a serious issue.
Here's the Best IP Monitor Tools & Software of 2024:
Our methodology for selecting IP monitoring tools and software
We reviewed the network IP tools and software market and analyzed the options based on the following criteria:
- A facility to monitor IP over time
- Ease of use
- Support for internal, external and iPv6 networks
- Graphical interpretation of data, such as charts and graphs
- A free trial period, a demo, or a money-back guarantee for a no-risk assessment
- A good price that reflects value for money when compared to the functions offered
Below you'll find a quick description of each software and tool, along with some quick screenshots of how they look and their dashboards!
Related Post: Best Network Troubleshooting Tools
1. ManageEngine OpUtils – FREE TRIAL
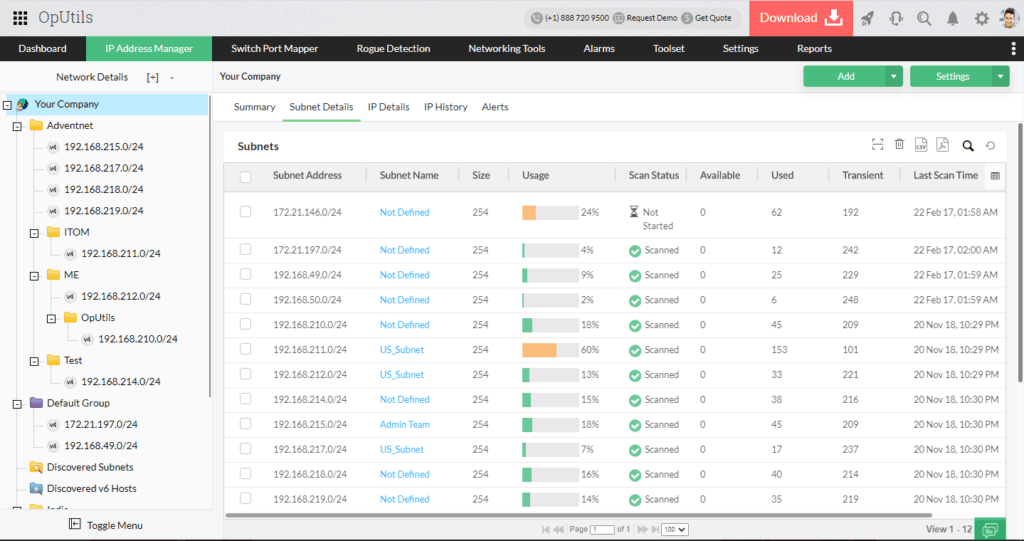
ManageEngine OpUtils has an IP Monitor module that gives you the flexibility to manage and monitor IP resources on your network from a single location. They do a great job at helping you monitor a range of different devices that are connected to your network as well as give you visibility into your network and performance issues and bottlenecks.
Key Features:
- Agentless Monitoring for easy Collection, analysis and processing of data.
- Granular details of network devices and hosts
- Monitor, Manage and Troubleshoot IP Issues
Why do we recommend it?
ManageEngine OpUtils is recommended for its comprehensive and flexible IP monitoring capabilities. Its agentless monitoring approach simplifies data collection and analysis, while providing detailed insights into network devices and hosts. The ability to identify new devices through auto-discovery is particularly valuable for large networks, ensuring continuous monitoring without manual intervention.
Who is it recommended for?
This tool is ideal for network administrators and IT professionals who need to manage and monitor IP resources efficiently. It's particularly suited for larger networks due to its auto-discovery feature and comprehensive suite of tools, including Wake-on-LAN, IP address management, and switch port mapping.
Pros:
- Offers a suite of tools that provide WoL, IP address management, and physical switch port mapping
- Gathers hostname, device status, and MAC address alongside IP address scans
- Identifies new machines via autodiscovery, great for large networks and continuous monitoring
- Available for both Windows server and nix operating systems
- Free version is great for smaller networks
Cons:
- ManageEngine is a large monitoring platform that offers a host of tools and features that may take time to fully explore
EDITOR'S CHOICE
ManageEngine OpUtils emerges as our top pick for IP monitoring tools, thanks to its comprehensive suite of features that make network management both efficient and insightful. This tool excels in offering agentless monitoring, which simplifies the collection, analysis, and processing of network data. Its ability to provide granular details of network devices and hosts is particularly impressive, facilitating deeper insights into the network's performance and potential issues.
While ManageEngine OpUtils is part of a larger monitoring platform with numerous tools and features that may require some time to fully explore, its intuitive design and comprehensive functionality make it our top choice for IP monitoring needs.
Download: ManageEngine OpUtils - Free Trial
OS: Windows, Unix
Download: Download the 30-day free trial.
https://www.manageengine.com/products/oputils/download.html
![]()
2. Site24x7 Network Monitoring – FREE TRIAL
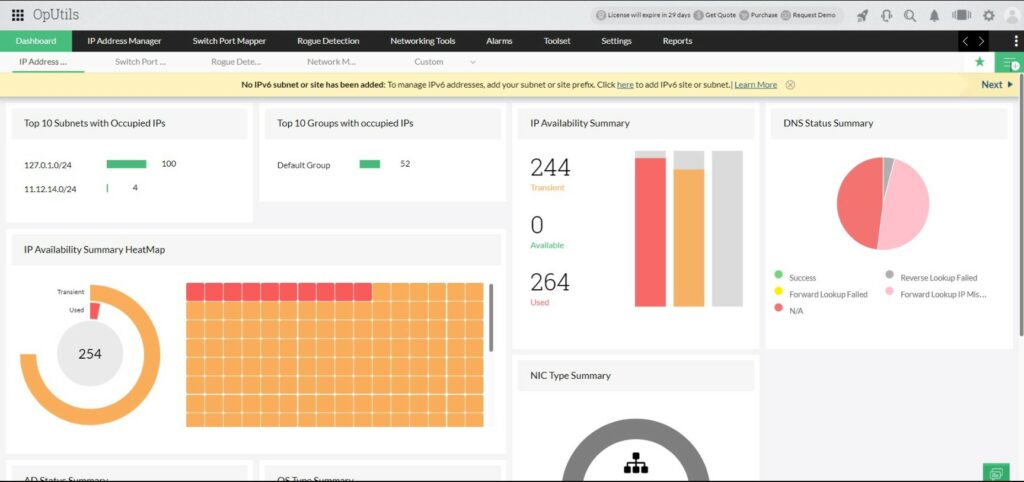
Site24x7 Network Monitoring provides both network device monitoring and traffic analysis from the Site24x7 cloud platform.
This service provides a network discovery service and continuous automated monitoring, which are both implemented by using SNMP processes. The tool compiles a network inventory from SNMP responses and this is updated with each request cycle.
You can access a network topology map, which is drawn up from the current data in the network inventory and so always shows the current network layout.
Key Features:
- Cloud monitoring
- Inter-site connection testing
- Database monitoring
- Web server monitoring
- Firewall monitoring
- VM monitoring
- Quality of Service
- Protocol analysis
- Performance alerts
- Network tests
Why do we recommend it?
Site24x7 Network Monitoring is recommended for its extensive network device monitoring and traffic analysis capabilities. The integration of multiple protocols like NetFlow, sFlow, and IPFIX ensures comprehensive network coverage, while the inclusion of additional services like server, application, and website monitoring makes it a versatile tool for full-stack observability.
The information shown in the device inventory includes all of the identifiers associated with each device – hostname, MAC address, and IP address.
The traffic analysis service in Site24x7 uses NetFlow, sFlow, J-Flow, CFlow, IPFIX, ApopFlow, and NetStream to communicate with network devices. This multi-protocol capability means that no network device is unreachable.
The package also provides a Ping utility which can be executed ad-hoc or set up to run on a schedule to test the availability of devices and record the performance of connections to them.
Site24x7 offers all of its modules in packages rather than pricing each unit individually. Thus, you also get server and application monitoring along with the Network Monitoring system. Some plans also include website monitoring and log management services.
Who is it recommended for?
This service is suitable for businesses of all sizes that require a cloud-based, all-in-one monitoring solution. Its ability to provide detailed network insights and performance alerts makes it particularly beneficial for organizations seeking to optimize network efficiency and reliability.
Pros:
- Network device discovery and status monitoring
- Network traffic statistics gathering
- Full stack observability with root cause analysis
Cons:
- No on-premises option
Pricing: The Infrastructure package starts at $9 per month and it includes five network interface monitors and two NetFlow Analyzer interfaces. This is aimed at small businesses and larger enterprises buy capacity expansions. You can examine the Site24x7 platform with a 30-day free trial.
Download: https://www.site24x7.com/signup.html?pack=44&l=en
![]()
3. Paessler PRTG – FREE TRIAL
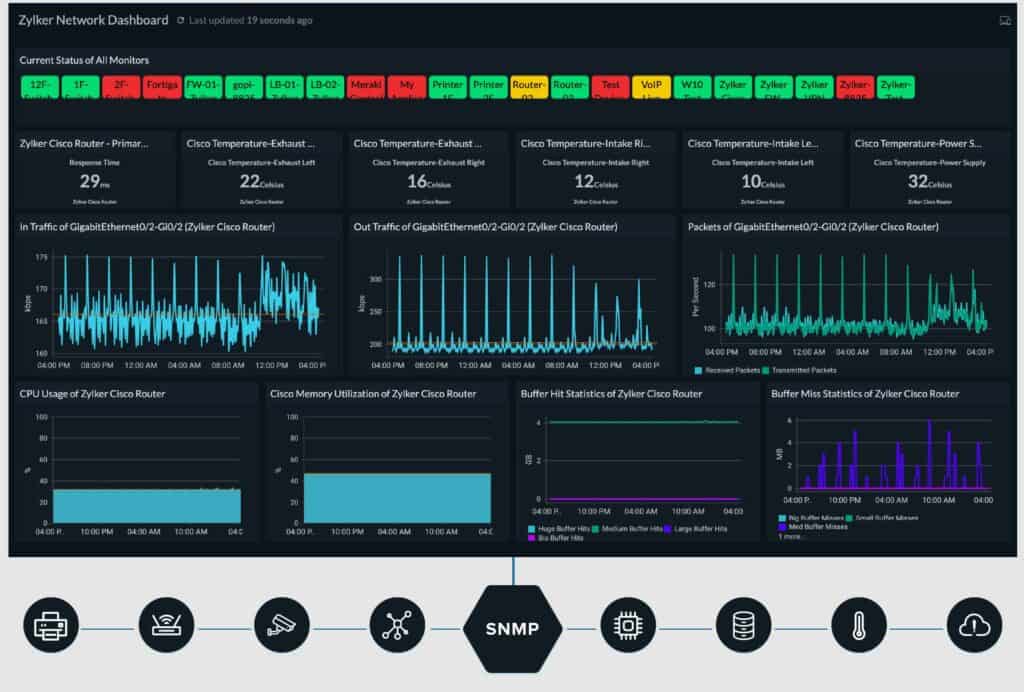
Paessler PRTG offers users the ability to monitor and track changes to the network via its wide range of functions. It is available in English, German, Spanish, French, Portuguese, Dutch, Russian, Japanese and Simplified Chinese, making it a truly worldwide product. There are powerful reporting features that are available with the program, and things such as historic data reports can be exported in PDF, HTML, SCV or XML format.
Key Features:
- Cloud Service Monitoring
- Quality of Service (QoS)
- Bandwidth Analysis & Monitoring
- Web Page access
- Uptime Monitoring
- Traffic Monitoring
- LAN Analyzer
- Server Monitoring
- Database Requests
Why do we recommend it?
Paessler PRTG is recommended for its versatility and wide range of functions in network monitoring. Its multi-language support and customizable dashboard make it accessible and effective for diverse IT environments. The tool's combination of packet sniffing, WMI, and SNMP scanning, along with extensive alert integration options, enhances its utility for comprehensive network management.
Scripting is another area where PRTG shines, and its powerful API has functionality for Python, EXE, DLL, Powershell, Visual Basic and Batch Scripting as well. Because of the web interface and scalable interface, PRTG can be viewed and used on many mobile devices such as tablets and smart phones. This is great for system admins that are away from their primary workstations but still need to monitor network activity.
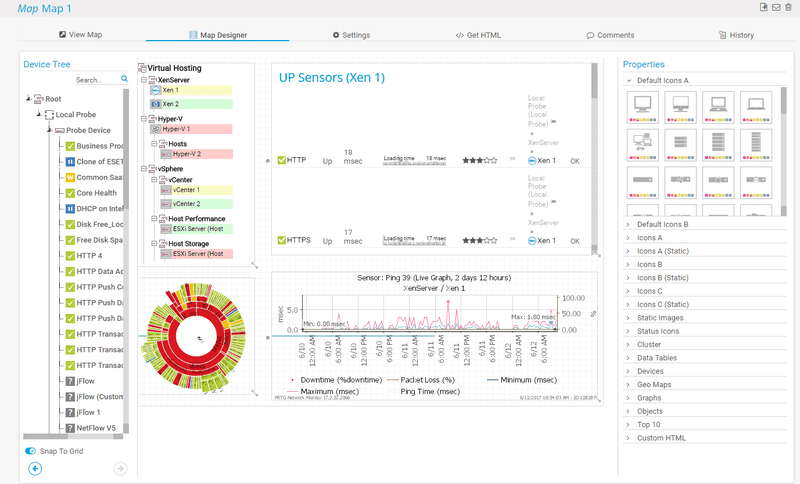
Setup and configuration is a breeze, thanks to the straight forward installer and user interface.
After you launch the application for the first time, you will be met by suggestions and tips within the interface which will give you a good idea of how to get started with setting up the application to start monitoring your environment.
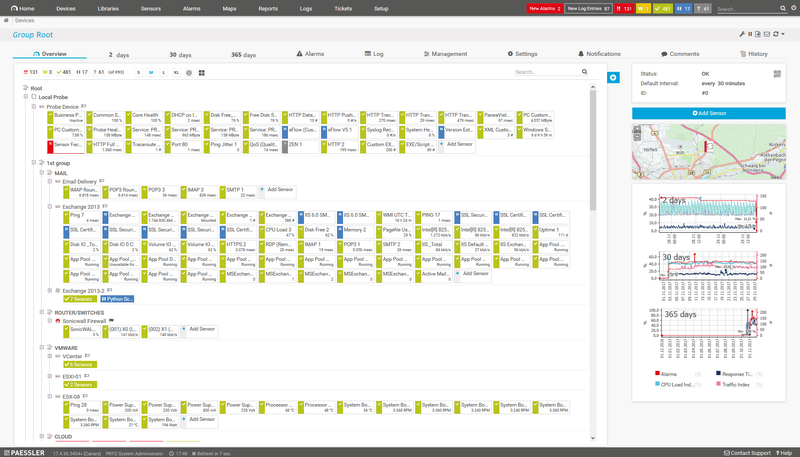
PRTG can be used to monitor many big names in Information Technology, including applications by the likes of: Oracle, Amazon, Buffalo, Microsoft SQL, Exchange, Sonicwall, VMWare and Citrix. LANs, WANs, servers and network devices are all easy to monitor with PRTG, and there are many different metrics that it is able to monitor.
Who is it recommended for?
PRTG is ideal for IT professionals who require a detailed and customizable network monitoring solution. Its ability to support a wide range of devices and protocols makes it suitable for diverse IT infrastructures, from small businesses to large enterprises.
Pros:
- Uses a combination of packet sniffing, WMI, and SNMP to scan IP addresses as well as measure device performance
- Fully customizable dashboard is great for both lone administrators as well as NOC teams
- Drag and drop editor makes it easy to build custom views and reports
- Supports a wide range of alert integrations such as SMS, email, and integrations into platforms like Slack
- Supports a freeware version
Cons:
- Is a very detailed platform with many features that require time to learn
Pricing: First 10 Sensors FREE and Pricing starts at $1600 for 500 sensors. You can assess your network requirements with a 30-day free trial.
Download: https://www.paessler.com/download/prtg-download?download=1
![]()
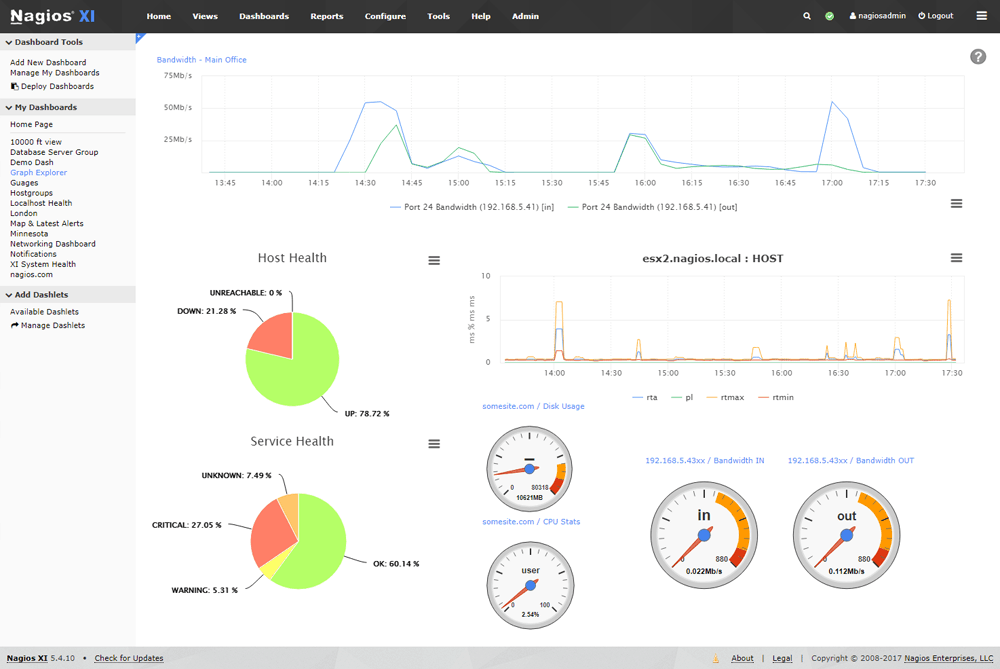
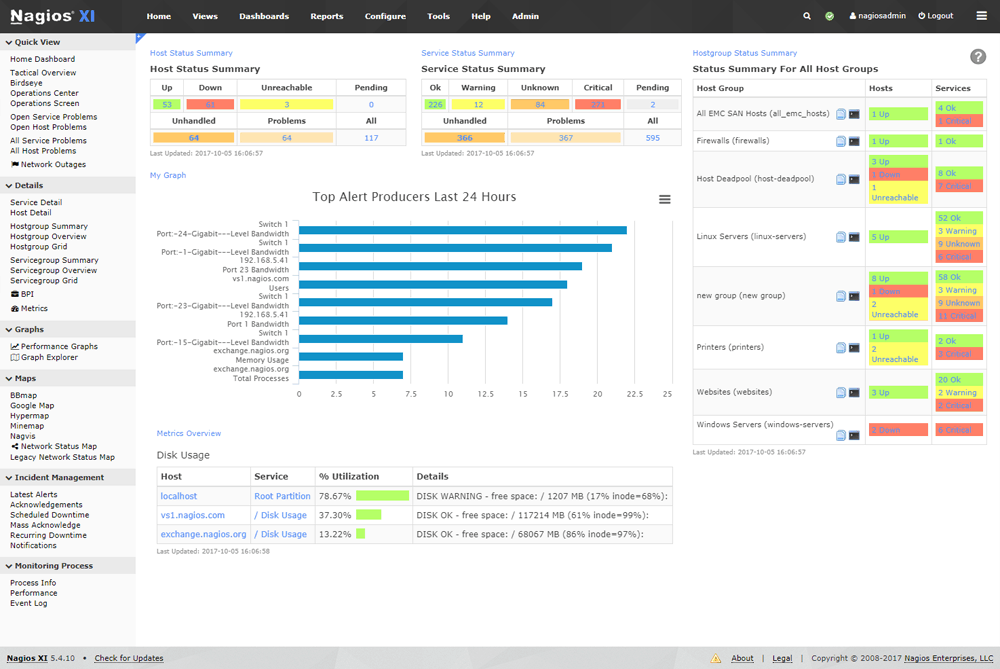
4. Nagios Network Analyzer
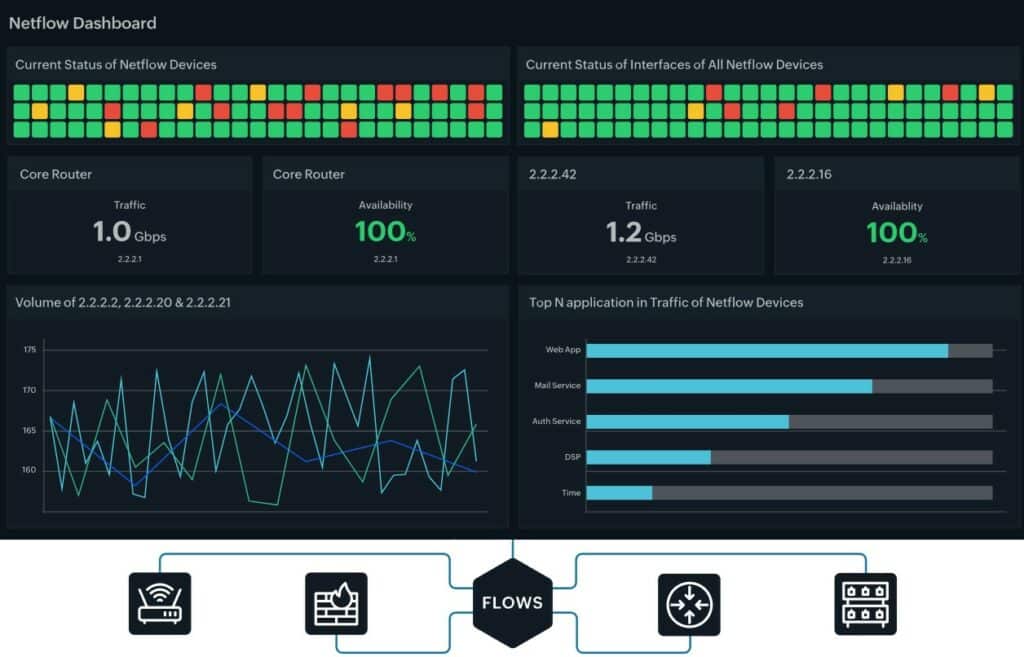
Nagios Network Analyzer offers detailed and comprehensive insight into all of your network’s traffic, such as potential security threats and vulnerabilities. This allows IT administrators to act quickly and ascertain exactly what the current state of their network is at any time. This information is highly detailed, and allows for items to be drilled down into and further analyzed.
The design of the application has been structured in such a way so that users can navigate its many options through an intuitive and easy to use interface. Network Analyzer seamlessly integrates with Nagios, giving your team an invaluable IP based monitoring tool. Network Analyzer allows system administrators to look at their entire network from a central location and view exactly what is going on within the network.
Key features:
- Comprehensive Dashboard
- Security and Reliability
- Advanced Visualizations
- Custom Application Monitoring
- Specialized Views
- Automated Alert System
- Nagios XI Integration
Why do we recommend it?
Nagios Network Analyzer is recommended for its in-depth insight into network traffic, security threats, and vulnerabilities. Its adaptable design and advanced visualization tools provide a detailed analysis of network performance, making it a powerful tool for proactive network management.
There are alerts and triggers that allow for mail and warnings to be sent through whenever a certain event takes place on your network so that you are always made aware of any issues on the network as they occur.
The adaptable design of Network Analyzer lets you customize the way that it displays its data to you, with Source Groups allowing administrators to organize specific groups of items that are similar to one another within a larger nested hierarchy.
This allows Network Analyzer to send through SNMP requests which allows your team to get a true idea of what is happening within your operating environment.
One of the biggest selling points with this application is the stellar bandwidth monitoring capabilities that it has built into it. It is more than just a total data usage meter, and it allows you to see exactly how much data is consumed on your network from each individual IP address. Network Analyzer keeps records of ALL of your internet traffic, so you can find out exactly what is causing your internet usage woes on your network, saving you money and network capacity.
Who is it recommended for?
This tool is well-suited for IT administrators and network professionals who require a detailed analysis of network traffic and security. Its flexibility and detailed reporting capabilities make it particularly useful for environments where security and reliability are paramount.
Pros:
- Offers a free open-source version alongside a paid version
- Pricing is based on the number of flow exports, making it a flexible option
- Detailed reports and alerting options
- Can record live J-Flow traffic and replay it for further analysis.
Cons:
- Better suited for smaller networks
Pricing: The single licensing price is $1,995 and must be used in conjunction with Nagios XI.
Download: https://www.nagios.com/products/nagios-network-analyzer/
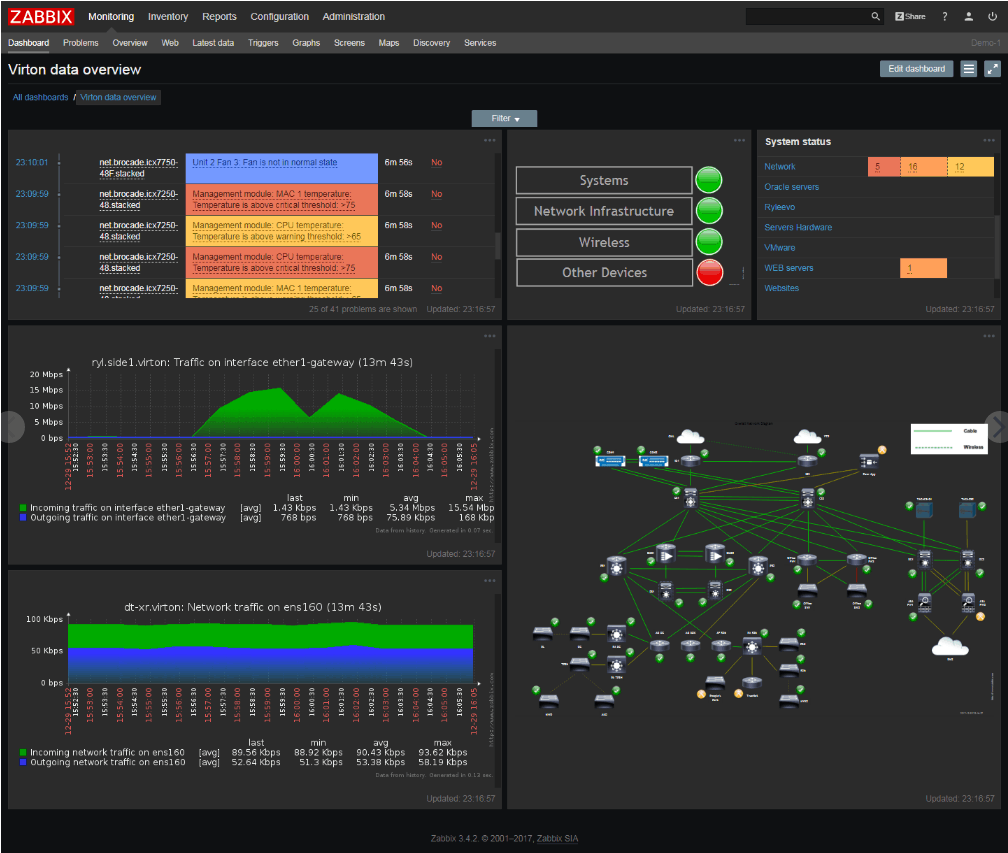
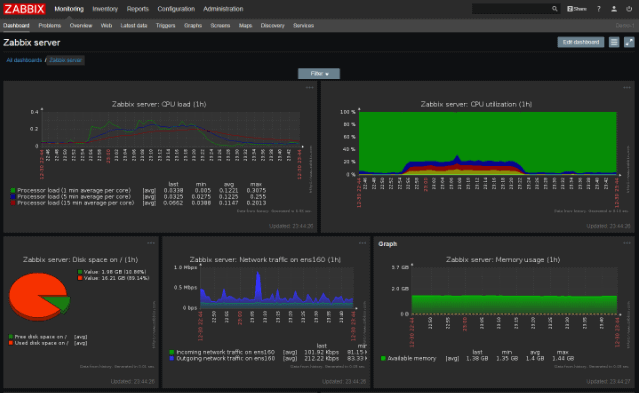
5. Zabbix
Zabbix is a monitoring system that provides your networking team with all of the tools and information that that could ever need. It uses a range of different technologies, including SNMP Scanner Functionality, IPMI, Active and Passive modes, and it has IPv6 support as well.
The way in which Zabbix collects data is both flexible and extendable, giving you both a calculated and aggregated set of metrics. Which can give you fine details such as data between two ports on the same switch, or total data connecting to your internet connection.
Key Features:
- WAN and LAN Network Bandwidth Usage
- Packet Loss Rate
- Interface Error Rates
- Link Statuses
- System Statuses
- Configuration Changes
Why do we recommend it?
Zabbix is recommended for its comprehensive and transparent monitoring system. It excels in flexibility, offering a range of data collection methods and supporting a wide variety of network devices. The tool's open-source nature and extensive template library make it highly customizable and adaptable to various network environments.
Auto-discovery is on point, which lets your network devices be detected on the fly, as they are added, with no additional configuration required. It is also able to detect if networking equipment such as network switches are added, replaced, or swapped out with a different unit.
It is also able to detect device configuration changes such as software and firmware changes to devices.
This is all made easier by using the included template feature, which starts monitoring specific devices straight out of the box.
This means that you can apply templates to multiple devices that share the same data collection requirements, which takes out the manual element from configuring your network monitoring system.
On the support side of the spectrum, there are many tools that Zabbix offers to its users to allow them to effectively manage specific states on the network. This is done through the use of Flexible Problem Definitions, which create complex logical expressions of statistics on the network. This can lead to better fault detection, and less false positives.
Who is it recommended for?
Zabbix is ideal for network administrators who prefer an open-source tool with broad monitoring capabilities. Its ability to handle complex network environments with flexible problem definitions and fault detection makes it suitable for medium to large-sized networks.
Pros:
- Open-source transparent tool
- Uses both SNMP and ICMP for broader monitoring ranges
- Offers useful templates for quick insights
Cons:
- No paid support option – not ideal for large enterprise environments
Pricing: Zabbix is open source and is essentially free to download and configure for yourself.
Download: https://www.zabbix.com/network_monitoring
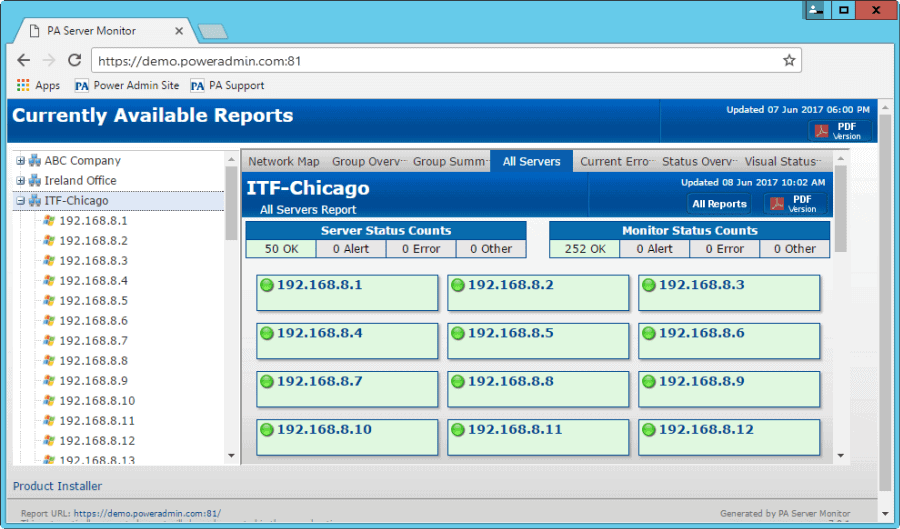
6. PowerAdmin
PowerAdmin manages to cram in all of the functionality of a server monitoring suite, with a network monitoring system, and a remote desktop system as well. This means that the system can monitor all of your network devices, as well as Windows and Linux servers. In addition to this, network devices such as routers and switches are monitored via ping and SNMP, which provides a wide view of your network environment.
Key Features:
- Central Monitoring
- No incoming port configs required
- Connect to servers and network devices
- Local install only – No Cloud-based services
- Attractive Reporting systems
- Web-based access
Why do we recommend it?
PowerAdmin is recommended for its comprehensive functionality that combines server and network monitoring with a remote desktop system. Its agentless monitoring, hierarchical permissions structure, and extensive alerting options make it a robust choice for enterprise-level network management.
This product has been designed with enterprise clients in mind, and this is good news if you plan on rolling this out on your very own network. It uses a distributed server monitoring model, which means that it is agentless and requires no installation on target devices.
If your main monitoring server should fail for any reason, then a standby server can be configured to take over automatically. This is very important for organizations that cannot have their logs and monitoring go offline at all.
There is a built-in hierarchical permissions structure that limits who can see what, depending on the access levels. This means that you can create specific roles that have certain permissions, and then assign each user a specific role.
SNMP and traps, in conjunction with a syslog server means that you can monitor a whole range of devices all at the same time.
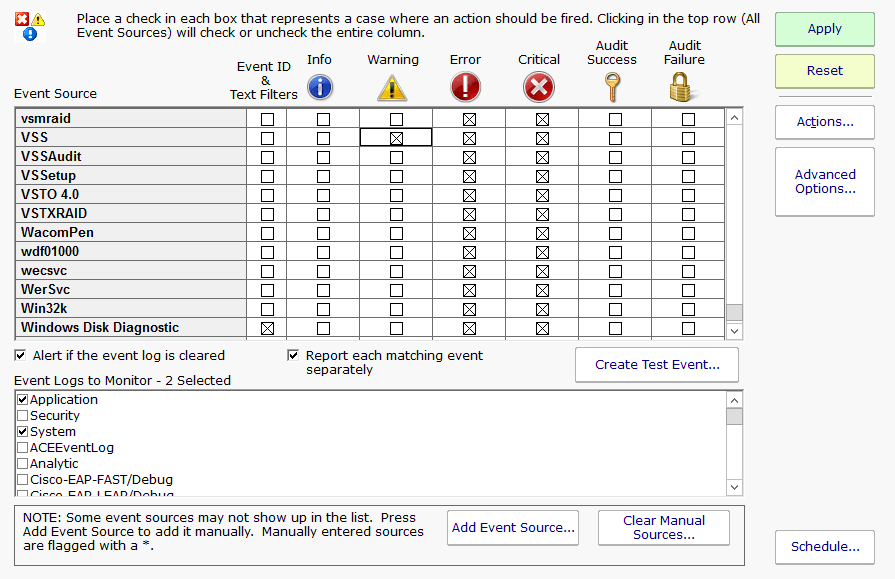
Email alerts can be configured to warn you when any devices on your network happen to go offline, so you can always be kept in the loop if anything happens when you are not expecting it.
Who is it recommended for?
This tool is particularly suitable for larger enterprises that require a versatile and scalable monitoring solution. Its capacity to monitor a wide range of devices and servers, alongside user role management, makes it ideal for organizations with complex IT infrastructures.
Pros:
- A lightweight tool, takes up very little space and system resources
- Supports testing multiple hosts at the same time
- Uses threshold-based alerting to keep repeat alarms to a minimum
Cons:
- Lacks advanced features found in higher-end tools
Pricing: Pricing starts at $125 per seat for the Ultra edition, and discounts apply when you purchase over 9.
Download: https://www.poweradmin.com/products/server-monitoring/
Conclusion
Keeping tabs on your network via IP Monitoring is the number one method of ensuring that you know exactly what is happening on your network. Finding the right application to help you make the most of your environment is crucial, so be sure to look over all of the features for each product when you are making a decision to see which one is best for your environment.
IP monitoring gives you a full picture of what has been occurring within your systems, and when you introduce IP logging systems to a network you can really take control of both user behavior as well as application and network resources.
IP based monitoring is also the best way to monitor the up-time of any of your critical network infrastructure equipment, so you can’t go wrong with implementing one of these systems within your organization.
IP Monitoring Tools FAQs
What is IP monitoring?
IP monitoring is the process of monitoring the availability and performance of IP-enabled devices on a network. This can include routers, switches, servers, and other network devices.
Why is IP monitoring important?
IP monitoring is important because it helps ensure the reliability and performance of network devices and infrastructure. By monitoring IP-enabled devices, organizations can identify and troubleshoot issues more quickly and proactively, reducing downtime and improving productivity.
What are some common metrics used in IP monitoring?
Common metrics used in IP monitoring include uptime, packet loss rate, response time, and bandwidth utilization. These metrics provide insights into the availability and performance of network devices and infrastructure.
What tools can be used for IP monitoring?
There are many tools available for IP monitoring, including commercial software solutions and open-source tools. Some examples of commercial IP monitoring tools include SolarWinds Network Performance Monitor, PRTG Network Monitor, and Nagios XI. Open-source tools include Zabbix, Icinga, and OpenNMS.
How does IP monitoring work?
IP monitoring works by sending packets of data to network devices and measuring the response time and packet loss rate. It can also collect data on bandwidth utilization and other performance metrics. This data is then analyzed and used to generate alerts or reports on any issues or anomalies detected.
What are some best practices for IP monitoring?
Some best practices for IP monitoring include monitoring key network devices and infrastructure components, setting appropriate alert thresholds to minimize false positives, using automated monitoring tools to reduce the risk of human error, and regularly reviewing and updating monitoring criteria to ensure they are effective and up-to-date. It's also important to have a clear plan in place for responding to any network issues or incidents that may occur.


