
Over the years, networks have become complex and widespread. Also, the emergence of the work-from-anywhere culture has further widened the endpoints of these networks. All this means that monitoring the health and performance of your network requires advanced tools and automation workflows.
One such category of tools that have become indispensable for today's networks is observability platforms. These tools collect data across different sources and aggregate them to find meaningful insights and patterns that can be translated into actionable items, KPIs, and events. As you can see, this information measures the performance of systems and also helps to identify vulnerabilities that may emerge at any time.
Two such popular observability platforms are LogicMonitor and Datadog. Both tools come with extensive capabilities to collect data, analyze them, and present the same in an easy-to-understand format. So, which of the two should you choose and why?
Read on for a head-to-head comparison of the two platforms.
What's LogicMonitor?
LogicMonitor is a cloud-based observability platform that provides complete visibility of your entire infrastructure. It brings together data from different sources to help you quickly identify and resolve issues before they impact a wider audience. It helps with improving your overall operational efficiency as well.
Key Features
- Agentless Data Gathering: Harnesses scalable collectors to efficiently aggregate data from diverse assets without needing agents.
- Dynamic Device Tracking: Automatically identifies and commences real-time monitoring of newly connected devices.
- Flexible Deployment: Excellently adapts to hybrid, cloud, and on-prem environments for comprehensive oversight.
- Proactive AI Monitoring: Leverages artificial intelligence for anticipatory problem detection and mitigation.
- Anomaly Insights: Identifies and contextualizes anomalies, streamlining the troubleshooting process.
- Robust Infrastructure Compatibility: Capably accommodates and monitors complex infrastructure setups.
- Personalized Dashboards: Offers customizable dashboards enhanced with drag-and-drop functionality for tailored insights.
- Smart Alert System: Generates targeted alerts to effectively reduce notification overload.
- Capacity Forecasting: Assists in forecasting and capacity planning with advanced predictive analytics.
- Workflow Efficiency: Enhances operational efficiency with seamless integrations across a wide range of apps and services.
Pros:
- Comprehensive Asset Visibility: Delivers extensive insight into all infrastructure components, facilitating swift issue resolution.
- Real-time Updates: Ensures immediate awareness and monitoring of new devices, maintaining up-to-date infrastructure oversight.
- Efficiency in Operations: Improves operational productivity by combining data insights from various sources into a unified platform.
Cons:
- Complex Interface: The breadth of features and customization options might present a steep learning curve for new users.
- Notification Management: While designed to reduce alert fatigue, the alert system's comprehensiveness may require fine-tuning to avoid overwhelming users.
Moving on, let's see what Datadog is.
What's Datadog?
Datadog is also a cloud-based monitoring and analytics tool that can monitor events and services, besides aggregating and analyzing metrics to get meaningful insights. Its modern security and monitoring capabilities enable you to take a peek into any stack, device, or app at any time.
Key Features
- Scalable Data Collection: Leverages agentless collectors to efficiently aggregate data across all assets.
- Dynamic Discovery: Automatically identifies and begins real-time monitoring of new devices.
- Versatile Deployment: Seamlessly operates across hybrid, cloud, and on-premises environments.
- AI-Driven Monitoring: Employs artificial intelligence for proactive anomaly detection and issue resolution.
- Anomaly Detection: Pinpoints and contextualizes anomalies for streamlined troubleshooting.
- Infrastructure Adaptability: Supports monitoring for complex and diverse infrastructure setups.
- Customizable Dashboards: Offers highly customizable dashboards with drag-and-drop functionality for personalized views.
- Intelligent Alerts: Generates targeted alerts to minimize alert fatigue and ensure timely issue resolution.
- Forecasting and Planning: Provides tools for accurate forecasting and capacity planning.
- Extensive Integrations: Facilitates workflow efficiency through integrations with a wide array of applications and services.
Pros:
- Comprehensive Visibility: Delivers full observability across the entire IT infrastructure, enhancing issue detection and resolution.
- Real-time Monitoring: Ensures up-to-date device monitoring and management, fostering immediate responses to new changes or threats.
- Operational Efficiency: Aids in improving overall operational efficiency by centralizing data from various sources into a single, intuitive platform.
Cons:
- Complex Interface: The platform's comprehensive feature set may present a steep learning curve for new users.
- Alert Management: While designed to reduce alert fatigue, the extensive alert system may require initial adjustment to tailor it to specific needs.
Thus, these are some of the features of Datadog.
At first glance, both LogicMonitor and Datadog may seem identical, but a closer look shows that there are many differences between the two platforms, though they essentially perform similar functions. So, how are they different? In what situations, should you choose one over the other?
Let's explore the answers to these questions.
LogicMonitor vs Datadog
In this section, we will compare LogicMonitor and Datadog against many aspects to understand which is a better option for your business.
User Interface
The user interface is a module that most users interact with, and hence, it's important to have an interface that gives the information you need without looking too cluttered. On this front, both LogicMonitor and Datadog are good, but there's always room for improvement.
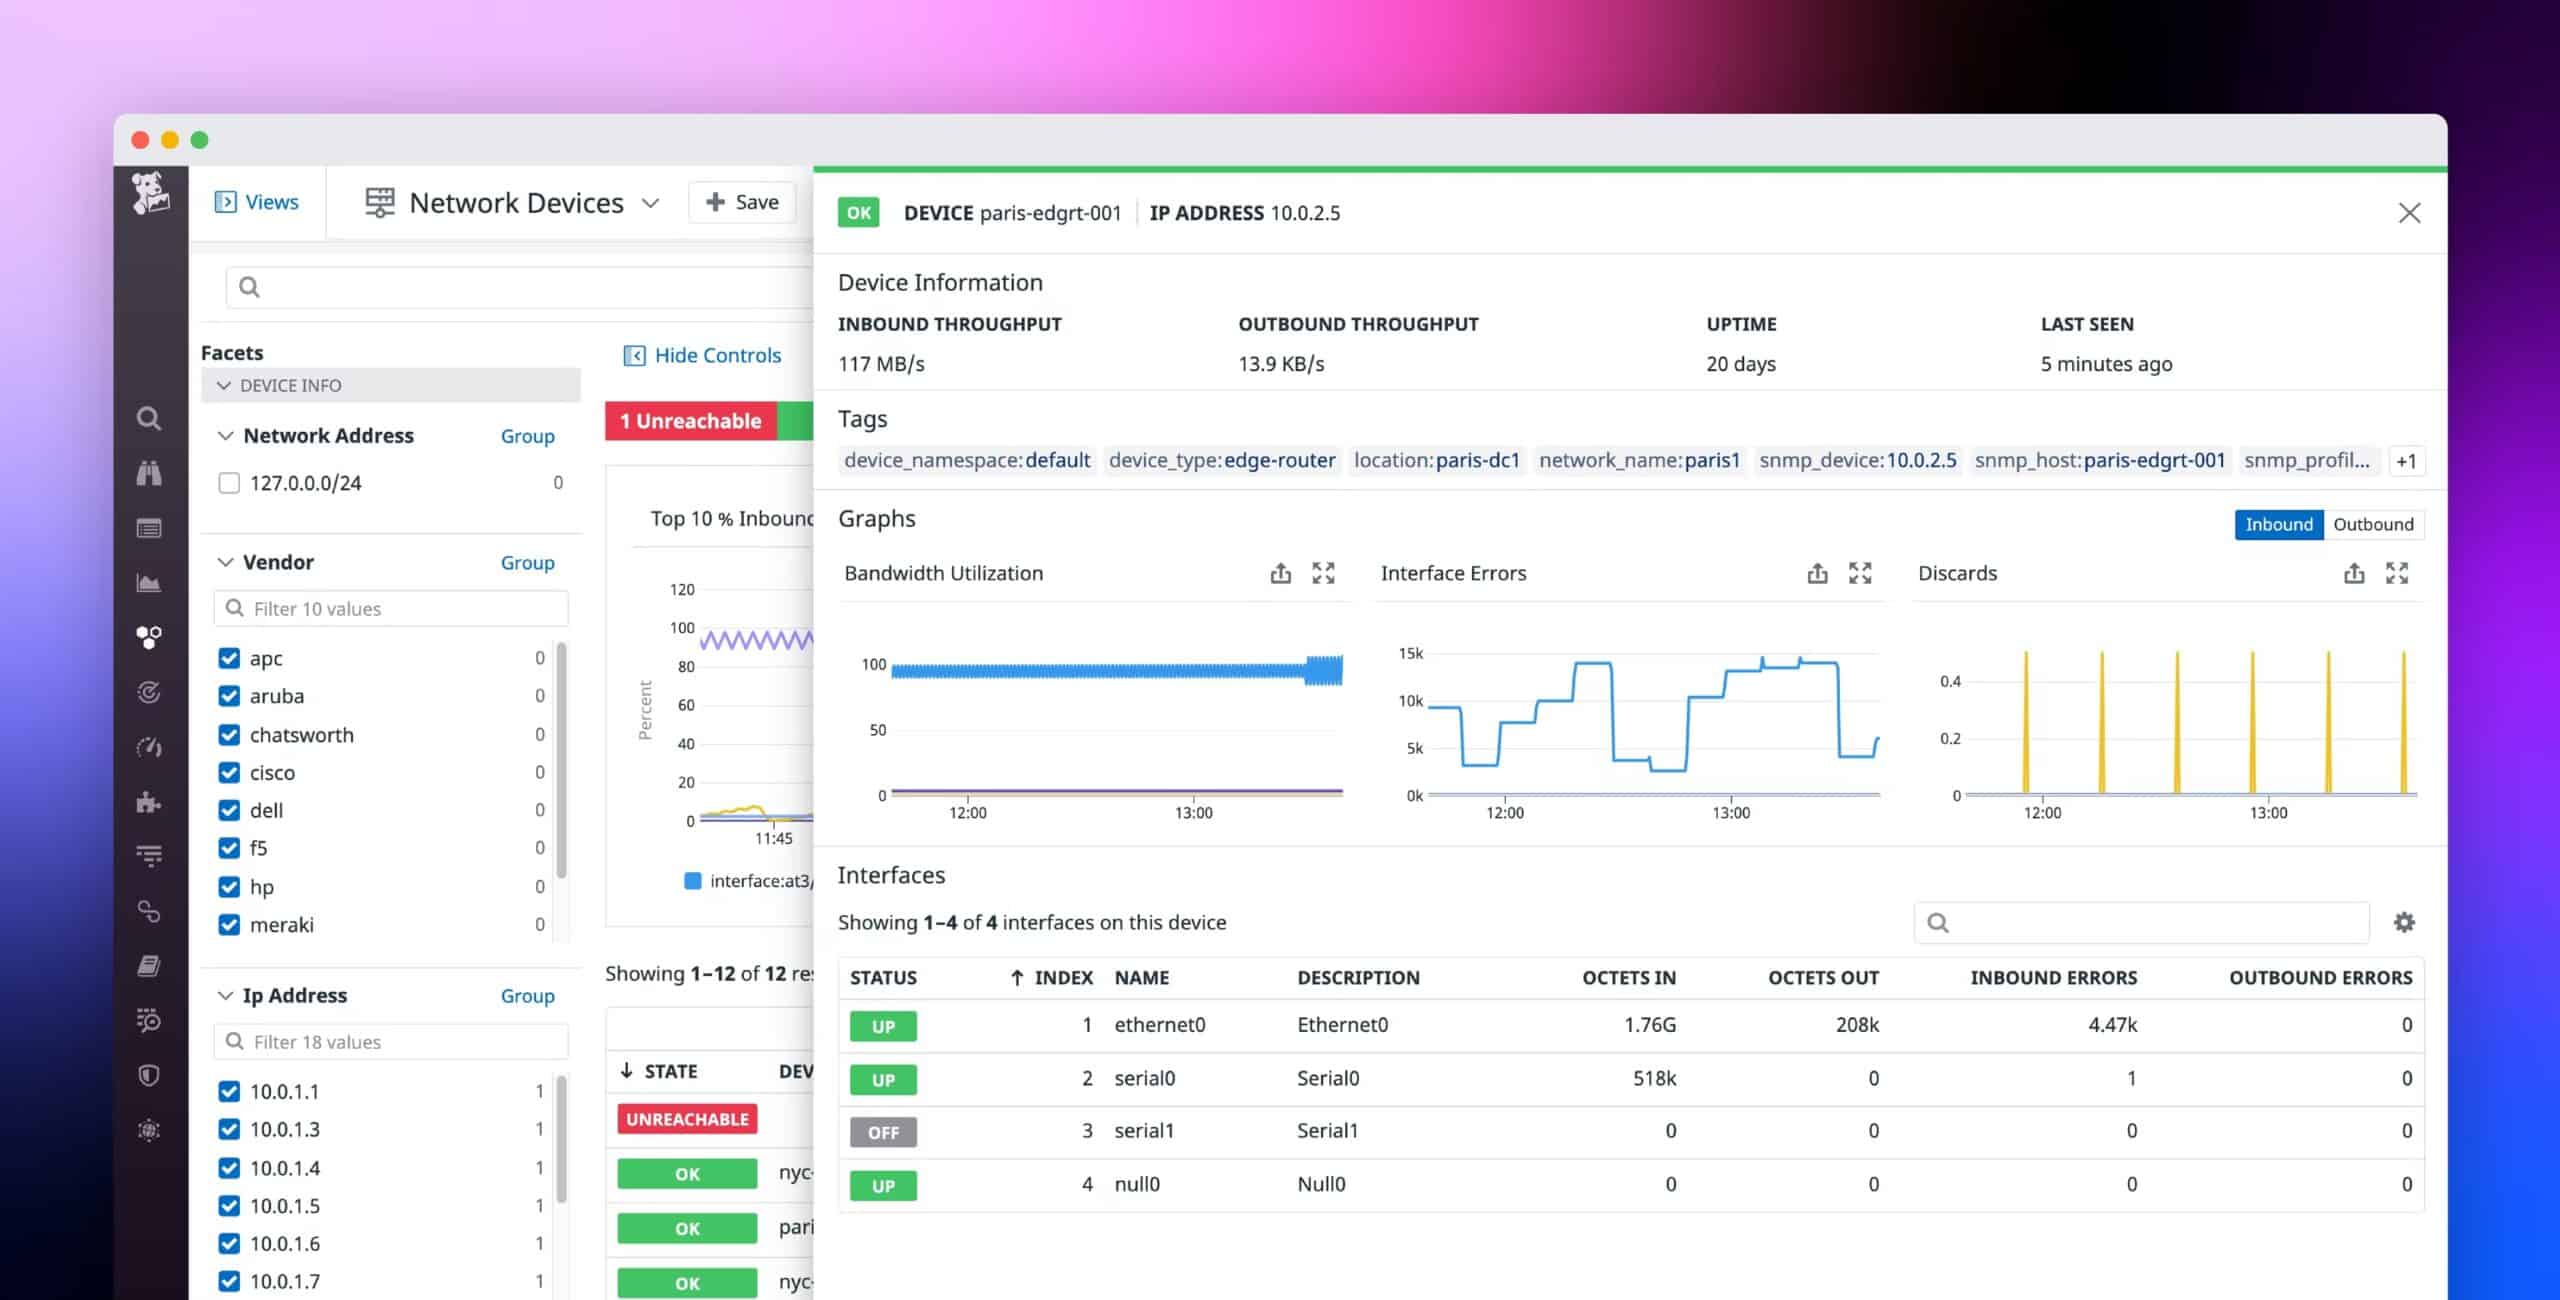
Datadog's user interface is simple and intuitive. It acts as a centralized point for viewing all information about your infrastructure. These dashboards and views are also customizable, so you get to see just what you want. No technical knowledge or coding is required, and this makes it a good choice for all kinds of users. That said, it would help if Datadog can display more data such as host information and network maps.
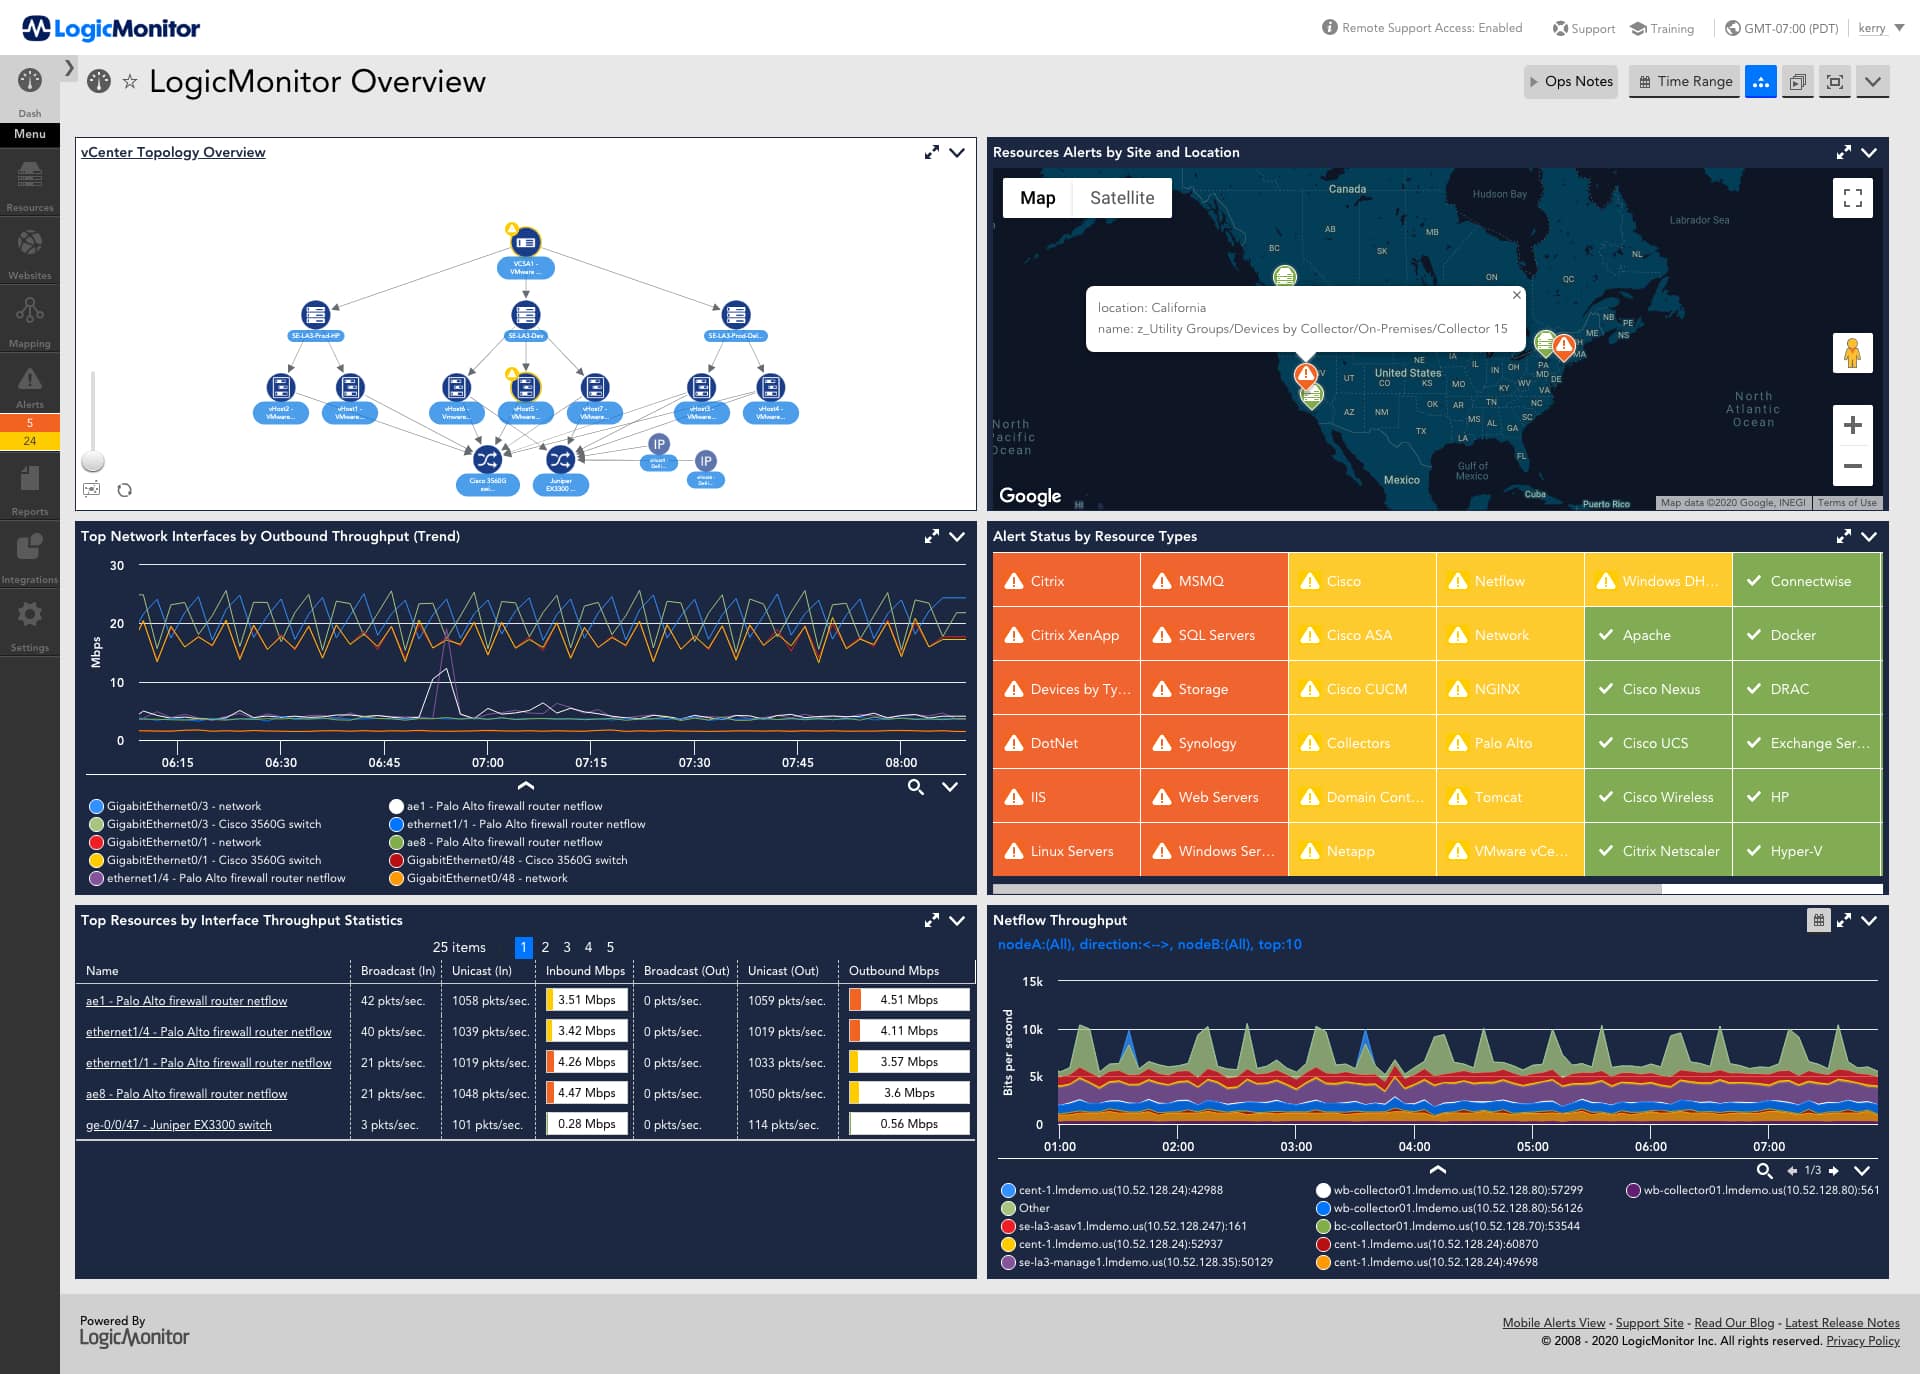
Moving on to LogicMonitor, the user interface loads quickly and is well-designed. Also, it displays all the pertinent information in a single pane to understand the state of your systems at a glance. One downside is that the navigation on the left side is confusing, as every option opens a new view. This can be a bit too much for people with limited technical knowledge. Also, it's not very intuitive either.
So, which of the two is better when it comes to the user interface? Maybe Datadog has an edge here because the information it displays is well-structured and clean as opposed to the clutter and confusion of some LogicMonitor views. But it would augur well for Datadog to include more information in its dashboard in the future.
Reports
Reports are necessary to gauge your performance against established thresholds, so you can improve accordingly. These reports also help with internal auditing and compliance.
LogicMonitor's reports are extensive and come in standard formats for easy compliance with different industry standards. You can also format data the way you want, so there's some flexibility for customization. Alternatively, you can choose from preset reporting templates such as resource configuration, user data, and more.
Datadog offers a lot more flexibility when it comes to customizing your reports. Besides the existing templates, Datadog supports the use of Log Analytics API to create custom reports that meet your specific internal and external needs. You can even schedule reports to be sent through email, thanks to its integration with Datadog Reporter. Finally, there's no limit to the number of reports you can generate or send to users.
When you compare the reporting features of both platforms, Datadog has an edge, especially when you want to create custom reports. Otherwise, the templated reports are more or less the same on both platforms.
Monitoring
This is the core functionality of both platforms, and they fare well on this front. Both use Artificial Intelligence (AI) and Machine Learning (ML) capabilities to make sense of the analyzed data. These values are compared against established thresholds to understand the variations and the reasons for the same. In case of any major deviations, these platforms send an alert with the related contextual information, so the issue can be fixed right away.
When you compare the two platforms, there aren't many differences in their capabilities. Both work well across different environments such as on-premises, hybrid, and cloud, and they are easy to install, given that both are SaaS-based tools.
Some minor differences do exist though. Datadog offers a feature called Live Process Monitoring where you can assess the impact of every process on the tech stack. Also, it works well on IoT platforms and multi-cloud environments. Due to these two aspects, Datadog can be seen as a better option than LogicMonitor, especially if the above aspects are pertinent for you.
Operating Systems
The choice of the platform could depend greatly on the underlying operating system you use. LogicMonitor mostly runs on Windows and Linux while Datadog works across many different operating systems such as Solaris, Ubuntu, Unix, and more.
So, if you're using Windows, both platforms would work well. But if you're using Linux, you might want to check which flavor and variation is supported by Datadog and LogicMonitor. For any other operating system, Datadog is your choice.
Customer Support
Customer support is good on both platforms. In LogicMonitor, you can reach out to the support team through phone, email, and chat while in Datadog, chat, and email are the only options available. The phone option is available only in the highest pricing plan. In general, both platforms offer good support for queries.
Integrations and Plugins
Integrations and plugins extend the functionality of an existing platform, so you can do more things through it. When you compare the two platforms on this front, LogicMonitor is the clear winner as it integrates with more than 2000+ services and products when compared to around 450+ of Datadog.
Undoubtedly, more options open up with LogicMonitor and this is why LogicMonitor is a winner in this aspect.
Thus, this is how the two platforms stack against each other on the above-mentioned aspects.
So, which of the two should you choose? The answer depends on what's important to you. For example, if integration with a ton of tools is important, LogicMonitor may be a better choice than Datadog as it's more likely to integrate with all those tools. But, if you want to create more custom reports, Datadog is the choice.
It's always a good idea to start with a list of features that you want in a monitoring platform, so you can pick the platform that matches most or all of your required features.
Final Thoughts
To conclude, both Datadog and LogicMonitor are comprehensive monitoring and observability platforms that offer the insights you need about your infrastructure. They also generate reports, send alerts, provide context, and more. However, when you compare the two, there are many differences between the two platforms, so from an organization's standpoint, it makes sense to choose the one that better fits your needs.
We hope these pointers come in handy for your decision-making. Click here to read through more of our comparison guides.


