
MySQL is a powerful and robust open-source database management system that offers assistance to those companies and industries that need help to run several distinct applications such as ERP storage systems and websites.
Here are the best MySQL Monitoring tools and software:
- Paessler PRTG – EDITOR'S CHOICE This package is a bundle of monitoring services that includes sensors for MySQL monitoring. The service is also able to monitor MariaDB, SQL Server, PostgreSQL, and Oracle databases. Available as a SaaS platform or for installation on Windows Server. Download a 30-day free trial.
- ManageEngine Applications Manager – FREE TRIAL This package of application monitors can watch over a range of systems, including databases. Available for Windows Server, Linux, AWS, and Azure. Start a 30-day free trial.
- Site24x7 – FREE TRIAL This cloud platform provides MySQL monitoring through a plugin, which extracts activity and performance data from the logs of your database instances. Start a 30-day free trial.
- Datadog MySQL Monitoring Cloud-based MySQL monitoring system that makes queries inside the database to keep an eye on table sizes and object quantities.
- Idera SQL Diagnostic Manager for MySQL A monitoring system for MySQL databases that also offers diagnostic facilities. Runs on Windows, Windows Server & Linux.
- Sematext MySQL Monitoring Full-stack performance monitoring system that monitors MySQL performance along with logs, events and metrics.
- Percona Monitoring and Management Tool Open-source monitoring software tool that provides a dashboard to monitor MySQL performance.
- SolarWinds Database Performance Monitor This SaaS package implements performance tuning for a range of DBMSs, including MySQL.
- MySQL Monitor tool from Monyog Powerful monitoring tool that makes it easier to troubleshoot any errors or issues and fix them as soon as possible.
- SQL PowerTools Lightweight and “zero impact database monitoring” tool that allows you to catch each MySQL activity and end-user response time.
- VividCortex MySQL Analyzer Another MySQL performance analyzer tool that allows you to monitor slow queries, latency, disk health, replication health, errors, and many more.
DBMSs (Database management systems) such as MySQL are a crucial resource for each organization. This is because it performs many vital tasks to help the application run seamlessly. It is essential because MySQL tools make sure that your DBMS is in a healthy state 24/7.
This guide lists the best MySQL management and performance monitoring tools that will assist you to dial in each of your SQL servers along with the fine and smooth tuning in terms of their speed and performance.
Best MySQL Tools
Our methodology for selecting MySQL monitoring tools
We reviewed the market for MySQL monitoring software and analyzed the options based on the following criteria:
- Performance monitoring for MySQL databases
- Examination of connected applications and their performance
- Tracking of server resource usage, linked to database activities
- SQL query analysis
- Database object analysis and tuning
- A free trial or a demo for a cost-free assessment opportunity
- Value for money from a MySQL monitor that improves performance and supports the business
Below are the best MySQL management and performance tools that come with huge benefits.
1. Paessler PRTG – FREE TRIAL
Paessler PRTG MySQL Monitoring is one of the many sensors contained in the PRTG package. The full bundle includes monitoring systems for networks, servers, and applications.

This tool looks at database instance activity in terms of memory and disk space usage and also response times. It lets you set up your own queries to run on system tables and it will run them periodically and report on these new metrics.
The wider package includes database sensors for SQL Server, MariaDB, PostgreSQL, and Oracle databases. In addition to database monitoring, this package has units that monitor other applications, such as Web servers or virtualization systems. The bundle also includes monitoring tools for servers and networks.
Pros:
- Monitoring for multiple DBMSs, including MySQL, MariaDB, SQL Server, Oracle, and PostgreSQL
- Full stack monitoring for networks, servers, and applications
- Alerts that warn of resource shortages or performance dips
- Deployment options offering a SaaS platform or a software package
- Access to database logs through the MySQL monitoring screen
Cons:
- No on-premises package for Linux or macOS
Paessler PRTG is available as a SaaS platform or as software for Windows Server. The package is free to use forever if you only activate 100 sensors. You can get a 30-day free trial of PRTG with all of the sensors activated.
EDITOR'S CHOICE
Paessler PRTG is our top pick for a MySQL monitoring tool because the service is a module in a larger package of IT asset management systems. The system can monitor multiple DBMSs simultaneously and also monitor the systems that rely on those databases at the same time. The tool looks at resource usage within database instances and you can activate server monitoring sensors to see how your databases impact server resources. Every monitoring module includes performance thresholds that will trigger alerts if they are crossed. The system provides root cause analysis because a component fault that is at the core of a system problem will trigger an alert first. This system is highly customizable and the buyer decides which modules to activate. The package can be used for free if only 100 sensors are activated.
Download: Access a 30-day FREE Trial
Official Site: https://www.paessler.com/download/prtg-download?download=1
OS: Windows Server or cloud
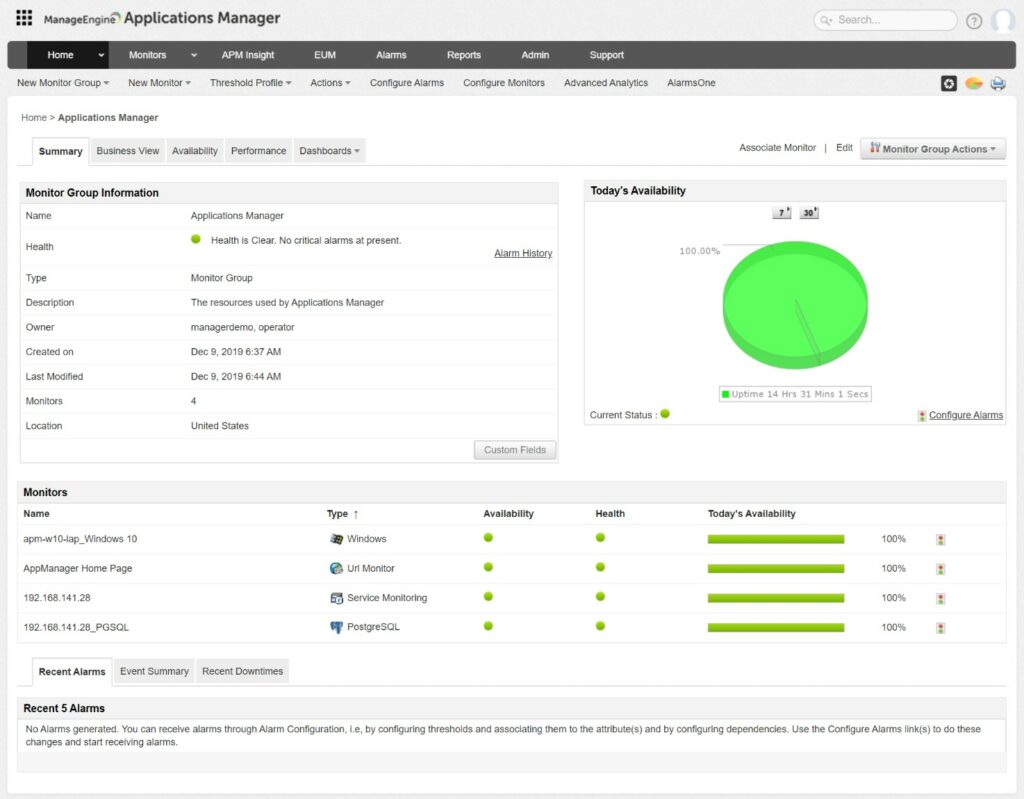
2. ManageEngine Applications Manager – FREE TRIAL
ManageEngine Applications Manager monitors a range of applications, including databases. This system can monitor MySQL as well as Oracle, SQL Server, and PostgreSQL.
Unique Feature
The highlights of this tool are its easy-to-use interface and affordability, making it within the reach of businesses of all sizes.
Why do we recommend it?
This tool is known to identify slow-running queries and can provide the root cause behind performance issues. It also helps ensure maximum uptime.
The Applications Manager can be used to monitor the Community Server and Enterprise Server editions of MySQL. The system will record connection details, cache information, session data, and database and index sizes.
A query monitoring tool in the package helps you analyze activities to enable efficiency improvements. As this package also monitors server resource usage, you can relate MySQL database requirements with server resource availability.

Who is it recommended for?
Ideal for DB admins who want to constantly evaluate the performance of their MySQL servers and identify issues right away.
Pros:
- Offers on-premise and cloud deployment options, giving companies more choices for install
- Can highlight interdependencies between applications to map out how performance issues can impact businesses operations
- Offers log monitoring to track metrics like memory usage, disk IO, and cache status, providing a holistic view into your database health
- Can automatically detect databases, server hardware, and devices in real-time
Cons:
- Can take time to fully explore all features and options available
You can use Applications Manager for free. The Free edition covers up to five assets and it includes MySQL monitoring. The paid version is called the Professional edition and you can assess it on a 30-day free trial.
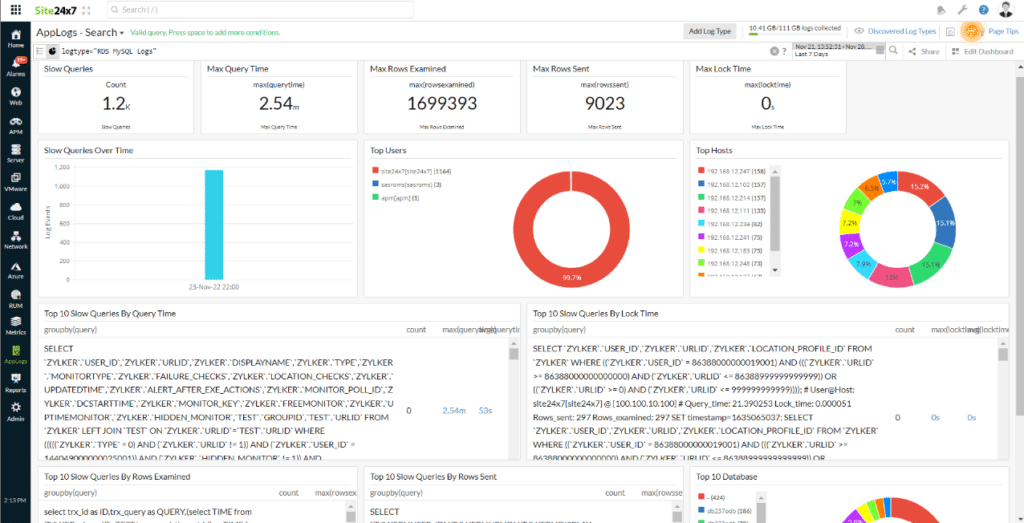
3. Site24x7 – FREE TRIAL
Site24x7 is a cloud platform that provides combination packs of its modules for network, server, application, and website monitoring. The system can be expanded to track the performance of specific technology and products. This is available for MySQL databases from a plug-in.
Unique Feature
This tool is agentless and helps to monitor the performance of your MySQL database environments.
Why do we recommend it?
Site24X7 is a comprehensive database monitoring tool that optimizes the performance of your MySQL databases. It analyzes your tables and provides insights into the possible areas of improvement.
This system uses an agent to collect data. This is a Python program and it is available for Windows Server and Linux. You can also install it on any cloud platform that runs either of those operating systems. The tool extracts data from database instance logs and interprets them into statistics about transactions in your databases. It is also possible to get the agent to upload logs to the Site24x7 Log Management service for further analysis.
You can combine MySQL monitoring with network and server resource tracking. Built-in alerts will identify the root cause of problems if your MySQL database performance drops.

Who is it recommended for?
Better suited for small and medium enterprises, as it minimizes overhead while scoring high on performance.
Pros:
- Full stack monitoring
- Transaction statistics
- Spots slow-running queries
- Alerts for performance problems
Cons:
- No on-site version
MySQL monitoring is available with any Site24x7 plan. You can examine the platform with a 30-day free trial.
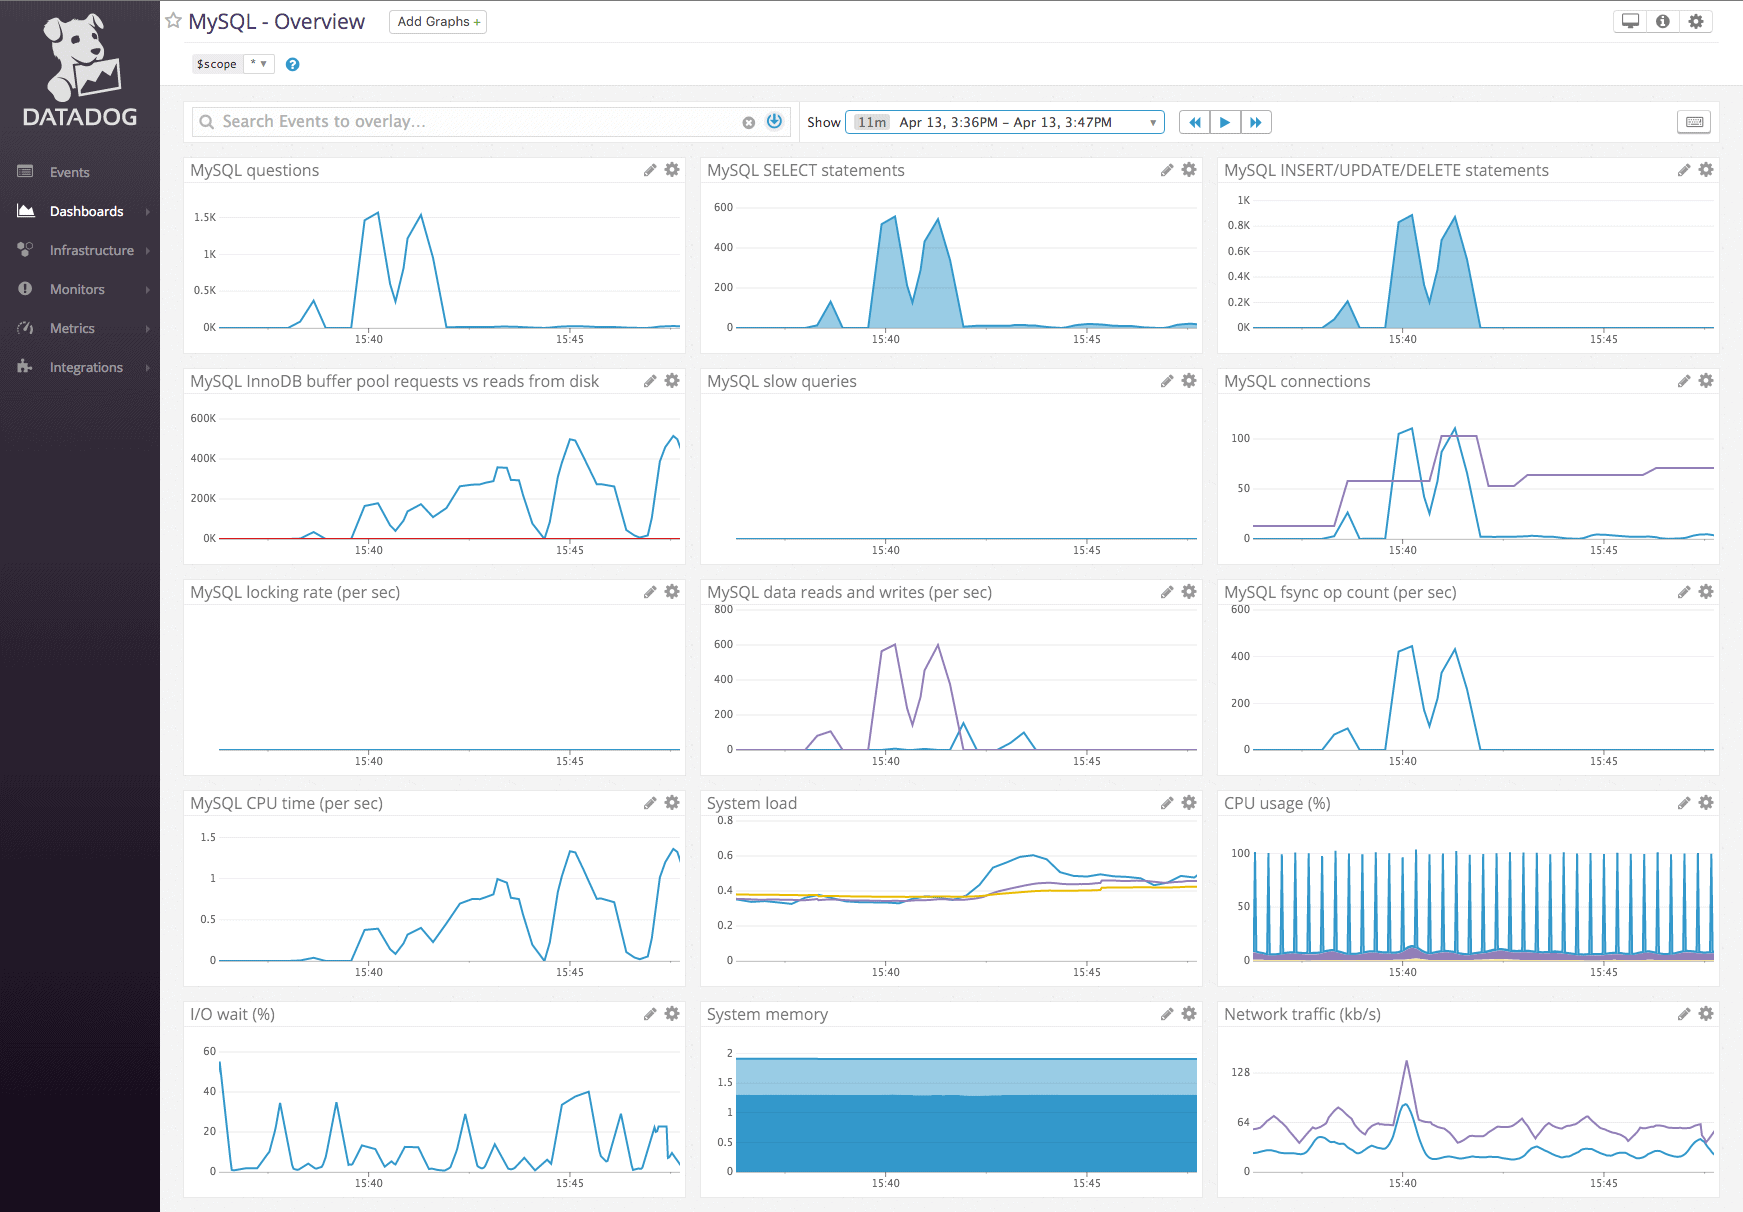
4. Datadog MySQL Monitoring
Datadog is primarily a cloud-based system management service that is accessible in multiple modules. MySQL monitoring is incorporated in the Datadog APM service. This is a popular application monitor that can be oriented by the vendor-specific plugins, known as the “integrations”.
Unique Feature
With its metrics, Datadog can enhance the health and performance of your databases.
Why do we recommend it?
Datadog provides comprehensive visibility into your MySQL databases and their current and historical performance. It also collects key metrics like throughput, latency, connections, and more.
This particular monitor makes consistent checks on a huge number of database statuses. These include buffer space, tablespace utilization, and disk activity.
Apart from this, the MySQL monitoring tool additionally makes queries inside the database to keep an eye on table sizes and object quantities. These tests are executed by a Datadog agent that installs on Linux, macOS, or Windows. Nevertheless, the refining of collected data is executed on the Datadog servers.
MySQL monitoring tool’s console is too hosted in the cloud. This is to avail its access from anywhere via any standard browser. The dashboard displays live statuses as appealing graphs along with highlighting conditions that have set foot into a worrying execution zone.

Who is it recommended for?
A good choice for organizations of all sizes that require extensive monitoring of their databases.
Pros:
- Easy-to-use customizable dashboards
- Cloud-based SaaS product allows monitoring with no server deployments or onboarding costs
- Offers specific agents and dashboards for MySQL monitoring
- Allows businesses to scale their monitoring efforts reliably through flexible pricing options
Cons:
- Would like to see a longer trial period for testing
Currently, Datadog provides a 14-day free trial to test its functionality.
5. Idera SQL Diagnostic Manager for MySQL
Idera SQL Diagnostic Manager for MySQL offers both monitoring and database analysis facilities that can help improve database speed by suggesting query improvements and new or adjusted database objects. This service is also able to gather, store, and manage database system logs. That data can be recalled for performance assessments.
Unique Feature
It helps in proactively identify issues that affect the database, so you can take remedial action accordingly.
Why do we recommend it?
This is an agentless monitoring tool that's well-suited for monitoring MySQL and MariaDB databases. Its robust diagnostics make it one of the most popular database monitoring tools today.
The Idera system shows SQL query execution and resource usage within the MySQL database as the query runs. This is a useful service for discovering what circumstances cause queries to run too long. The diagnostic tool lets you see whether you need to alter the query or add objects, such as indexes to the database to improve performance.
The tool also provides constant monitoring of database instances. The monitor will watch over automated database administration processes, such as backup or replication. If the monitor predicts that system resources are running short, it raises an alert.
Who is it recommended for?
Works well for organizations that use MySQL and MariaDB databases.
Pros:
- Simple, but powerful interface – great for new users
- Auto formatting and syntax color makes helps DBAs stay organized when at scale
- Offers numerous presets and recommendations to improve performance out of the box
- Supports collaboration with real-time feedback and team features
Cons:
- The trial could be longer
SQL Diagnostic Manager for MySQL installs on Windows, Windows Server and Linux. As well as monitoring MySQL databases, this service is able to supervise MariaDB, Aurora, Azure Database for MySQL, Amazon RDS, Google Cloud SQL for MySQL, and Oracle Cloud MySQL Cloud Service databases. This package is available for a 14-day free trial.
6. Sematext MySQL Monitoring
One of the over 100 Sematext monitoring integrations is MySQL monitoring. Hence, not only can you use Sematext for MySQL logs, but you can use it for MySQL performance metrics as well. In fact, you can use it for other infrastructure monitoring too. However, if you add an agent to it, it becomes open source.
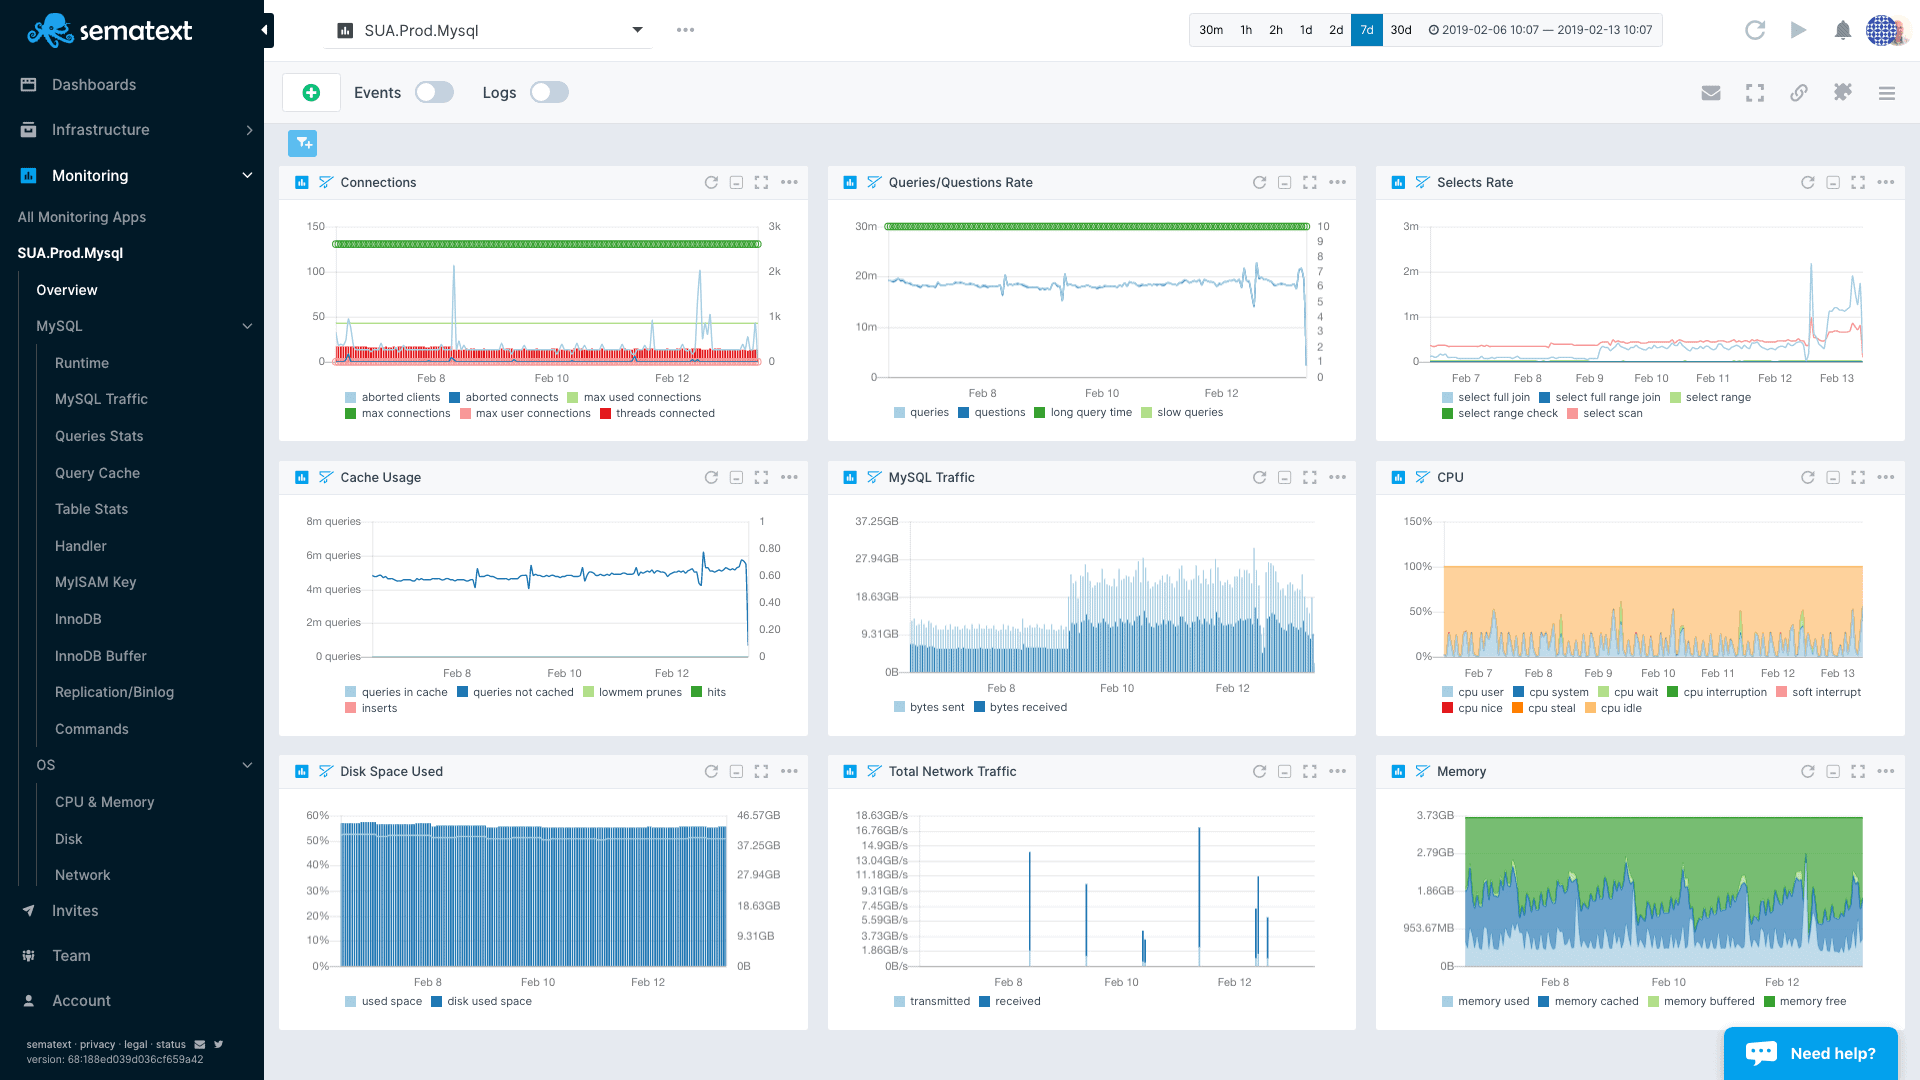
Why do we recommend it?
This tool tracks the performance of your MySQL databases. It provides insights into the resource utilization levels and the overall health of your database.
This has many advantages to offer. First and foremost, it is extremely easy to set up. It is available as both SaaS and you don't need to manage anything. It is a piece of a full-stack monitoring platform which is why it is simple to correspond MySQL performance along with events, metrics, and logs from several other lumps of application stack and infrastructure.
Last but not least, it possesses huge out-of-the-box charts and dashboards along with alert rules.

Who is it recommended for?
Works best for organizations that need a unified view of their database environments.
Pros:
- Easy to setup and implement
- Supports a variety of different database types including SQL
- Supports threshold-based alerts, ideal for maintaining SLAs
- Has a freeware version for testing
Cons:
- No on-premise version
Currently, Sematext provides a free trial for 14 days.
7. Percona Monitoring and Management Tool (PMM)
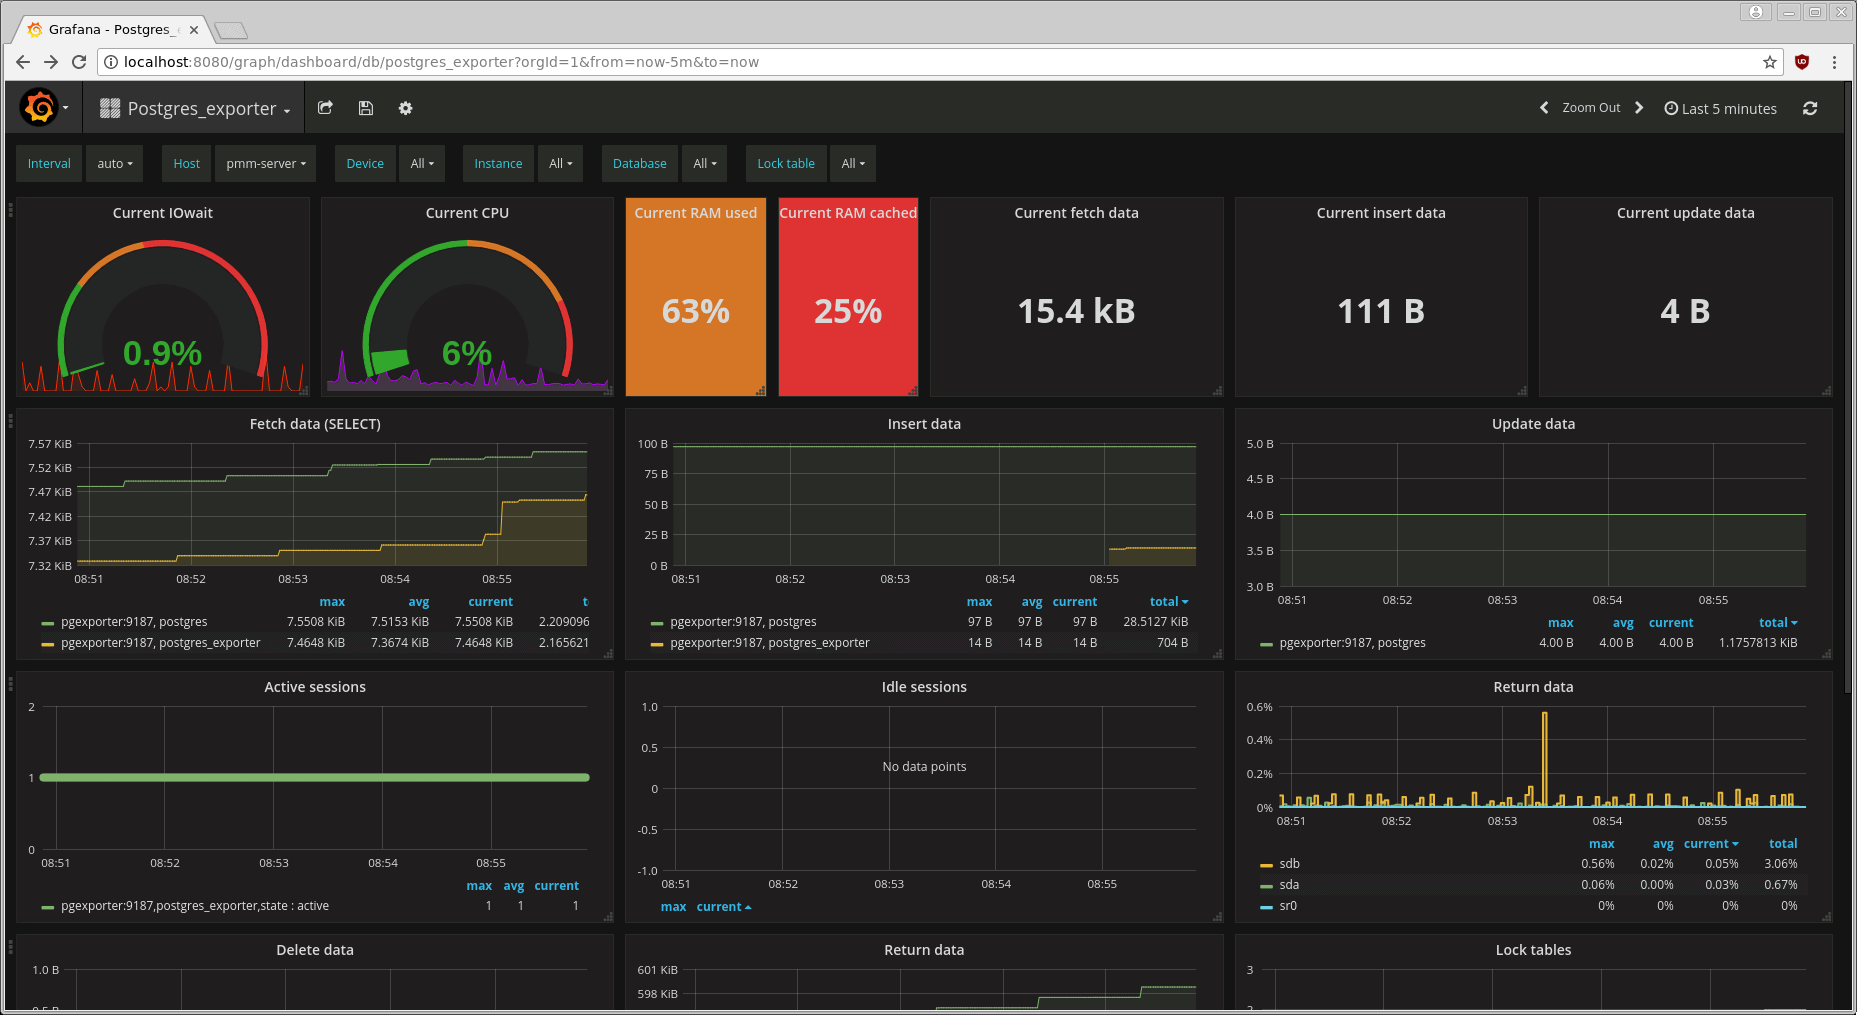
This type of tool is an open-source monitoring toolkit that is assembled on the Prometheus ecosystem. It offers an out-of-the-box dashboard to render you to analyze the performance of your MySQL system performance.
The monitoring capabilities of Percona Monitoring and Management Tool are:
- Errors
- Disk health(swapping)
- Slow queries
- Max connections
- Replication lag
Why do we recommend it?
Percona is an open-source database observability tool that works well with MySQL, PostgreSQL, and MongoDB databases. With this tool, you can view the node and single query performance across all databases.
Along with this, the Percona Monitoring and Management Tool offers huge benefits. It is extremely easy to set up and use it. It owns an overall comprehensive guide that helps you to access it seamlessly. The best advantage is that it renders out-of-the-box monitoring dashboards.
As Percona Monitoring and Management Tool is an open-source and free kit, the overall price of running is not much.

Who is it recommended for?
A good choice for organizations that use open-source tools extensively for monitoring.
Pros:
- Open-source and transparent project
- Works with a variety of SQL environments including MySQL, PostgreSQL, and MariaDB
- Offers built-in security audit tools
- Offers in-depth query analytics for manual reviews
- Is completely free
Cons:
- Not ideal for larger businesses looking for dedicated support
You can see a live demo of the Percona Monitoring tool.
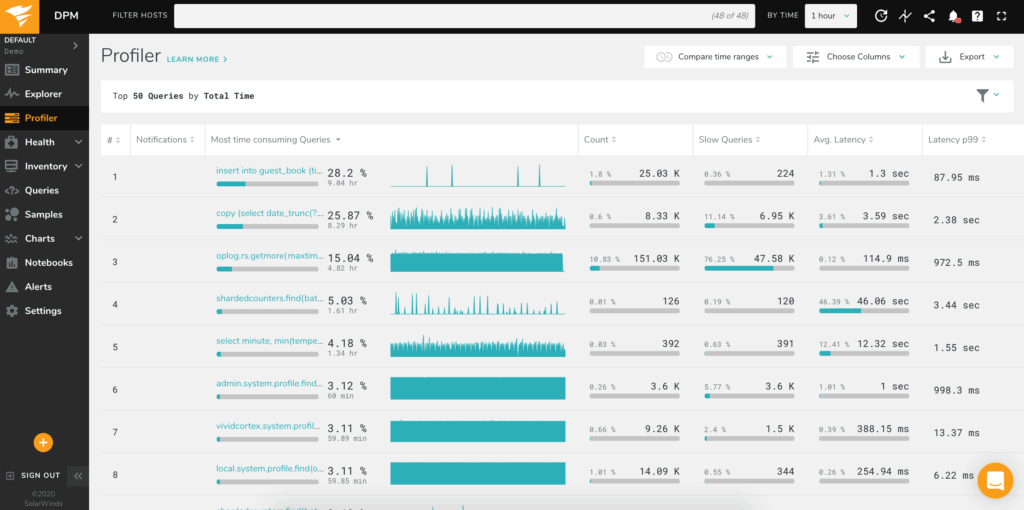
8. SolarWinds Database Performance Monitor
SolarWinds Database Performance Monitor is basically a SaaS system that keeps a track of several DBMSs. The amenity is adopted by integrating monitors to certain DBMS.
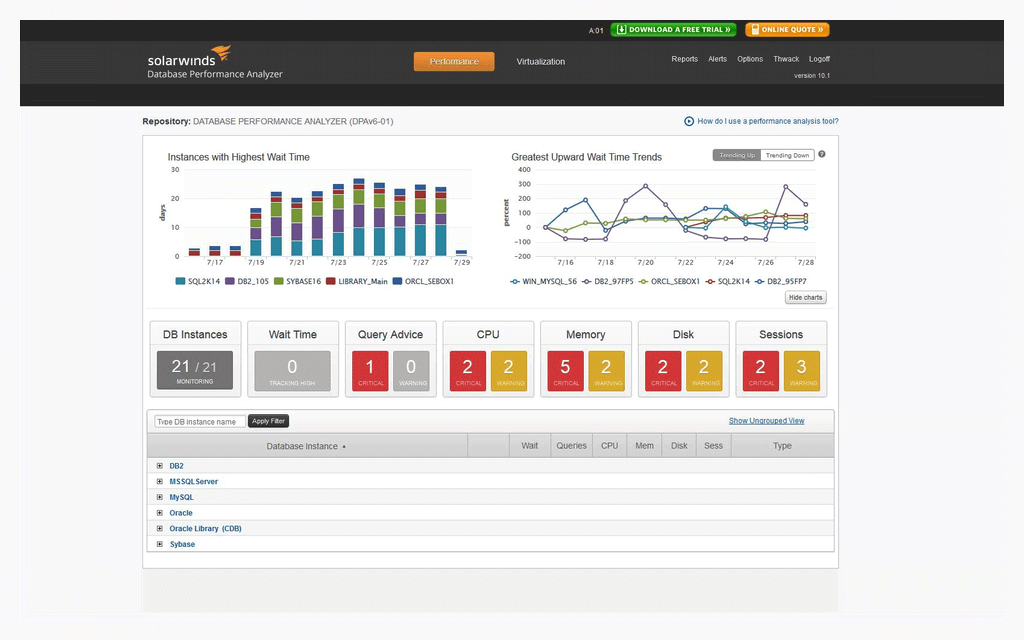
Why do we recommend it?
What we love about this tool is that it centralizes the monitoring and management of SQL, MySQL, Oracle, DB2, and other databases. It also generates excellent insights to help us completely understand the state of our databases.
The MySQL version of this particular monitor provides consistent monitoring along with performance tuning. It has query support as well. The monitor present in it estimates and computes the performance according to each query.
Few metrics that undergo tracking are,
- Throughput
- Latency
- Index usage
- Errors
- Warnings
- Execution plans
SolarWinds Database Performance Monitor also inspects each service that aids the MySQL database. Along with monitoring database configuration problems like memory usage, CPU utilization, table sizes, I/O actions, and CPU availability, it hosts statuses as well.

Who is it recommended for?
Ideal for organizations that use multiple databases and require a centralized platform that provides visibility into all of them.
Pros:
- Supports auto-discovery that builds network topology maps and inventory lists in real-time based on devices that enter the network
- Has some of the best alerting features that balance effectiveness with ease of use
- Supports both SNMP monitoring as well as packet analysis, giving you more control over monitoring than similar tools
- Uses drag and drop widgets to customize the look and feel of the dashboard
- Tons of preconfigured templates, reports, and dashboard views
Cons:
- This is a feature-rich enterprise tool designed for sysadmin, non-technical users may some features overwhelming
Currently, SolarWinds provides a free trial for 14 days to test its functionality.
9. MySQL Monitor tool from Monyog
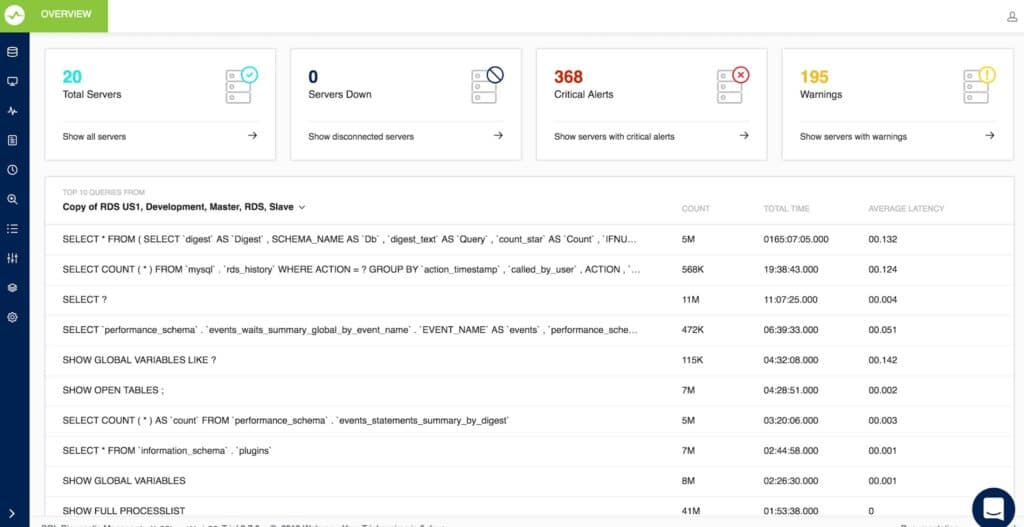
MySQL Monitor tool from Monyog is a strong tool that grants you access to follow up every little thing that takes place in your MySQL database in real-time.
Why do we recommend it?
Monyog is a cutomizable database monitoring tool that helps admins identify and fix issues. It gets the top queries from MySQL and analyzes them. Accordingly, it provides insights, which makes them highly accurate.
This tool instantly recognizes the source of an unforeseen spike in any of the MySQL databases. Along with it, it makes it possible to spot any error or issues and fix it soon before it affects the users in any possible way. It monitors several and multiple metrics thereby making it hassle-free for you to spot the major cause of functioning issues.
MySQL Monitor tool from Monyog also allows you to track and differentiate multiple versions of configuration files. Reducing the unwanted CPU usage time, it sends you notifications via SNMP traps, mail, Syslog, Slack apps, and Pagerduty.
It owns an advanced dashboard that exists within the alike window pane and allows you to view multiple metrics with the help of CloudWatch API, RDS API, RST API.
Showcasing replication of ranking of servers, it features an advantage of switching to a tabular view from a graphical view anytime. Additionally, you can even personalize and customize the charts that best suits your needs. MySQL Monitor tool from Monyog is safe and secured.
The professional features that it renders are,
- A unified view of all servers
- Trend analysis and history analysis
- Error log monitoring
- Personalized dashboard
- Events manager
- Custom SQL objects allowing complete optimization with the help of JavaScript.

Who is it recommended for?
A good choice for organizations looking for an agentless architecture combined with a SaaS-based monitoring solution.
Pros:
- A simple yet powerful tool that combines both troubleshooting and monitoring
- Best for smaller networks
- Easy to setup and get started monitoring quickly
Cons:
- Better suited for those that manage smaller environments
You can download a Monyog 14 days trial version and check what this software can do for you.
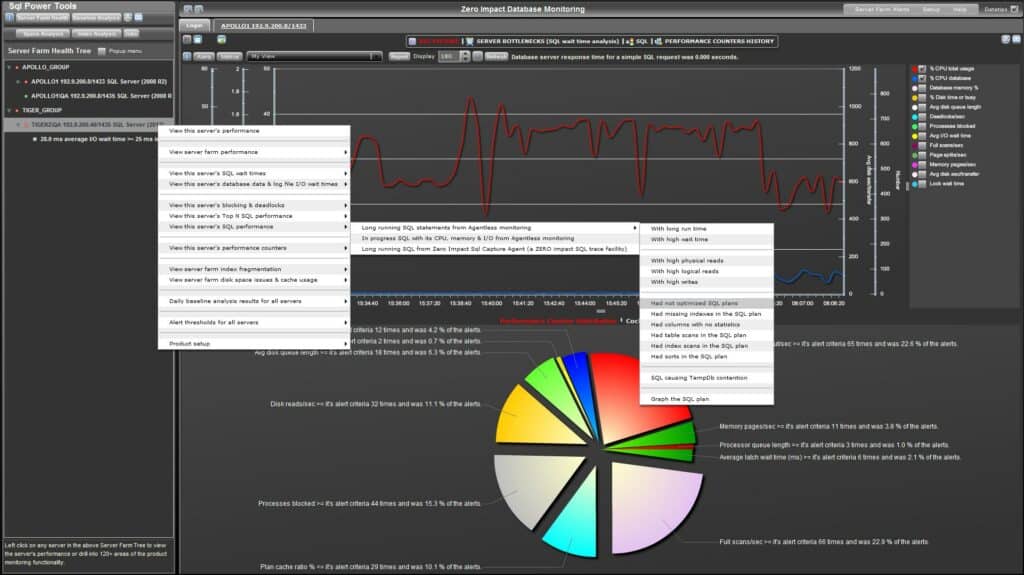
10. SQL Power Tools
SQL power tools claim themselves to be a “zero impact database monitoring”. As a matter of fact, it is an ordinary, lightweight and amazing tool that renders the users a general display of the performance of their database. Despite the clarity that it provides, it provides extensive features as well.
Why do we recommend it?
This is another agentless tool that provides more than 120 metrics. With such extensive insights, finding issues, and fixing them becomes easy.
The SQL analysis and text of end-user response time permit it to catch each of the SQL activities. These tools have the ability to baseline the performance of each SQL statement.
Along with this feature, SQL Power tools provide data logging of douce and bytes sent, response time. It has a vast array of metrics that include,
- Blocking
- SQL agent job
- SQL wit times
- Disk usage
- I/O stall times
- SQL wait conditions
- Index fragmentation
- Deadlocks
To sum up, SQL Power tools provide excellent security features that have the ability to stop SQL injection, phishing email attacks, DevOps attacks, etc. it informs you prior to any of the incidents that might hamper your security.
Who is it recommended for?
Works best for organizations that need a lightweight tool offering extensive metrics.
Pros:
- Was specifically built to be as lightweight as possible, allowing it to manage a large number of SQL servers with little resource consumption
- Offers built-in security auditing and monitoring that leverages behavioral analytics to stop SQL attacks
- Clean user interface takes little time to learn
Cons:
- Doesn’t support other applications beyond SQL
- Must contact sales for pricing
To request a free trial, visit the link.
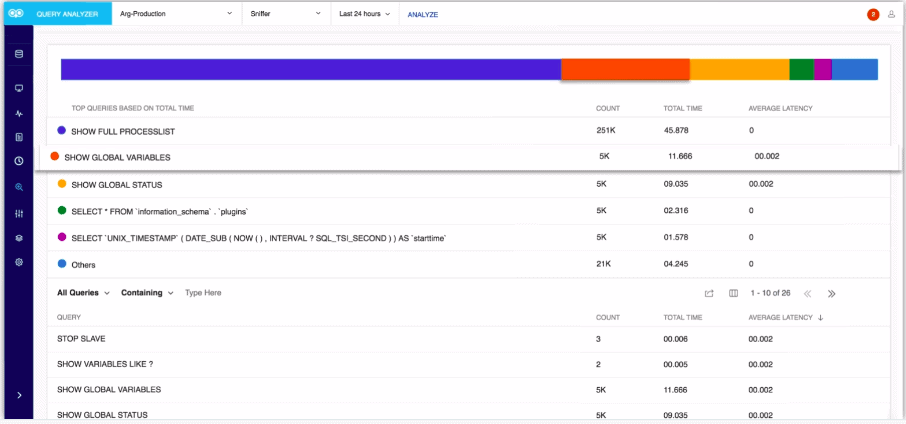
11. VividCortex MySQL Analyzer
VividCortex MySQL Analyzer advises you about the metrics that you must monitor. Similar to PMM(Percona Monitoring and Management Tool), VividCortex offers out-of-the-box dashboards in order to spot and identify the issues in terms of performance with the deployments of your MySQL.
However, it considers this as an advanced step by +releasing “events” throughout important monitoring states. For instance, if you get adjacent to the utmost number of MySQL connections that are allowed, VividCortex MySQL Analyzer emits the event. This initiative erases the vagueness around which metrics are quite necessary to monitor.
Why do we recommend it?
VividCortex, now a part of SolarWinds, is a SaaS monitoring tool that works best for open-source database platforms. It also provides insights into the performance of MySQL databases.
The monitoring capabilities of VividCortex MySQL Analyzer include:
- Slow queries
- Latency
- Disk health(swapping)
- Errors
- Max connections
- Replication health
Apart from these, there are many advantages of using this tool. First, it is extremely easy to set up. And second is that VividCortex MySQL Analyzer requires an ordinary and easy installation by the agent and it removes the requirements of hosting metric infrastructure.
Who is it recommended for?
Ideal for organizations running on a Linux environment.
Pros:
- Can monitor a variety of metrics including disk health, replication status, and backup queue
- Great dashboard and visuals
- Highly scalable – great for MSPs and large businesses
Cons:
- Could use a longer trial period
- Pricing only available on request
You can start a free 14-day trial to test the VividCortex.
Choosing a MySQL client
MySQL monitoring software and tools are crucial in order to monitor the several distinct metrics of the MySQL databases. This is necessary to make sure that it stays in a healthy state.
As MySQL is an analytical and critical resource that helps the functioning of many applications, having a specific tool that monitors your MySQL database can considerably lessen the overall workload of DB administrators.
With the assistance of databases such as MySQL at the core of maximum applications, assuring the visibility in the deployment of your MySQL is important. A monitoring solution will help you by recognizing and revealing the state of MySQL. It gives you a good view at the health of your MySQL thereby helping you prevent any downtime.
MySQL Monitoring Tools FAQs
What are some common tools used for MySQL monitoring?
Some common tools used for MySQL monitoring include MySQL Enterprise Monitor, Nagios, Zabbix, and Percona Monitoring and Management.
What are some common MySQL monitoring metrics that organizations should track?
Common MySQL monitoring metrics include database uptime, query throughput, query response time, and resource usage.
What are some common challenges associated with MySQL monitoring?
Common challenges associated with MySQL monitoring include the complexity of modern IT environments, the sheer volume of database activity, and the need to balance performance with data security.
How can organizations ensure that their MySQL monitoring efforts are cost-effective?
Organizations can ensure that their MySQL monitoring efforts are cost-effective by using a combination of automated tools and manual processes, and by prioritizing monitoring efforts based on potential impact on the organization.


