
If you work in IT then you know that network latency can be a real headache. It has the potential to cause delays and timeouts with networked applications and systems. The higher the latency, the worse it is for end users.
Network latency is a nightmare for companies that operate over wide area networks too, where connectivity speeds and latency go hand in hand. It is therefore very important to know what your network performance is currently sitting at, and the best way to do that is with specialized software that measures your network speeds and latencies.
We have put together a rundown of the most commonly used network latency programs so that you can start diagnosing issues yourself.
Here is our list of the best network latency tools and software:
- Site24x7 – EDITOR’S CHOICE A full-stack observability service that includes network monitoring with Ping-based latency testing and reports on packet loss, jitter, and uptime. Get a 30-day free trial.
- ManageEngine NetFlow Analyzer – FREE TRIAL A powerful flow-based network traffic and bandwidth management solution that works across multi-vendor environments. Start a 30-day free trial.
- Paessler PRTG – FREE TRIAL Stands out for its auto-detection routine and multi-platform support, offering comprehensive IT infrastructure monitoring. Start a 30-day free trial.
- SolarWinds Network Performance Monitor Excels in SNMP-based network probing, and offers dozens of templates to quickly identify the root cause of network latency in practically any environment. Ideal for both detailed network management and growing networks.
- PingPlotter Offers real-time latency and pinging visualization, making it great for monitoring remote routers and network performance.
- MultiPing Specializes in basic network observation with a focus on packet loss and latency measurements, suitable for simpler network setups.
Before we can start to treat latency issues we need to find out where they are and how they are affecting the network. To do this we will run through some of the best features available on network latency testing apps. Each of the tools that we will be looking at will have its own pros and cons, as well as special features in some cases.
We hope to explain what latency is, what it affects, and how we can reduce it. Once we know what latency is and how it can be treated we will look at the applications that will help us to resolve any issues that we might find.
What Exactly Is Network Latency Anyway?
In its most basic form, network latency is the time that it takes for data to be sent to a destination, and for a response to be received. The lower the latency is, the better the performance of the network will be. Having zero latency is not possible except in the strictest laboratory settings, and even then, latency is always present.
Just because latency is a given it doesn’t mean that we have to just live with it. There are plenty of ways that you can improve the performance of your network, some are software-based, with configurations being high on the list, while others are expensive hardware issues.
There are many different causes that can contribute towards a latency issue. One of the most common problems comes from over-utilization on your connection’s line. When users are downloading too much or uploading large files then your connection will start experiencing latency issues and lag.
An often overlooked culprit is also transmission delay. This is a configuration issue that is caused when the size of the packets are too large. These same larger packets will take longer to reach their destination, and will contribute towards latency and poor performance.
A poorly configured router or network switch can also add to latency. If you have incorrectly configured settings, then you might be introducing poor performance without even realizing it. Make sure that you have the basics such as the TTL header configuration setup correctly.
There are tons of other causes that contribute to network latency, so you will need to install software that can help you to find all the likely culprits so that you can work through a list and check off all the items that you suspect to be causing you issues.
What is a Latency Monitor?
A latency monitor is a system that tracks the time it takes for your data to reach the destination and then return. Trying to get an accurate measure on this metric is not easy, which is why there are many different vendors that have made it their business to track, measure and monitor lag and latency.
One of the most common areas where latency is at its most obvious is between 2 remote sites that are geographically separated by large distances. In human terms the latency that we measure is in milliseconds, which is incredibly small in terms of increments of time.
The only time we can start noticing latency is when it rises above a human perceptible threshold. There are some crude methods of measuring the latency with built-in windows tools like ping and tracert, but if you want to measure multiple nodes and conduct simultaneous operations at once then you will need to use a purpose-written application.
How Do We Perform a Network Latency Test?
Latency tests are simply a measurement of time that it takes for data packets to reach a destination and then return to your testing device such as a computer or laptop. The round trip that the data takes is what is considered to be the measurement of latency.
There are times when this kind of test is not exactly the most accurate way of measuring your network latency. For example, if you connect over the internet to a remote site your data takes the ‘best’ path. The TCP/IP protocol stack was designed with redundancy in mind.
So if a router or device is not working, then your data packets will automatically be re-routed. The problem with this is that sometimes the path that is chosen has a high latency, making the response times very high and the user experience very frustrating.
If you are measuring latency strictly with ICMP packets, then you might find that your data is not treated equally to other forms of traffic. ICMP is the same protocol used by ping. Ping on its own is not a malicious tool, but when used by attackers it reveals a lot of information about your computer systems if you have not logged everything down properly.
It is therefore quite likely that devices that you try to ping will not respond to your ping requests even though they are online. If the device does accept a ping request, then it is quite possible that the priority of the ICMP packets will be quite low, adding to your trip measurement’s latency.
Why is Latency Such a Concern?
Latency is very important because it determines how long transactions take to complete, how long a request takes to register, and how responsive a remote user session is. If a website does not receive a response in the expected time frame then your session will be closed. If you are using applications like Citrix or Windows Terminal to connect remotely then the time that it takes for your mouse cursor to move when you send it an action can be frustratingly slow, making it nearly impossible to work in any meaningful way remotely.
This can lead to more people going into the office on any given day, and can really cause issues in general relating to services such as internet provisioning and even cloud services. What makes latency measuring so difficult is that there is not a single cause of it. Sometimes user activity is the cause, and sometimes it can be a hardware failure on an upstream provider’s hardware.
It is impossible to say until a proper diagnostic is run. This is why it is hugely beneficial to get the right software tools and monitoring systems for the job. Users often make latency your IT department’s problem, even though the response times might have nothing to do with any of your on-premise equipment.
If your users have to access remote files, then the poor performance of their sessions might feel like a server issue to the average user. Having the right tools means that you can show your boss what the cause is and can help you to motivate their bosses to get better equipment, and services such as high-speed internet connectivity.
How Do We Reduce Network Latency?
Assuming you know what is wrong with your network there are many different solutions. Latency is generally caused by poor connectivity. If your company has an amazing internet connection, they are still vulnerable to overutilization. You could have the biggest pipe into the rest of the internet, but if your users are over-utilizing your services then you can expect there to be delays and a lag in receiving a response.
Internet usage is not the only cause of latency for connected users. An over-saturated LAN can also cause poor response times. You also need to ensure that your local network has the ability to monitor and track Wi-Fi usage from your users.
If you identify any high-volume users that are constantly downloading files during peak time then you need to correct that behavior so that they stop doing it. There are many tools that can limit your user’s internet usage, some block ports and some block repeat offender IP addresses. Once any rogue devices have been detected then you can decide the best way forward.
Generally, it is advisable to have the tools on hand to ban unauthorized users and users that use too much internet during office hours.
Network Latency Tools & Software
We’ve learned a lot about the potential causes of latency issues, so let us look at what programs we can use to try and take care of this problem once and for all on the network. What follows is a series of applications that we have tested, as well as some of their basic features.
Our methodology for selecting network latency tools and software
We reviewed various network latency tools and analyzed the options based on the following criteria:
- An autodiscovery system to log all network devices
- Support for multi-tenant environments
- Support for various alerting templates
- Ability to schedule or automate remediation actions
- A facility to analyze latency and network performance over time
- Graphical interpretation of data, such as charts and graphs
- A free trial period, a demo, or a money-back guarantee for no-risk assessment
- A good price that reflects value for money when compared to the functions offered
Let us check and see what is available and what has the potential to work in your networking environment. Then let us get started!
1. Site24x7 – FREE TRIAL

Site24x7 monitors infrastructure, applications, websites, and connectivity from one platform instead of operating only as a network utility. Within that broader coverage, Site24x7 includes latency testing that gives administrators direct visibility into connection quality through metrics such as response time, packet loss, and uptime. That view helps teams identify weakening network performance and act before service quality declines.
Key Features:
- Ping-based latency checks
- Continuous live monitoring
- Traceroute-based path visualization
- Recursive Ping support
- Service level agreement tracking
Why do we recommend it?
Site24x7 is recommended because its latency testing is not confined to internal infrastructure. The service can check cloud platforms, websites, and internet links, which makes it useful for availability monitoring as well as for measuring provider performance against service commitments. Since those checks sit inside an automated monitoring system, they can run continuously rather than depending on manual tests.
The Ping troubleshooting capability is designed to go beyond confirming whether a host replies. By sending Internet Control Message Protocol requests and measuring the timing and behavior of responses from multiple locations, the platform can reveal congestion, routing inefficiency, and service disruption. Threshold-based alerts can also be tied to latency and packet loss, so administrators are notified as soon as connection quality begins to decline.
Site24x7 also ties that testing into automated discovery and wider network monitoring. Devices are identified automatically, classified by type and role, and inserted into a topology view without manual mapping. That allows latency results to be examined against the real structure of the network, which makes it easier to see where a fault is occurring and which other components may be affected.

Because monitoring is continuous, the platform does not depend on user complaints before showing evidence of a problem. Device health, network performance, and configuration changes are all tracked in parallel, which reduces the time between fault emergence and investigation.
Who is it recommended for?
Site24x7 is suited to organizations that want connection testing to sit inside a broader monitoring environment rather than exist as a standalone utility. Since the platform also covers servers, cloud services, websites, and web applications, it is relevant to businesses that want one system to follow both network behavior and the services that depend on it. Its pricing structure starts small and expands by capacity, which makes it usable across different organization sizes.
Pros:
- Tracks availability together with processor and memory use on monitored devices
- Provides visibility into traffic behavior, including errors and discarded traffic
- Measures wide area link performance through round-trip time and related indicators
- Assesses voice service quality through mean opinion score, latency, and jitter
- Uses predictive models to estimate trends in response time and packet loss
Cons:
- No self-hosted deployment option
The Infrastructure Monitoring plan starts at $9 per month. Register for a 30-day free trial.
EDITOR'S CHOICE
Site24x7 is our top pick for network latency testing because it measures network behavior from a globally distributed infrastructure while tying those results to a larger monitoring platform. That makes it possible to compare performance across regions, detect location-specific degradation, and avoid relying on a single test point. Reporting highlights recurring delay patterns and packet loss issues, while automated alerting ensures that abnormal conditions are surfaced quickly enough for teams to intervene before users are affected. The diagnostic value goes beyond raw timing figures. Ping testing, route analysis, and continuous monitoring work together, so administrators can move from noticing degraded performance to identifying the segment, device, or path involved. Because these capabilities sit alongside infrastructure and application monitoring, the platform gives a more connected explanation of performance problems than a standalone latency checker would.
Download: Start a 30-day FREE Trial
Official Site: https://www.site24x7.com/signup.html?pack=44&l=en
OS: Cloud-based
2. ManageEngine NetFlow Analyzer – FREE TRIAL

ManageEngine NetFlow Analyzer is a comprehensive flow-based network monitoring and bandwidth management tool developed by Zoho Corporation’s IT division. It provides deep visibility into traffic patterns, application usage, security threats, and long-term capacity trends. Thanks to its support for all major flow technologies—NetFlow, sFlow, J-Flow, IPFIX, NetStream, AppFlow—it can provide an impressive flexibility for monitoring diverse, multi-vendor infrastructures.
Key Features:
- Real-time monitoring of interfaces and apps
- Application visibility with NBAR and QoS
- Security analytics with anomaly and DDoS detection
- Deep Packet Inspection for L2–L7 traffic
- AI/ML-driven capacity planning forecasts
Why do we recommend it?
ManageEngine NetFlow Analyzer doesn’t just track bandwidth stats. It goes further, digging into both performance and security—especially useful when latency becomes a problem. In addition, its Security Analytics module can flag anomalies and insider threats in real time, while also giving you detailed traffic breakdowns and forensic reports. Together, these tools make it easier for IT admins to spot bottlenecks and uncover the cause. Maybe it’s a sudden traffic surge or suspicious behavior, NetFlow Analyzer can make it easier for admins to spot them.
We recommend this solution for teams working in hybrid or multi-vendor setups. It delivers enterprise-level visibility without having to change infrastructure and spend more. Because it is built on flow technologies like NetFlow, sFlow, J-Flow, IPFIX, AppFlow, and NetStream, the tool excels in flexibility. The result: a platform that’s affordable and ready to handle complex networks with less hassle.
Who is it recommended for?
ManageEngine NetFlow Analyzer is built for network admins and NOC teams in medium to large enterprises. It is ideal for those that need more than just basic bandwidth stats. With it, you also get real-time insights into latency, jitter, and security issues. The solution is also a good fit for organizations that want the depth of tools like SolarWinds but at a lower cost.
Pros:
- Supports all major flow technologies (NetFlow, sFlow, IPFIX, etc.)
- Real-time monitoring with forensic-level drill-down
- Modular editions scale from SMBs to global enterprises
- Integrates with ticketing, SIEM, and SOC tools
Cons:
- Licensing for add-ons raises costs at scale
Explore ManageEngine NetFlow Analyzer on the official site or kick off a 30-day free trial to see its latency insights in action.
3. Paessler PRTG – FREE TRIAL

Paessler PRTG started as a bandwidth monitoring tool, but has grown into a multi tool that provides information about almost everything to do with networking and IT infrastructure. Installation and setup is very easy to do, and only takes a few minutes from start to finish.
Key Features:
- Auto-detection of network devices
- Supports multiple protocols
- Simple graphing for traffic
- Multi-platform support
Why do we recommend it?
Paessler PRTG is recommended for its versatility and ease of use in monitoring IT infrastructure. Its auto-detection feature simplifies network monitoring, making it accessible to a wide range of users.
You will only need to click through a few options to get up and running and it takes very little knowledge of how your network is set up and configured. After installing the software, you can start setting up the more complicated monitoring and reporting for your network.
The main reason why the setup is so easy is because it has an auto detection routine that finds and then adds networked devices to the application, allowing you to monitor from the get-go.
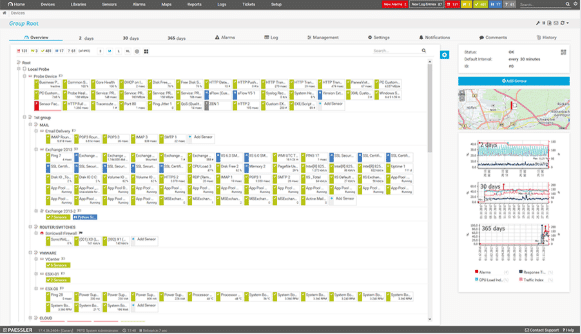
PRTG also offers multiple interfaces for you to track and monitor. You can view connections between sites, data and bandwidth use, and much more. The software runs on Windows, Android and iOS. If you are always walking around your organization then you can contact the main server application from your smart phone, laptop or tablet.
PRTG uses a many protocols for detecting and adding hardware and software to your network. It uses SNMP for monitoring and adding hardware, and also WMI for Windows specific devices. As we said earlier, it uses NetFlow and Sflow for network devices and equipment.
There are also ways to measure latency between targets for checking your response times.
Who is it recommended for?
It is ideal for IT administrators who need a comprehensive tool for infrastructure, network, and application performance monitoring. Its user-friendly nature makes it suitable for both experienced and novice users.
Pros:
- Designed to be an infrastructure monitoring tool that supports multiple sensors types such as NetFlow, sFlow, and J-Flow
- Offers additional monitoring on the same platform, supporting infrastructure, network, and application performance monitoring
- Captures packet headers only, helps speed up analysis and keep storage costs down for long-term collection
- Uses simple yet intuitive graphing for traffic visualization
Cons:
- Very detailed platform, takes time to learn and fully utilize all of the features available
Register to download a 30-day free trial. Up to 100 sensors remain free to use after the trial period.
4. SolarWinds Network Performance Monitor
SolarWinds is a very well-known software company that produces enterprise-grade applications for monitoring and managing your network. SolarWinds creates most of the administrator tools that you’ll need to get the job done.
Key Features:
- Automated setup and installation
- SNMP network probing
- NetPath for latency measurements
- Graphical reporting tools
Why do we recommend it?
SolarWinds Network Performance Monitor is recommended for its comprehensive network management capabilities. The automated setup and SNMP network probing provide detailed insights into network health, making it an invaluable tool for IT professionals.
SolarWinds Network Performance Monitor has a lot of these tools built in, giving you many different options when troubleshooting issues on your network. NPM is one of SolarWinds most sought after products. It allows you to probe the network with SNMP, giving you detailed information about hardware and software on your network such as serial numbers on routers, computers and servers.
On the software front it gives you version numbers and license seats of specific products on your network. Setting this application up is very simple, with much of the setup and installation process being automated.
This makes it very simple to get your monitoring up and running in next to no time.
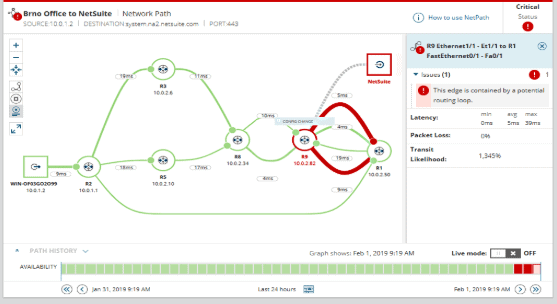
Latency measurements are possible in the NPM application thanks to a tool called NetPath. It measures nodes on your network and gives you the response times and latency measurements. This makes it very easy to monitor your network’s environment and how the transmission of data is being handled across the network.
NPM has excellent features such as graphical reporting and tools, which can give you important information about the network whenever you need to look at the current state of the networks within the organization.
Once the application has been installed you can configure it easily by entering the IP range and some additional information about your environment. You can essentially map out your entire network with multiple nodes, giving you an excellent visualization of how your computers are connected, and what the latency is.
Who is it recommended for?
This tool is ideal for IT professionals who require detailed network insights and robust monitoring capabilities. Its advanced features cater to those needing a deep understanding of network performance and hardware/software inventory.
Pros:
- Takes a holistic approach to server performance and health monitoring
- Supports auto-discovery that builds network topology maps and inventory lists in real-time based on devices that enter the network
- Supports both SNMP monitoring as well as packet analysis, giving you more control over monitoring than similar tools
- Uses drag and drop widgets to customize the look and feel of the dashboard
- Robust reporting system with pre-configured compliance templates
Cons:
- Designed for IT professionals, not the best option for non-technical users
Start a 30-day free trial.
5. PingPlotter
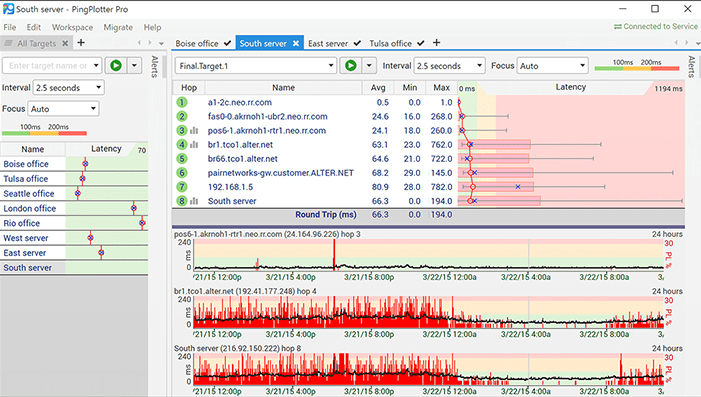
PingPlotter is an application that uses tracert as the main driving tool in the background. It displays graphs with data showing latency and the successful pinging of targets. IT does all of this in real-time, which means that when things fail you will notice it right away.
Key Features:
- Real-time latency visualization
- Historical data store
- Combines ping and traceroute
- Lightweight and intuitive
Why do we recommend it?
PingPlotter is recommended for its effective real-time visualization of network performance. Its ability to combine ping and traceroute functionalities into an intuitive graphical interface is particularly beneficial for quick diagnostics.
The best thing about a graphical interface such as this with graphs is that you can get a much better idea of performance at a glance. You can use PingPlotter to keep tabs on all of your remote routers throughout your network. This makes it easy to find issues as they happen.
The way that PingPlotter is able to graph network performance is that it measures the hops between each of the devices on the route of the data packets. Each of these responses gives you a measurement of the time that it took for the packet to proceed, and for the data to return a response. This is pretty much the same behavior that you see with a ping and traceroute command, but PingPlotter combines these features.
Having a live monitoring solution is great, but what if you would like to view historical data? PingPlotter also happens to have a historical store that you can view all of the previous data from. If you are trying to generate reports and find out more data, then this feature will point you in the right direction.
Who is it recommended for?
This tool is suitable for network technicians and IT professionals who require a straightforward tool for monitoring latency and network paths. It's also great for those who need to perform both one-off and continuous network tests.
Pros:
- Three options including a freeware version
- Offers lightweight visualization into latency across devices
- Good for both one-off tests as well as continuous testing
Cons:
- Could benefit from a longer trial period
- TCP and UDP tests are not included in the free version
Pricing:
Check out the PingPlotter pricing page for up-to-date pricing structures.
Download:
Download a free 14-Day trial version from here.
6. MultiPing
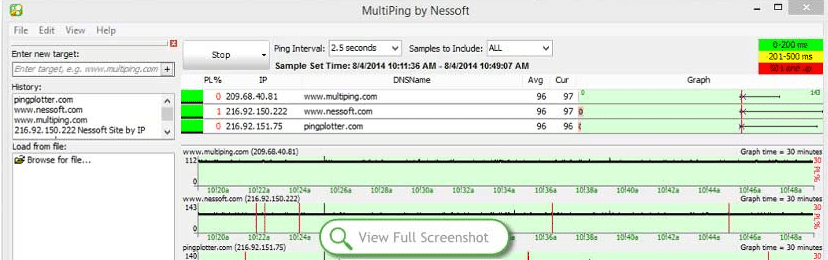
MultiPing is a tool that you can use to keep your connections under observation to make sure that there are no disruptions to your connectivity. This is a very basic tool, and it is a not intended as a fully-fledged monitoring suite. But as a latency measuring application then it is more than enough to get the job done.
Key Features:
- Network discovery and testing
- Measures packet loss and latency
- Simple, user-friendly interface
- Auto-configuration option
Why do we recommend it?
MultiPing is recommended for its simplicity and efficiency in monitoring network connections. Its focus on packet loss and latency measurements makes it a practical tool for basic network observation.
MultiPing gives you important information such as packet loss and it displays this information as a percentage. There is also other important information such as constant ping, the minimum, the average as well as the maximum levels of overall latency. If you aren’t very technical then you can let the application perform an auto-configuration automatically.
Who is it recommended for?
This tool is ideal for smaller tech support teams or individuals needing a straightforward tool for onsite network scans. It's particularly useful for quick checks and basic monitoring tasks.
Pros:
- Allows for network discovery and testing across multiple hosts
- Can measure packet loss, jitter, and latency across IPv4 and IPv6
- Good fit for smaller tech support teams or quick onsite scans
Cons:
- Only for Windows operating systems
- Paid tool, competing tools offer similar features for free
Pricing:
Pricing starts at $39.99 and you can purchase it from here.
Download:
Conclusion
There are so many different tools available on the market today, all with their own special features and design considerations. The chances are pretty good that you will find the right tool for the job when you need it. Whatever you want to measure on your network, there is a tool to do it.
If you aren’t able to find the right tool for the job then you can even start researching the world of scripting. There are many built in tools that come with the Windows Operating System, Linux, and Mac OS that will allow you to ping and tracert.
There are plenty of ways to get this done if you have the time and the willingness to learn. For everyone else, there are these great tools that we have just looked at. SolarWinds gives a very good multidimensional view of your network, while PRTG is easy to use and install.
Whichever tool you prefer be sure to give it a try and find the one that suits your budget and operating environment the best.
Network Latency FAQs
What are some common network optimization techniques for reducing latency?
Common network optimization techniques for reducing latency include Quality of Service (QoS), traffic shaping, bandwidth management, and optimizing network topology.
What is an acceptable level of network latency?
An acceptable level of network latency will depend on the specific use case and network requirements. For most applications, latency under 100ms is considered acceptable, while real-time applications such as video conferencing may require latency under 50ms. Ultra-low latency applications such as augmented reality may require latency as low as <1ms.
What causes network latency?
Network latency can be caused by a variety of factors, including distance between devices, network congestion, processing delays, and physical limitations of the network infrastructure.
What are some common symptoms of network latency?
Common symptoms of network latency include slow network performance, delays in data transmission, dropped packets, and poor video or voice quality in real-time applications.
How is network latency measured?
Network latency is measured in milliseconds (ms) and is typically measured using tools such as ping or traceroute.


