
Finding the Best Alternative to New Relic for Application/Server monitoring can be cumbersome at times – sifting through dozens of vendors and software companies to find all of their features and then trialing them to see which one fits your needs.
Here is our list of the top New Relic alternatives for application performance monitoring:
- Site24x7 – FREE TRIAL A SaaS server and application monitoring bundle that includes a range of monitoring techniques including website transaction monitoring and real user monitoring. Start a 30-day free trial.
- ManageEngine Applications Manager – FREE TRIAL A monitoring system for a range of applications, including web applications. Installs on Windows Server and Linux. Download a 30-day free trial.
- ManageEngine OpManager Nexus – FREE TRIAL An advanced monitoring platform that can provide information about the performance of your cloud and SaaS applications. Download a 30-day free trial.
- Datadog APM This APM offers a package of tools that range from real user monitoring through to server monitoring. Datadog is a cloud-based service.
- Stackify Retrace This is a code analysis tool, based in the cloud, that is intended for debugging use by developers.
- Dynatrace This cloud-based system monitoring platform can trace infrastructure performance and track problems all the way from website transactions right down to the server that hosts the web applications and the network that serves it.
- Atatus An application monitor that specializes in tracing how different applications work together in order to spot when they don’t work very well.
- LogicMonitor A good match for those looking for an equal to New Relic. This cloud-based monitoring system explores a system, logging all hardware and software, and links together supporting layers in the application stack.
- AppDynamics This SaaS monitoring platform maps all equipment and links all application transactions through to underlying services, pointing to the root cause of application performance problems.
- SolarWinds Observability SaaS A cloud-based application performance monitoring system that also measures server and connection statuses. The service’s execution tracing is great for working out what is slowing down response times.
Our methodology for selecting New Relic Alternatives:
We've broken down our analysis for you based on these key criteria:
- Comprehensive application and server monitoring capabilities
- User interface and ease of integration
- Support for multiple programming languages and environments
- Real-time visibility and detailed performance analytics
- Pricing transparency and availability of a free trial
The best New Relic Alternatives
Some of these software solutions are built on open-source platforms, but we're going to focus on the ones that are commercially supported and are paid platforms, as we're looking for the MOST reliable solution possible – not necessarily the cheapest. Although some of these products run under $20, $15 and even under $10/month.
1. Site24x7 – FREE TRIAL
Site24x7 is a cloud-based monitoring system with a range of options – website monitoring, infrastructure monitoring, and application performance monitoring. The company offers a combined package with all of these service modules included. This is the All-in-one deal.
Key Features:
- Comprehensive package including website, infrastructure, and application monitoring.
- Real user monitoring and advanced monitoring credits.
- Customizable service options with various add-ons.
- AI-enhanced root cause analysis.
Why do we recommend it?
Site24x7 stands out for its all-in-one monitoring solution, offering a broad range of monitoring techniques, making it versatile for different IT environments.
All of the Site24x7 packages are charged for by subscription. Subscribers to the all-in-one plan have a choice of four editions: Pro, Classic, Elite, and Enterprise. Each edition is a bundle of service. In some cases, such as real user monitoring or advanced monitors, the plan includes credit for a number of monitor or test executions. Between plans and editions, there are a very large number of options available. OPN top of those possibilities, Site24x7 also has a menu of add-on services for each subscription. This means that each customer can get a very tailored service that exactly matches their needs.

Who is it recommended for?
It's best suited for organizations needing a flexible, feature-rich platform for comprehensive monitoring of networks, servers, and websites.
Pros:
- Offers a specific package for real user monitoring
- Offers a host of out-of-box monitoring options for infrastructure, servers, and applications
- Allows administrators to view dependencies within the application stack, good for building SLAs and optimizing uptime
- Offers root cause analysis enhanced by AI to fix technical issues faster
Cons:
- Site24x7 is a feature-rich platform with options that extended beyond databases management, may require time to learn all options and features
The large number of options offered by Site24x7 means that this service can provide a specialist system monitor for networks, servers, or websites. It is a very flexible service.
Site24x7 offers a 30-day free trial on all of its plans, including the all-in-one package.
2. ManageEngine Applications Manager – FREE TRIAL
Although ManageEngine Applications Manager is not a cloud-based service, like New Relic, it is able to match the cloud services and web application monitoring capabilities of its major rival. Applications Manager has an impressive array of monitoring services for web services and mobile apps that make it a worthy opponent of New Relic.
Key Features:
- On-premise and cloud deployment options
- Monitors web services, mobile apps, and serverless systems like AWS Lambda
- Distributed tracing for microservices performance tracking
- Performance threshold alerts via email and SMS
Why do we recommend it?
ManageEngine Applications Manager is recommended for its extensive monitoring capabilities, particularly for web services and mobile apps, making it a strong alternative to New Relic.
The list of application monitoring systems built into Applications Manager extends to the ability to monitor platforms and developer frameworks and even serverless systems, such as AWS Lambda. It includes distributed tracing for tracking the performance of microservices that lie behind APIs and support mobile apps.
Website monitoring services in the package include URL monitoring, website content monitoring, and synthetic transaction monitoring. Although this package is more suitable for managing live websites, it could also be used as an alternative to New Relic for development and testing tasks. It includes code analysis for all of the major web development frameworks.
The ManageEngine system relies on performance thresholds. These include pre-set acceptable performance levels that can be adjusted by the user. These threshold trip alerts if they are crossed. Alerts can be forwarded to technicians by email and SMS so they don’t need to watch regular daily operations because the Applications Manager takes care of that. However, the dashboard also includes analytical tools that assist testing and troubleshooting efforts.

Who is it recommended for?
Ideal for IT teams needing an in-depth monitoring solution for both live websites and development/testing environments, especially those requiring comprehensive code analysis.
Pros:
- Offers on-premise and cloud deployment options, giving companies more choices for install
- Can highlight interdependencies between applications to map out how performance issues can impact businesses operations
- Offers log monitoring to track metrics like memory usage, disk IO, and cache status, providing a holistic view into your database health
- Can automatically detect databases, server hardware, and devices in real-time
Cons:
- Can take time to fully explore all features and options available
The Applications Manager installs on Windows Server and Linux and it is available in three editions: Free, Professional, and Enterprise. The Free version is limited to monitoring five applications. The Professional and Enterprise editions are available for 30-day free trials.
3. ManageEngine OpManager Nexus – FREE TRIAL

ManageEngine OpManager Nexus, formerly OpManager Plus, is a good alternative to New Relic as it offers 360-degree views of your infrastructure and applications, including SaaS, cloud, and on-premises applications. It correlates data from multiple sources and pinpoints the root cause of problems, so you can fix them easily.
Key Features:
- Provides code-level insights to identify bottlenecks and improve application performance.
- Supports distributed transaction tracing to detect anomalies.
- Performs real-user monitoring to map users’ journey across the application.
- Generates insightful reports that can help with stakeholder communication.
Why do we recommend it?
OpManager Nexus monitors every layer in your cloud and SaaS applications, and this means, you can have accurate information on the root cause of a problem. More importantly, it correlates data from different areas in your infrastructure, so you have a context for every error.
It comes with distributed transaction tracing capabilities that compares current values against existing baselines to detect anomalies. Moreover, it uses adaptive thresholds, where the baseline values are automatically altered based on the real world conditions. Such an approach identifies slowdowns and potential issues, along with the cause of the same.
Its use of apdex graphs is another notable aspect, as this can provide insights in users’ journey throughout your applications. As a result, you can measure user experience and make changes where required.

Who is it recommended for?
OpManager Nexus works well for the owners of cloud and SaaS applications, cloud engineers, website owners, e-Commerce companies, and anyone with a digital presence. It can also security and compliance teams ensure their applications meet the required standards.
Pros:
- Provides comprehensive insights into your applications’ health and performance.
- Displays data on well-designed dashboards.
- Captures the important traces and metrics.
- Displays live dependencies for quick troubleshooting.
Cons:
- It can take time to completely understand all the features of this tool.
OpManager Nexus has two pricing editions – Professional starts at $1,233 for 50 devices and Enterprise starts at $19,995 for 1000 devices. Start a 30-day free trial.
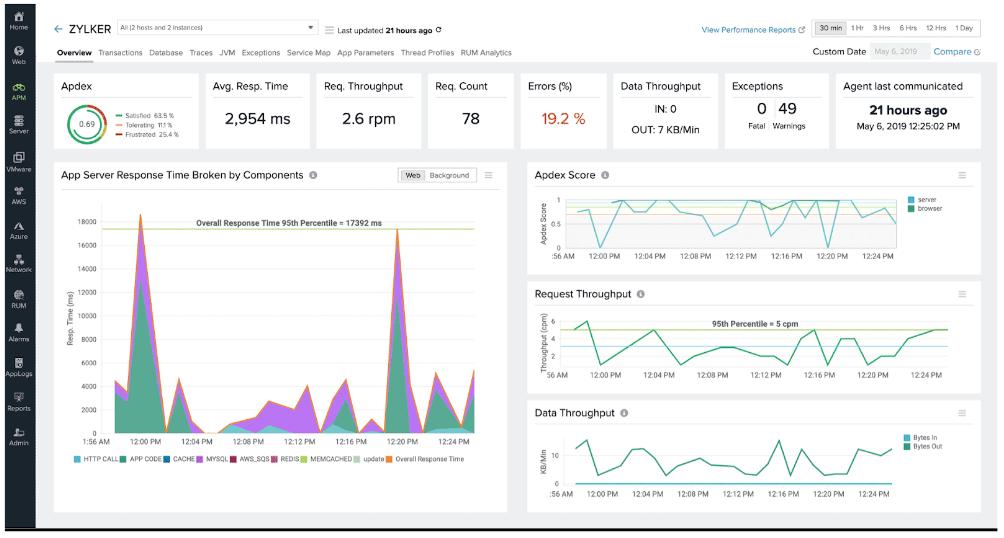
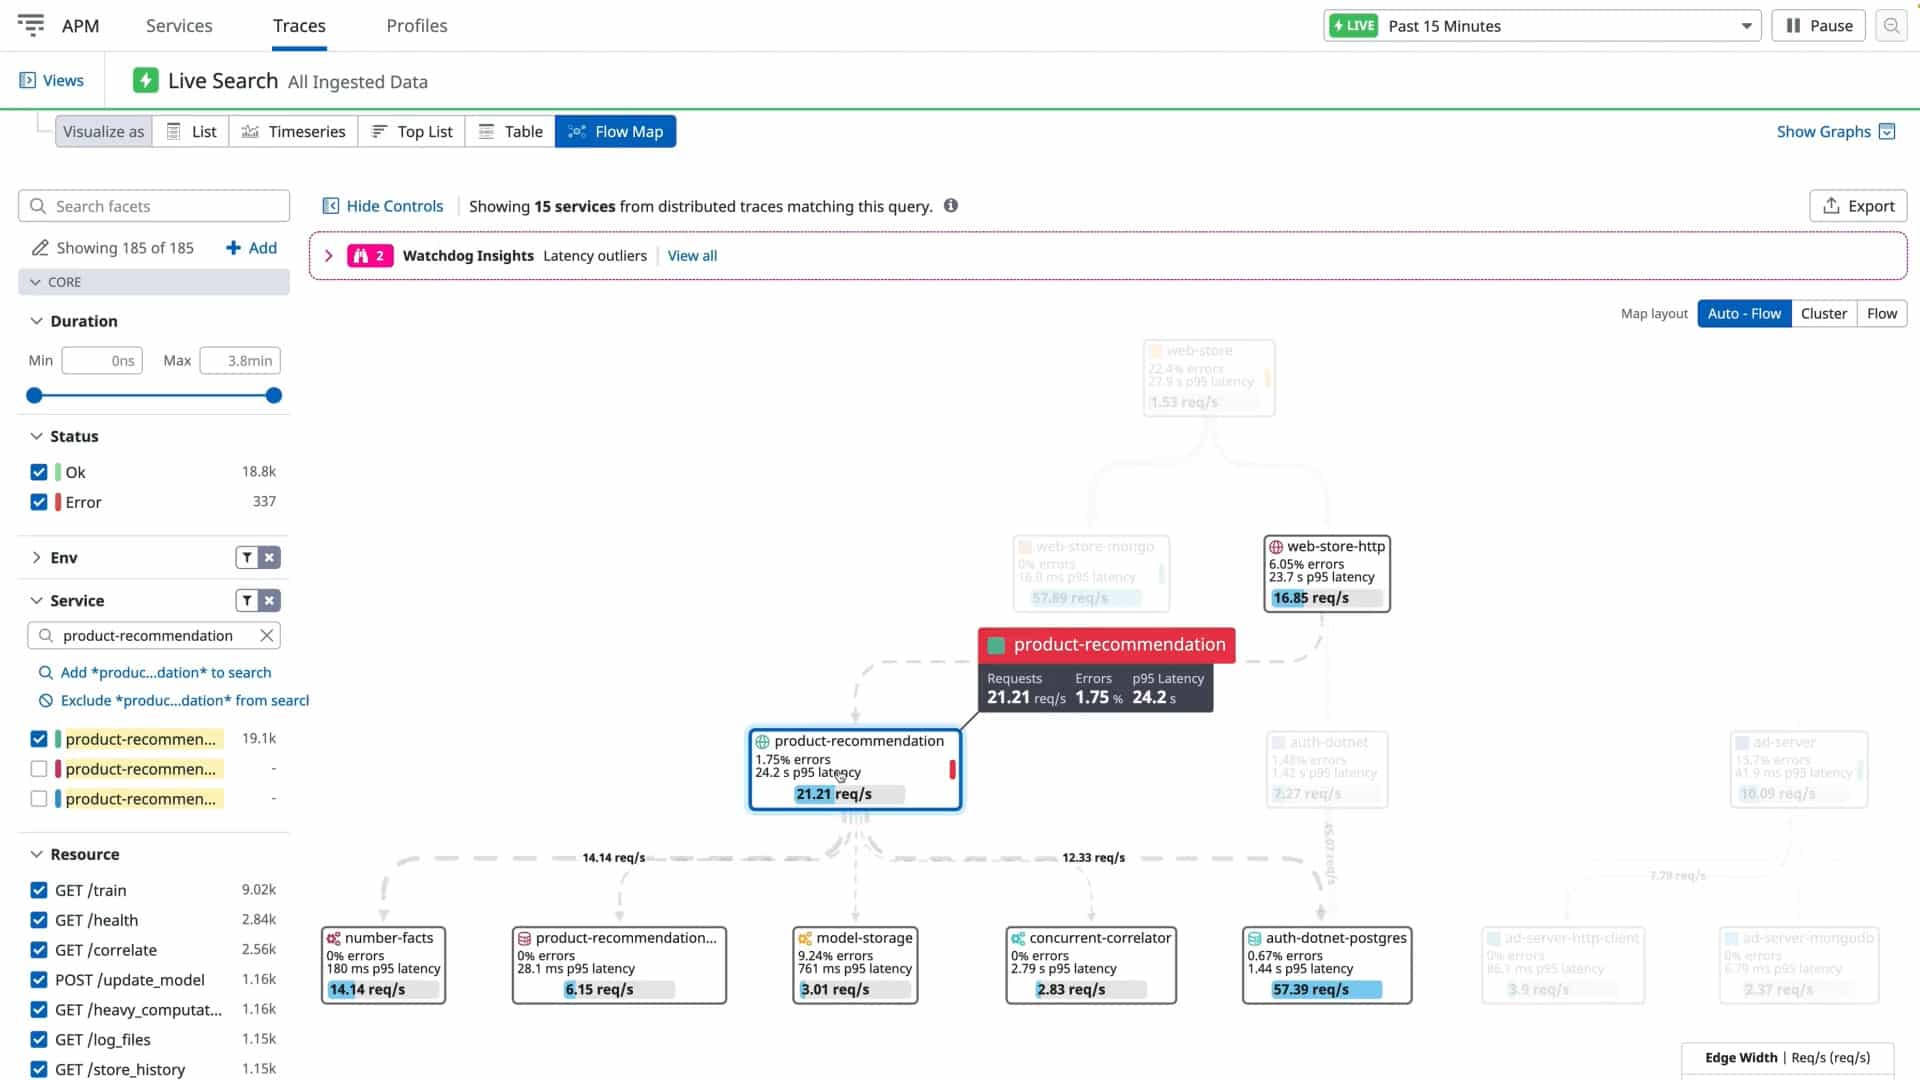
4. Datadog APM
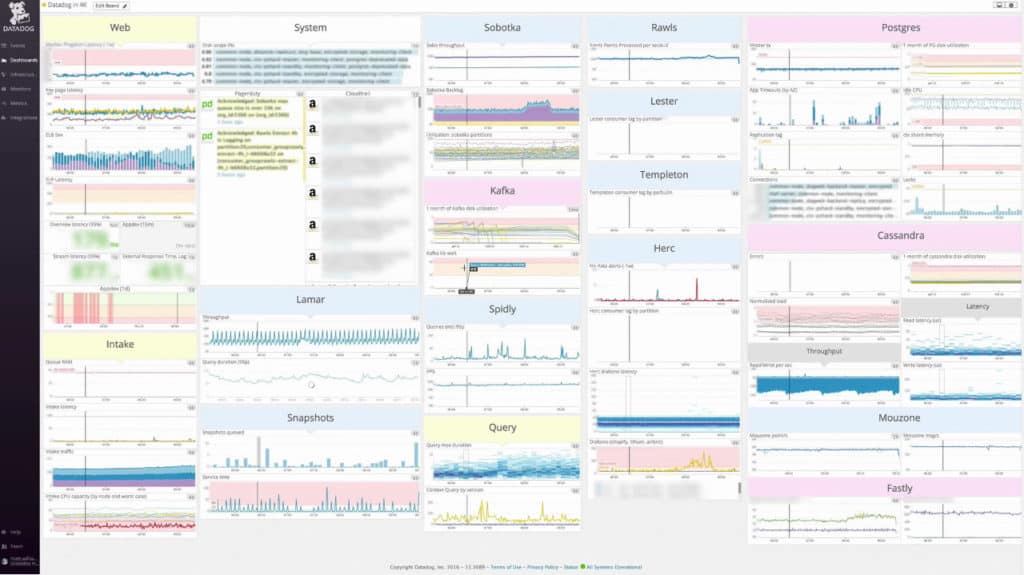
Datadog gives you the ability to view your application at a high level and breakdown into individual services (over 450) and get a better understanding of an individual service at an more granular level.
Key Features:
- Customizable dashboards for high-level and granular service monitoring
- Cloud-based SaaS product for ease of use
- Monitors internal and external network performance
- Auto-discovery feature for real-time network topology maps
Why do we recommend it?
Datadog APM is notable for its ease of use and customizable dashboards, offering a comprehensive view of over 450 services, making it ideal for detailed application monitoring.
Datadog is as easy as installing an agent software on your server and your dashboard gets populated accordingly. Agent is open-source and available to the public for further monitoring development if needed.
Who is it recommended for?
It's particularly suitable for businesses looking to scale their monitoring efforts and require a flexible, cloud-based solution that provides both high-level overviews and detailed service insights.
Pros:
- Easy-to-use customizable dashboards
- Cloud-based SaaS product allows monitoring with no server deployments or onboarding costs
- Can monitor both internally and externally giving network admins a holistic view of network performance and accessibility
- Supports auto-discovery that builds network topology maps on the fly
- Changes made to the network are reflected in near real-time
- Allows businesses to scale their monitoring efforts reliably through flexible pricing options
Cons:
- Would like to see a longer trial period for testing
With pre-configured dashboards, you'll get a high level understanding and overview of your infrastructure, you have the ability to create custom dashboards from different services that allow you to quickly view metrics and analytics for different services quickly from one window. You can start with a 14-day free trial.
5. Stackify Retrace
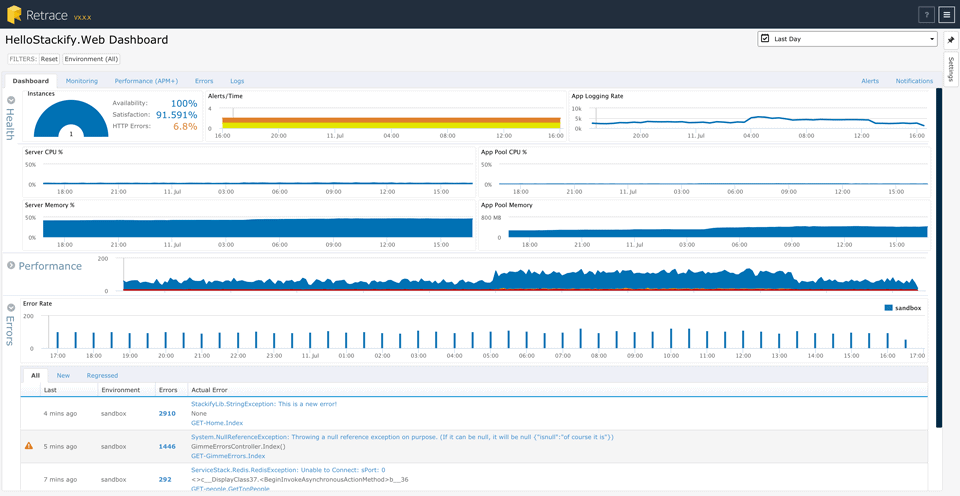
Stackify Retrace supports .Net and Java from their application performance monitoring functionality, along with .Net, Java, Node, PHP and Ruby for log monitoring & error monitoring. They also are one of the only companies that support .NET Core and support profiling Windows services for non-web services.
Key Features:
- Supports .NET, Java, Node, PHP, Ruby, and .NET Core
- Profiling for Windows services and Non-web services
- Pre-configured for identifying performance bottlenecks and slow database queries
- Dashboard for tracking app errors, logs, and key metrics
Why do we recommend it?
Stackify Retrace is recommended for its developer-focused approach, supporting a wide range of programming languages and providing tools for efficient bug identification and resolution.
Retrace is designed for developers to find bugs quickly and debug issues on the fly. Install the agent and let it scan your server for all applications running and see errors within the main dashboard. It comes pre-configured for identifying bottlenecks in your stack, find slow db queries, view all app errors and logs, track key analytics and metrics all within the dashboard.

Who is it recommended for?
Best suited for development teams, especially those working with .NET Core and needing a tool for quick debugging and performance analysis in their applications.
Pros:
- Supports .NET Core as well as Windows service profiling
- Highly customizable interface – easy to learn
- Designed to run out of the box
- Quickly identifies bottlenecks, performance issues, and slow queries
Cons:
- Would like to see a longer trial
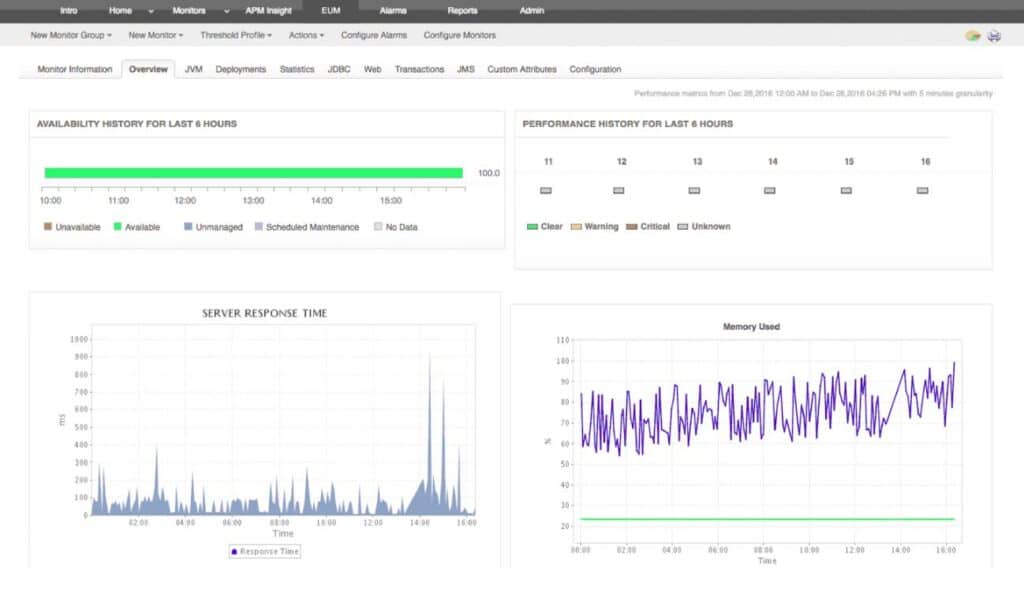
6. Dynarace
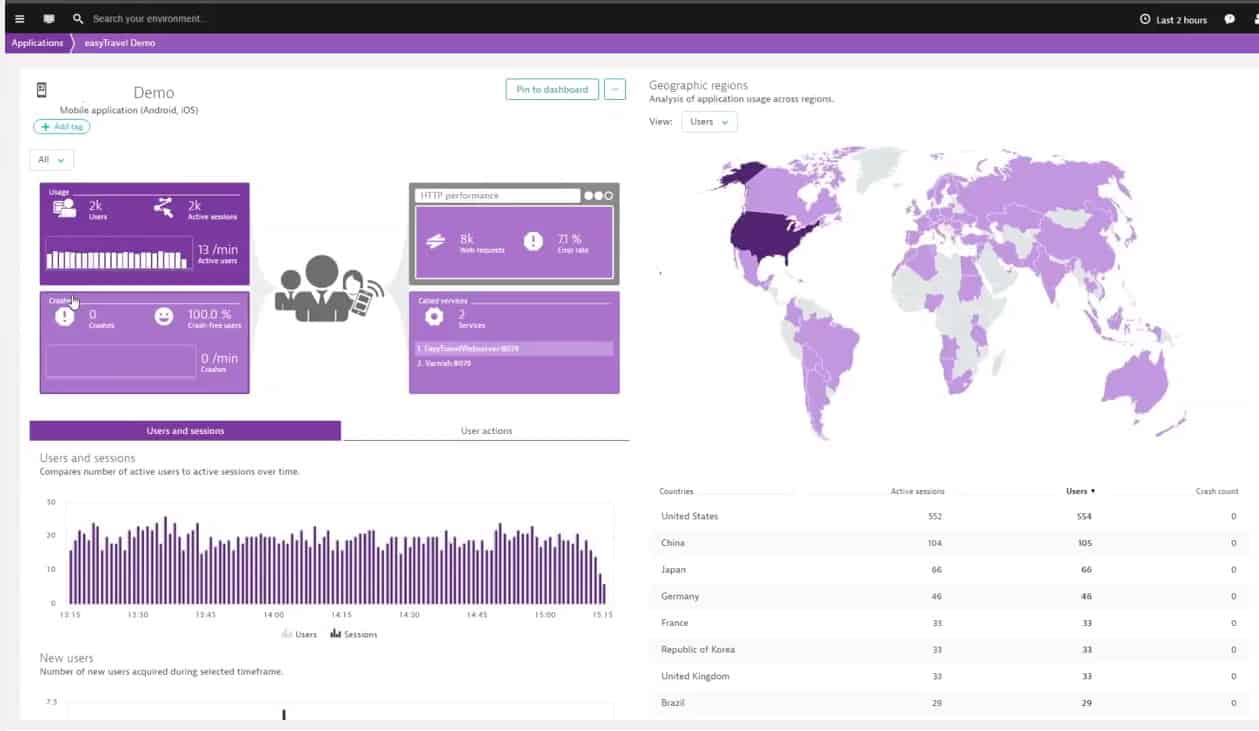
Dynatrace dives deep in your application and provides real-time user monitoring of your stack along with providing essential analytics of performance and application monitoring.
Key Features:
- Real-time user monitoring and performance analytics
- Supports AWS, Docker, Microsoft Azure, and OpenStack
- AI-based baseline analysis for anomaly detection
- Customizable dashboards suitable for large-scale networks
Why do we recommend it?
Dynatrace is recommended for its depth of analysis and real-time monitoring capabilities, supported by AI, making it highly effective for large-scale network environments.
They give you the ability to quickly deploy and monitor AWS, Docker, Microsoft Azure, OpenStack and more within their dashboard..

Who is it recommended for?
Ideal for large organizations or enterprise-level networks that require a robust, AI-enhanced monitoring solution with extensive environment support.
Pros:
- Highly visual and customizable dashboards, excellent for enterprise NOCs
- Operates in the cloud, allowing it to be platform-independent
- Supports a wide range of environments
- Leverages AI to provide baseline analysis and detect user behavior anomalies
Cons:
- Designed specifically for large networks, smaller organizations may find the product overwhelming
7. Atatus

Atatus gives your a more granular look into your transactions and its outliers by drilling down into which ones are causing a bottleneck in your app and slowing it down.
Key Features:
- Detailed transaction monitoring and error tracking
- Database performance analysis for Redis, Memcache, MongoDB
- Historical performance metrics tracking
- Remote service monitoring capabilities
Why do we recommend it?
Atatus is notable for its granular transaction analysis and comprehensive database monitoring capabilities, making it a robust tool for application performance management.
With their easy to navigate dashboard, you can view historical performance metrics and issues and track error rates to ensure that your application is performing at peak historical levels.
Along with transnational monitoring, Atatus offers Database Monitoring , Error Tracking and Remote Service monitoring capabilities that will give you an overview and understanding of your critical production services and how they are performing.
This includes measuring performance of database queries from Redis, Memcache and MondgoDB along with which queries are causing the slow down.

Who is it recommended for?
Best suited for larger environments where detailed transactional analysis and database performance monitoring are crucial for optimizing application efficiency.
Pros:
- Excellent live reporting and admin dashboard visuals
- Can track errors and performance issues across a variety of platforms
- Can monitor various databases from a single pane
Cons:
- Better suited for larger environments
8. LogicMonitor
LogicMonitor provides an optimal performance monitoring solution for your production servers and helps you analyze the data you need to diagnose bottlenecks, issues and errors within your current infrastructure.
Key Features:
- Cloud-based application performance monitoring
- Auto-discover feature for system scanning and data visualization
- Customizable dashboards for different user needs
- Suitable for hybrid cloud environments
Why do we recommend it?
LogicMonitor is recommended for its comprehensive cloud-based monitoring solution, offering extensive features for proactive system management and capacity planning.
Their Auto-Discovery feature scans your systems and pulls data and information into easy-to-read graphs and data points that help you manage and monitor pain points. LogicMonitor helps you be more proactive about monitoring mission critical systems and lets you look at historical data to plan for future growth and capacity planning.

Who is it recommended for?
Ideal for enterprises and MSPs looking for a cloud-based solution to monitor application performance across both on-premise and cloud environments.
Pros:
- Monitors application performance via the cloud
- Can monitor assets in hybrid cloud environments
- The dashboard can be customized and saved, great for different NOC teams or individual users
- Better suited for enterprises and MSPs
Cons:
- The trial is only 14 days, would like to see a longer testing period
9. AppDynamics
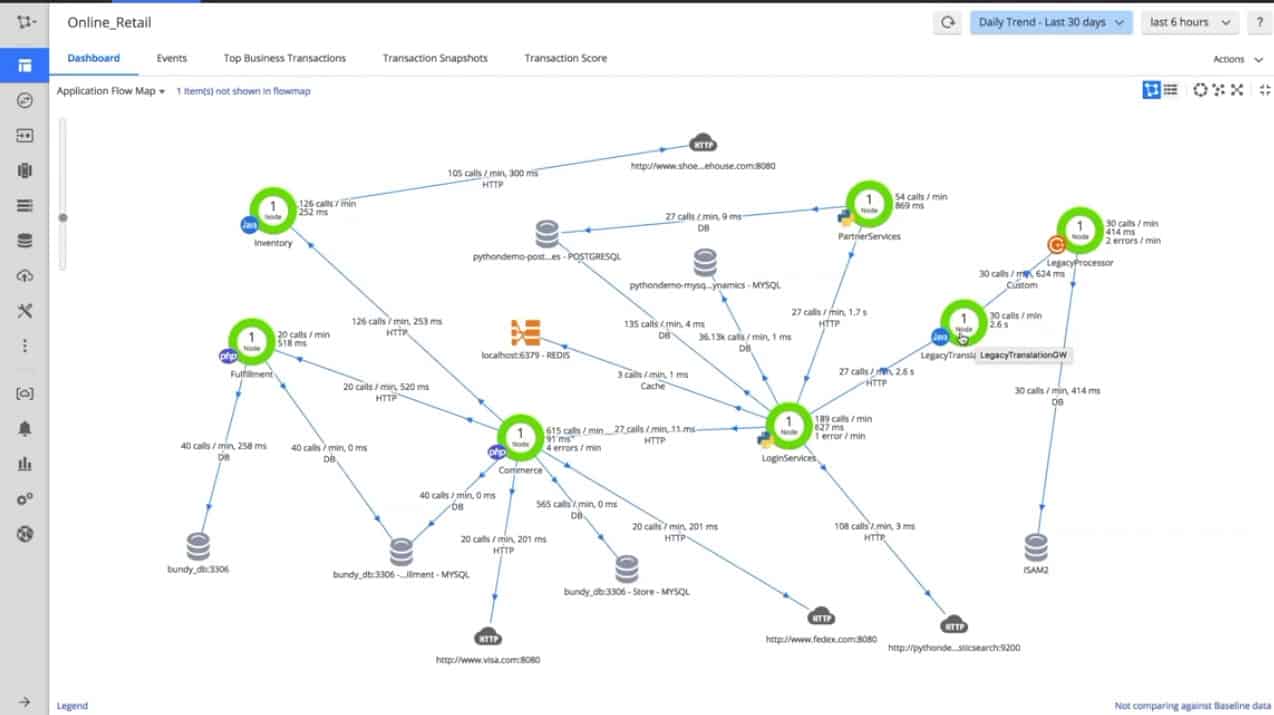
AppDynamics agents give you the overview and understanding of every process and transaction by constructing a complete view of it and sending that information to a centralized AppDynamics controller which then gets a baseline of each service. If a certain service gets beyond or below that baseline, you will be alerted of it and are able to adjust or fix accordingly.
Key Features:
- In-depth process and transaction monitoring
- Centralized control for baseline service monitoring
- Dependency mapping and complex application system troubleshooting
- Robust alerting options
Why do we recommend it?
AppDynamics is recommended for its enterprise-scale monitoring capabilities, offering detailed insights into processes and transactions, aiding in efficient problem resolution.

Who is it recommended for?
Tailored for large development teams and enterprises needing a comprehensive solution for monitoring complex application systems and dependencies.
Pros:
- Tailored for large-scale enterprise use
- Excellent dependency mapping and visualizations to help troubleshoot complex application systems
- Includes a free version
- Robust alerting options
Cons:
- Can have a steep learning curve
- Better suited for larger dev teams
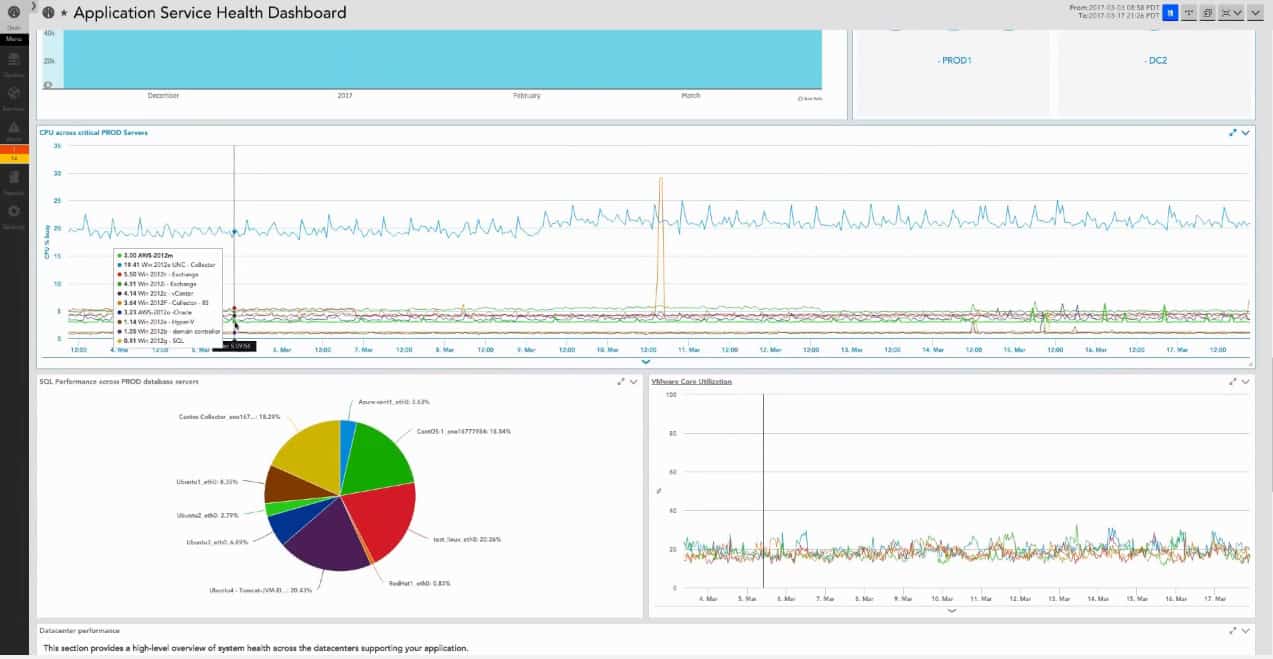
10. SolarWinds Observability SaaS
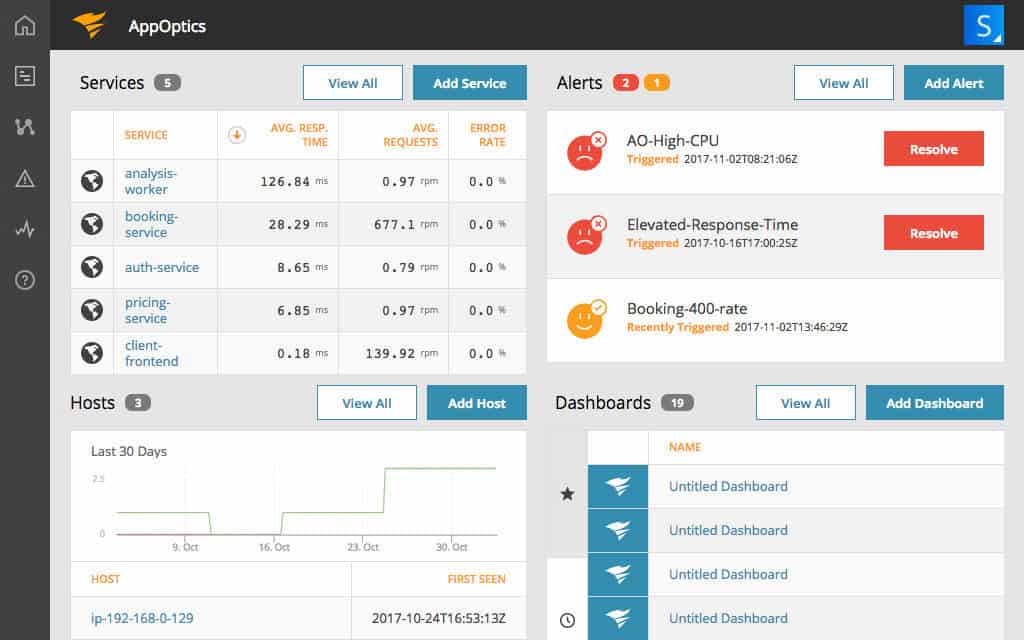
SolarWinds Observability SaaS (formerly AppOptics) is an Saas based software platform from Solarwinds that integrates application, infrastructure and server monitoring into one seamless, centralized platform. It gives you real-time visibility into your applications, along with tracing issues and bottlenecks to quickly visualize how they are affecting performance.
Key Features:
- Multi-dimensional tags for metric aggregation
- Real-time dashboard for tracking performance bottlenecks
- Support for Java, Python, PHP, .NET, Ruby, Node.js, and GO
- Distributed tracing across hosts and data centers
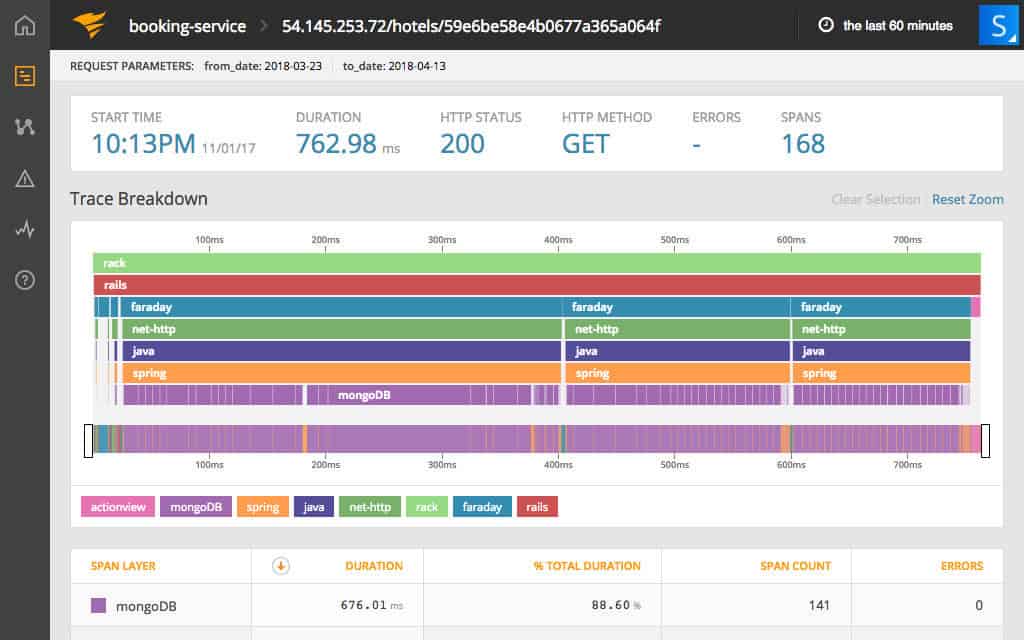
SolarWinds Observability SaaS allows you to monitor a broad set of applications and programming languages which gives you instant visibility without having to switch to other monitoring solutions. The host agent that is used has an active community of plugins for different systems, languages, and services that can be monitored using the fully customizable, real-time dashboard, as seen below.
Trace request from End to end in real-time to see which services are causing bottlenecks in the path. You can further debug performance impacts by drilling down to inspect the requests states using Trace timelines.
Why do we recommend it?
SolarWinds Observability SaaS is recommended for its extensive monitoring capabilities, including detailed application and server performance analysis, making it a superior choice for comprehensive IT environment monitoring.
This tool gives your Precise Traces and metrics to help you solves issues that arise quickly, by isolating outliers and trends using heat-maps which you can then further zoom into to find the root cause.
Who is it recommended for?
This tool is ideal for IT professionals and organizations that require an all-encompassing monitoring solution that offers in-depth insights into application performance and server health.
Pros:
- Offers great visualizations reflecting live and historical health metrics and resource consumption
- Is easily scalable cloud service
- Tracks all major resources focusing on over 180 different metrics
- Can monitor Docker, Azure, and Hyper-V platforms, offering more flexibility than competing options
Cons:
- Would like to see a longer trial period
Conclusion
We hope this list of alternatives to New Relic will help you in your search for finding a replacement software suite for whatever your looking for. Many of these applications have a Free Trial for 14 to 30 Days, so it is worthwhile to sign-up and test this software in your network before actually committing long term!
New Relic Alternatives FAQs
Why is application performance monitoring important?
Application performance monitoring is important because it helps ensure that applications perform optimally and deliver a positive user experience. It enables organizations to proactively identify and resolve issues before they impact users and helps reduce downtime and lost revenue.
What types of applications can be monitored with APM?
APM can be used to monitor a wide range of applications, including web applications, mobile apps, desktop apps, and cloud-based applications.
What are the key features of APM tools?
The key features of APM tools include real-time application performance monitoring, user experience monitoring, code-level diagnostics, automated issue detection and resolution, customizable dashboards and reports, and integrations with other IT management tools.
What are some popular APM tools?
Some popular APM tools include AppDynamics, Dynatrace, New Relic, SolarWinds AppOptics, Datadog, and Stackify.
How does APM work?
APM works by using a combination of agent-based and agentless monitoring to collect performance data from applications, servers, and network infrastructure. This data is analyzed and correlated to provide real-time insights into application performance, identify issues, and provide actionable recommendations for optimization.
Can APM be used for cloud-based applications?
Yes, APM can be used for cloud-based applications by monitoring performance and behavior across hybrid and multi-cloud environments. Many APM tools provide integrations with cloud providers, such as AWS, Azure, and Google Cloud, to provide real-time insights into application performance across cloud environments.


