
Windows Management Instrumentation (WMI) is a framework of system tools that has been built into the Windows Operating system. WMI is accessible over networks and lets users query remote systems to gain information about them. WMI is powerful and flexible, and when used correctly it can deliver the best and most important information about your computers, servers and notebooks.
Here's our list of the best WMI Tools:
- ManageEngine OpManager and Applications Manager – EDITOR'S CHOICE A combination of two modules that will monitor WMI activity and track the application performance that server impairment would damage. Installs on Windows Server. Start a 30-day free trial.
- Paessler PRTG – FREE TRIAL A bundle of monitoring tools that includes a WMI collector. This stores messages in log files and calculates activity summaries for the system console. Available for Windows Server or as a SaaS platform. Get a 30-day free trial.
- SolarWinds WMI Monitor This monitoring system sits on top of WMI, creating a more digestible view of all of the WMI metrics and settings available. The tool includes templates that filter out WMI data to focus on specific applications. Runs on Windows Server.
- Datadog Infrastructure A monitoring system for servers and services that has WMI tracking built into it. This is a cloud-based platform.
- Adrem NetCrunch WMI Tools A toolkit of utilities that are free to use and help administrators get more use out of WMI data. Runs on Windows and Windows Server.
- WMI Query Generators A website listing free tools available for WMI management. Most run on Windows and Windows Server but there are some Linux tools there, too.
- PowerShell A command language built into Windows and Windows Server.
- Hyena WMI A basic companion to WMIO that makes managing the system and extracting data from it a lot easier. Built for Windows and Windows Server.
- NirSoft SimpleWMIView A free, straightforward viewer from WMI output. Installs on Windows and Windows Server.
- WMIX WMI Explorer A free tool for remote access to WMI instances. Tuns on Windows and Windows Server
Information as simple as IP addresses, MAC addresses, and other system-related information is available, all the way to more specific hardware level information such as BIOS versions, serial numbers of internal components, to hardware information such as CPU temperatures, clock speeds, and active cores and similar information.
From here, users can create automated reports that provide detailed information about their systems and networked machines on the network.
Other WMI tools allow for the checking of system information in real-time via the WMI Framework, giving a vast array of information to anyone that wants to see what is happening on any Windows computer or server on the network.
One of the best features of WMI is the fact that all of this information is available to one centrally managed location, which makes managing an entire network as easy as running a simple WMI reporting tool.
The Best WMI Tools for Monitoring, Management & Administration
Our methodology for selecting WMI tools and software
We reviewed various WMI tools and analyzed the options based on the following criteria:
- Query methodology and network support
- Ease of use
- Deployment options
- Graphical interpretation of data, such as charts and graphs
- A free trial period, a demo, or a money-back guarantee for no-risk assessment
- A good price that reflects value for money when compared to the functions offered
1. ManageEngine OpManager and Applications Manager – FREE TRIAL
ManageEngine OpManager is a network and server monitoring tool that includes WMI monitoring procedures. Although the software for OpManager is available for Windows Server and Linux, it can only be installed on Windows Server if you intend to use it for WMI monitoring.
Key Features
- Out-of-the-box monitoring capabilities: Monitors key performance attributes, their usage, and other aspects
- Autodiscover: Finds, maps, and creates an inventory list for new devices
- Alert Options: Trigger alerts using different channels for Windows events and reduces false positives
- Integration Options: Work well with other products in the ManageEngine ecosystem
- Forecasting: compares the historical performance patterns by attribute and forecasts the utilization trends
Unique Feature
It is easy to set up and provides great value for money!

Why do we recommend it?
ManageEngine provide extensive insights on the health and performance of our devices and networks, so we could make informed decisions. It also gives complete control over our entire IT infrastructure.
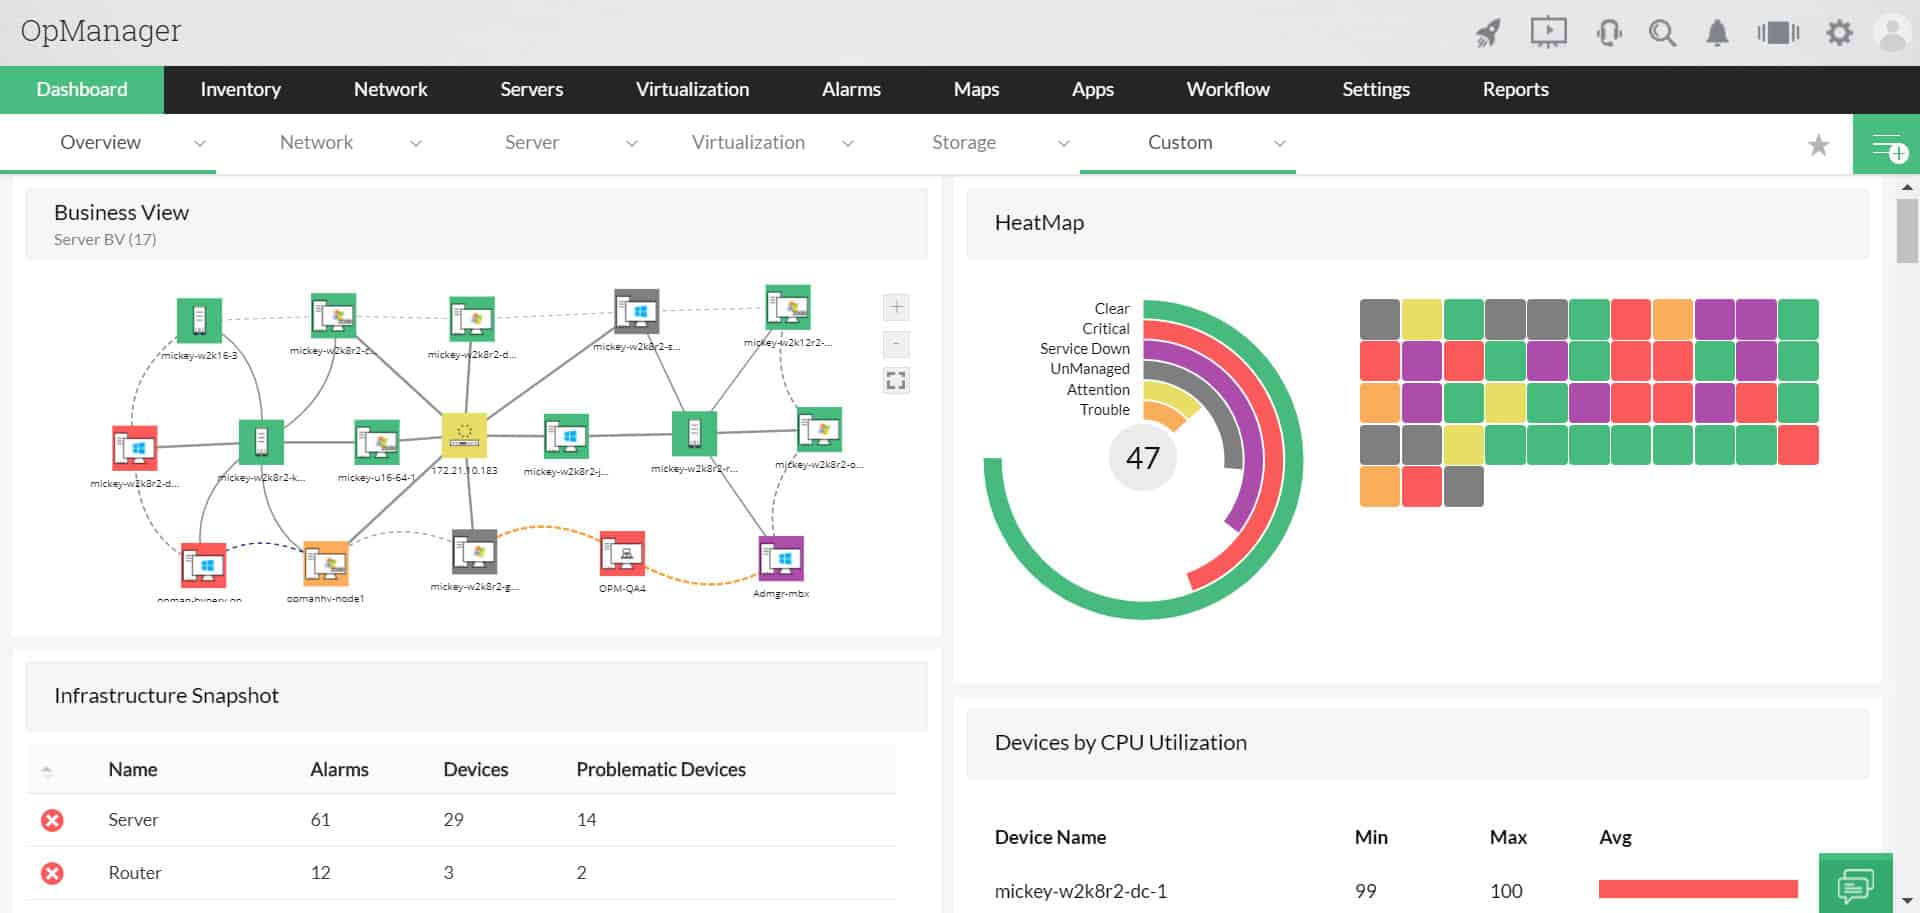
OpManager uses both SNMP and WMI in order to monitor hardware performance. WMI is specifically used to check on all components on a server running Windows. On Linux servers, OpManager just relies on data that comes in from SNMP. The OpManager processing engine interprets WMI data into system status reports. These appear on the console as graphs and statistics. The monitor also stores WMI to provide a time-lapse on live graphs and also as a foundation for historical analysis features within the dashboard.
Manage Engine produces a menu of system monitoring and management tools, each with a specialization. These tools are all written on a common platform and they can fit together to create a much wider, integrated monitoring system.
Applications Manager is another of the tools produced by ManageEngine and it compliments OpManager well in the pursuit of observing server statuses. While OpManager monitors servers, Applications Manager monitors the software that runs on it. The tool is able to map the dependencies of applications, creating a map of supporting services. This can then be linked through to running processes, illustrated by the WMI data provided by OpManager.
Both OpManager and Applications Manager have a system of alerts that get triggered by statuses that cross predefined performance thresholds. The setup of both modules allows addresses to be specified to which notifications can be forwarded should an alert arise. These notifications are sent out by email or SMS message.
Who is it recommended for?
Best for organizations of all sizes, especially large ones that want to monitor an ever-expanding network.
Pros:
- Event Log Monitoring: Watches over event logs of your Windows server and detect anomalies
- Hardware Monitoring: Tracks the hardware components of Windows Server and reduces performance issues
- Customizable widgets: comes with 200+ widgets that can help create unique reports and improve the look and feel of the dashboard
- Quick analysis: helps detect and troubleshoot errors faster with proper analysis
- In-depth insights: generates detailed insights into Windows processes and services
Cons:
- Time Investing tool: Since it comes with various functionalities and features, users may take time to learn them properly
Although Applications Manager can be installed on Linux, if it is to be used in connection with the WMI monitoring functions of OpManager, it needs to be installed on Windows Server. ManageEngine offers a 30-day free trial of OpManager and Applications Manager.
EDITOR'S CHOICE
ManageEngine OpManager and Applications Manager are our two top picks for WMI monitoring because both of these tools implement endpoint monitoring and can even combine to provide full stack observability, reaching from applications down to the network. The OpManager system is primarily a network monitoring and it discovers all of the equipment connected to the network. This includes endpoints. Those endpoints could be running Windows, Windows Server, Linux, Unix, or macOS. The important factor that gets a computer included in the hardware inventory of OpManager is that it has an SNMP agent activated on it. As the name suggests, the Applications Manager focuses on applications. These can be traditional on-premises applications, such as databases or Web servers, or Web applications and websites. As part of the task of watching applications, this package also monitors servers. Both packages gather information from the Windows operating system by collecting WMI messages. So, you can choose either of these packages for WMI monitoring or both – the two systems will appear in a single, common dashboard.
Download: Get a 30-day free trial
Official Site: https://www.manageengine.com/products/applications_manager/download.html
OS: Windows Server, Linux, AWS, and Azure
2. Paessler PRTG – FREE TRIAL

Paessler PRTG is a bundle of tools and the buyer decides which units to activate. It is possible to assemble a full-stack observability package with the monitoring services and the suite includes sensors that follow more than 50 WMI statistics.
Key Features:
- Agentless monitoring: PRTG has low impact on the monitored server because it is a passive collector
- Customizable screens: Pre-written console screens can be adapted and it is possible to create new screens
- Multiple sensors: More than 50 WMI metrics
- Records activity in the operating system: Logs service activity within Windows
- System alerts: Notifications for performance problems

The WMI collectors can contribute to a single screen in the PRTG dashboard. However, it is also possible to split the display of metrics over several screens and even mix them in with data from sensors for other systems, such as servers or network interfaces. The PRTG system comes with a standard dashboard, but it is possible to set up your own by deciding where to place widgets. You can represent data in tables or interpreted into dials or graphs.
The full PRTG package contains many other sensors, not just those for WMI. The bundle includes systems for network monitoring, which include a discovery service. This tool documents all of the devices connected to the network, which includes endpoints. This service will also provide continuous hardware monitoring and that regular scan can be combined with data from WMI to get detailed information of endpoint usage activity.
WMI also delivers information on the usage and performance of applications that run on a Windows endpoint, such as SQL Server databases. So, the WMI monitoring system can provide a lot of information on system activity. WMI doesn’t cover activity on Linux computers. However., there are other sensors in the PRTG package that cover those endpoints.
PRTG includes an alerting mechanism that is based on a series of thresholds. Each metric that is collected is compared to its associated performance threshold and will trigger an alert if there is a mismatch. The alerts will appear in the monitoring dashboard and an administrator can set up the system to forward alerts as notifications by email or SMS.
Pros:
- Combines with SNMP monitoring: Provides detailed information on endpoint activity
- Sensors for Linux monitoring: Can be activated in addition to WMI for Windows
- Full stack observability: Network, server, and application monitoring
- Data logging: Metrics storage for historical analysis
- Multi-level alerting: Troubleshooting tools with root cause analysis
Cons:
- Runs on Windows Server: Won’t run on Linux
Buyers pay for an allowance of sensors and then choose which to activate. The minimum order quantity is 500 but it is possible to use the system for free with only 100 sensors activated. The package will install on Windows Server and Paessler also offers a hosted SaaS version. You can get a 30-day free trial with all sensors activated.
3. SolarWinds WMI Monitor
This application allows you to monitor the real-time performance metrics of any Windows server and applications on your network. This allows you to log in remotely and check a wide array of WMI related settings.
Key Features
- SNMP Monitoring and Packet Analysis: Support monitoring devices remotely and track all data packets in real time
- Pre-built Templates: Offers access to 1200+ monitoring and 1000+ community templates
- Autodiscovery: Identifies newly added devices, maps them, and creates an inventory list in real time
- Infrastructure dependency mapping: helps understand how different components interact and their relationship
- End-to-end monitoring: provides end-to-end visibility into all components and performs constant monitoring
Why do we recommend it?
Though WMI is built into the Windows OS, this tool helped us access some specific information for identifying anomalies in our network. It also helped us with capacity planning when we were ready to expand.
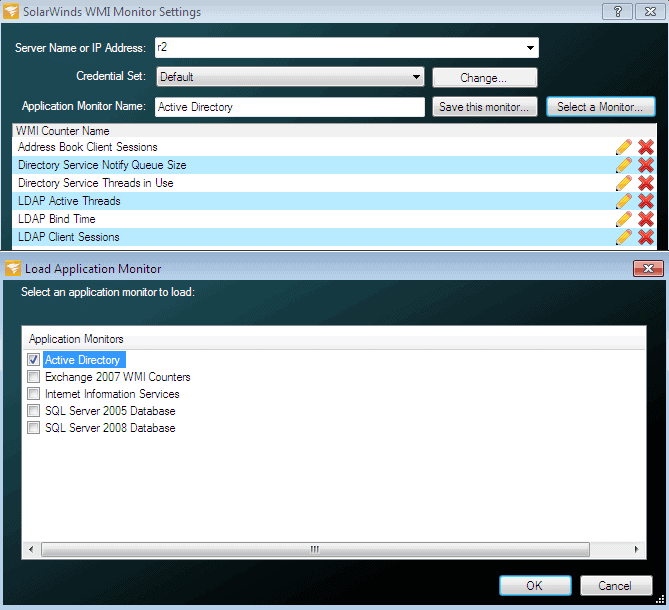
The entire WMI library consists of thousands of different modules and metrics, which means that unless you know exactly which WMI command does what, you will have a lot of research to do before you can compile enough commands to become useful. The SolarWinds WMI Monitor takes out much of the uncertainty that accompanies such a task, allowing you to use only the most relevant WMI counters.
This means that whether you want to monitor your Active Directory Server on your network, or check how the SharePoint installation is running, you will be able to use the right tool for the job.

You have the ability to choose between the pre-built templates that come with the primary installation of this application, or you can use one of the many community created and sourced templates that are shared via THWACK. If you still can’t find what you are looking for, then you can even have a try at creating your own scripts by using the built in WMI Browser within the application. All of this is available in a free to use application that is limited to only one server per installation.
At this point you might be wondering what the WMI reports can tell you about your network, specifically your Windows servers. They can help you to uncover performance issue root causes, and then allows you to fix them as fast as possible.
Who is it recommended for?
Ideal for administrators who want to identify issues in their Windows operating systems and applications.
Pros:
- Quick Setup: SolarWinds WMI Monitor hardly takes any time to install and setup
- Monitoring capabilities: Easier to keep watch over AWS, PaaS, IaaS, SaaS, and Azure solutions
- Reporting: generates comprehensive and customizable reports that help improve organizational efficiency
- Custom dashboard: allows customizing the look and feel of a dashboard using drag-and-drop widgets
- Custom Application monitoring: allows tracking of custom and commercial applications
- Real-time monitoring: Watches over all the Windows server and application metrics in real-time
- Alert options: contains some of the best alerting options that strike a balance between usability and efficacy
Cons:
- Only for Professionals: Non-technical users might find it a bit challenging as it was designed keeping IT professionals in mind.
There is a free version of the SolarWinds WMI Monitor, but it is relatively simple when compared to the full Server & Application Monitor that is offered by SolarWinds.
WMI Monitor is free for 30 days.
4. Datadog Infrastructure
Datadog is a cloud-based SaaS platform that presents a range of infrastructure monitoring and management services, including Datadog Infrastructure. The Infrastructure package from Datadog gathers data on server performance, including the operations of services and applications. The tool is based in the cloud and all of the data processing for the service is hosted on the Datadog servers. However, there needs to be an agent program installed on monitored servers and that system has a WMI data gatherer integrated into it.
Key Features
- Out-of-the-box WMI Integrations: comes with a wide range of integration options that help monitor crucial information
- Real-time visibility: offers visibility into performance metrics and events in real-time
- Data Visualization: Monitors and visualizes all the app data and performance using graphs
- Alerts: automatically detects anomalies/outliers and sends instant alerts

Why do we recommend it?
It provides detailed metrics and reports to help engineering teams optimize and secure your networks. Its flexible pricing and add-ons are a great plus.
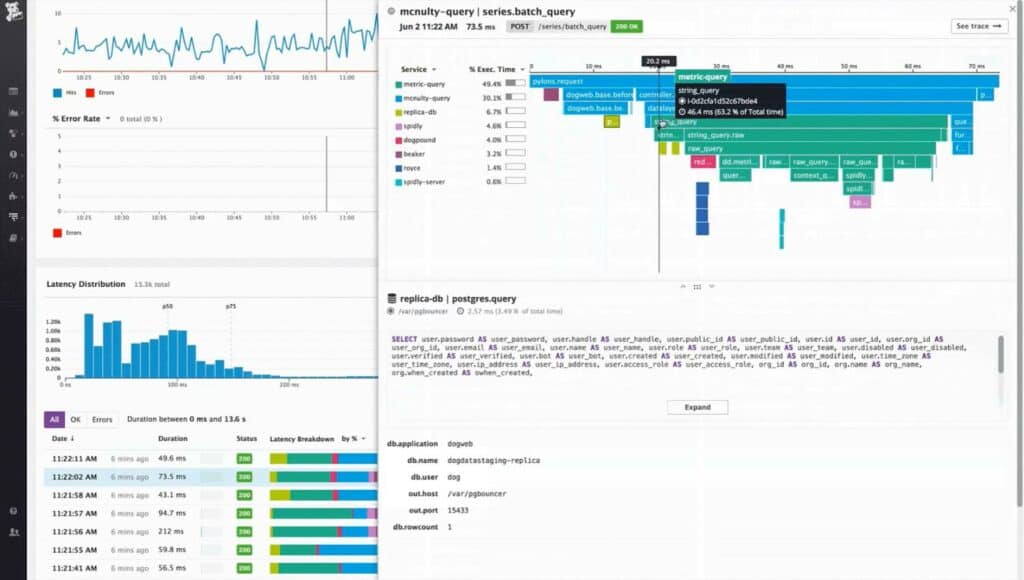
The WMI monitor that is built into the agent program means that all of the information presented in the Datadog Infrastructure console performs WMI monitoring. The dashboard is made up of pre-written screens but it is also possible to customize the system with a guided console screen assembly system. This enables users to put all of the key metrics they need on one screen and also build up stack views for instant problem root cause analysis.
Every metric monitored by Datadog Infrastructure can have performance thresholds applied to them. These denote acceptable service levels. When one of those thresholds gets tripped, Datadog Infrastructure displays an alert in the console. Those alerts can also be forwarded to key personnel via SMS message or email and it is also possible to channel them through collaboration systems, such as Slack.
The highest plan of Datadog Infrastructure uses AI-based machine learning routines to adjust threshold levels. This reduces the number of false alarms raised by the system and improves the alerting system’s credibility.
The console for Datadog is accessed through any standard browser, which means that technicians can be based anywhere, not only in the same building as the monitored servers. Datadog is able to group the monitoring of many servers that could be scatters across the globe.
Who is it recommended for?
Works well on both cloud and hybrid environments.
Pros:
- Excellent dashboards: Ideal custom dashboard for NOC teams and solo admins
- Flexible: scales effectively to a variety of environments
- Collaboration: Tracks live and historical events and analyzes data to understand the root cause of a problem
- Identify bottlenecks: Monitors Windows Metrics and identify bottlenecks and other performance issues
Cons:
- Short Testing Period: The testing period provided by the tool is quite short.
Datadog Infrastructure is offered in three editions: Free, Pro, and Enterprise. The Free version monitors up to five hosts and has a one-day data retention period. The Pro edition has a 15-month data retention period and costs $15 per host per month. Extras, such as AI-based performance thresholds are included in the Enterprise edition, which costs $23 per host per month.
5. Adrem Free WMI Tools
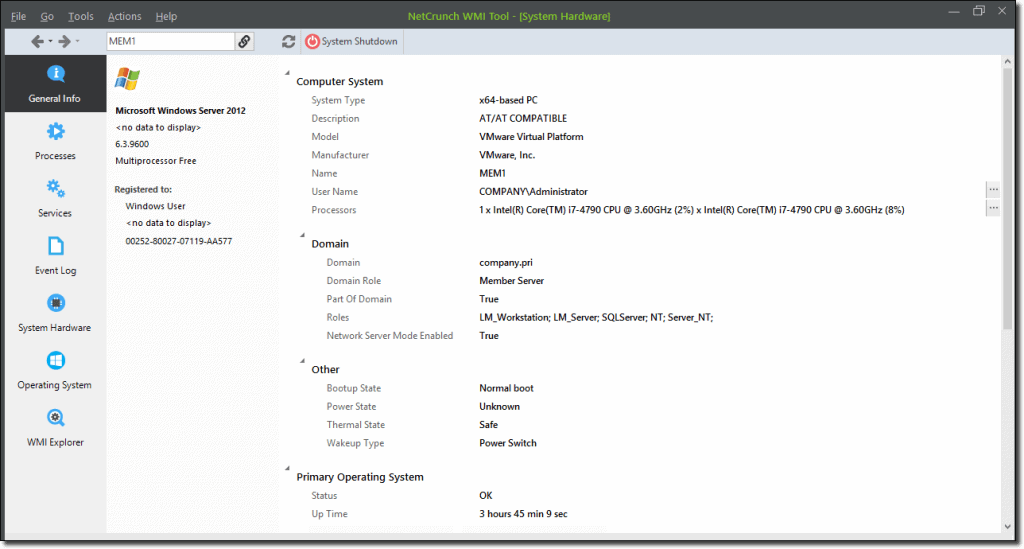
Free WMI Tools offers a free toolkit that allows you to access WMI information both on a local machine and on remote machines as well. This allows you to add your own queries and create custom views. This can range from anything as simple as General Information such as available disk space and RAM availability, or as in-depth as what the active software processes are that are running on your servers. Processing monitoring is a major plus when determining issues with your Windows systems and occasional Operating system hangs and slowdowns.
Key Features
- Quick alert: triggers an alert on anything noticing anything suspicious
- Event log viewer: displays all logs for view and analysis
- Hardware monitoring: watches all hardware components and tracks system health
- Operating System capabilities: includes security patches and software upgrades

Why do we recommend it?
Enables you to access WMI information locally and remotely. You can even add your queries and create custom views as well.
Services that are crucial to running your network applications and keeping your users connected to applications are also available for viewing, which means that if anything suspicious or concerning happens on any of your systems, you will be aware of it. For those that wish to delve into their records within their various servers and computers, there is also an event log viewer that shows all available logs for your queries.
This means that anything from failed user logins to failed applications can be laid bare so that you can weed out any potential issues. Hardware components are also viewable from within the WMI control panel, which means that temperatures and system health is also available for monitoring.
Anything that has a sensor or data that can be attributed to it can be monitored from within this application. Perhaps the most used feature is the Operating System capabilities of this application, which can tell you about anything from software updates to security patches.
If you find that there are WMI features that are not readily available then you can start to browse the WMI queries and create your own.
Who is it recommended for?
A good choice for networking professionals working for small and medium organizations.
Pros:
- Free tool: permits you to access WMI data for free
- Create custom views: Allows adding own queries and custom views as per the preference
- WMI Explorer: create and utilize custom WMI queries in this view
- Processing monitoring: displays resource usage of each running process
Cons:
- Good for Small Networks: Not a great solution for managing extensive or complex environments
Adrem WMI Tools are free.
6. WMI Query Generators
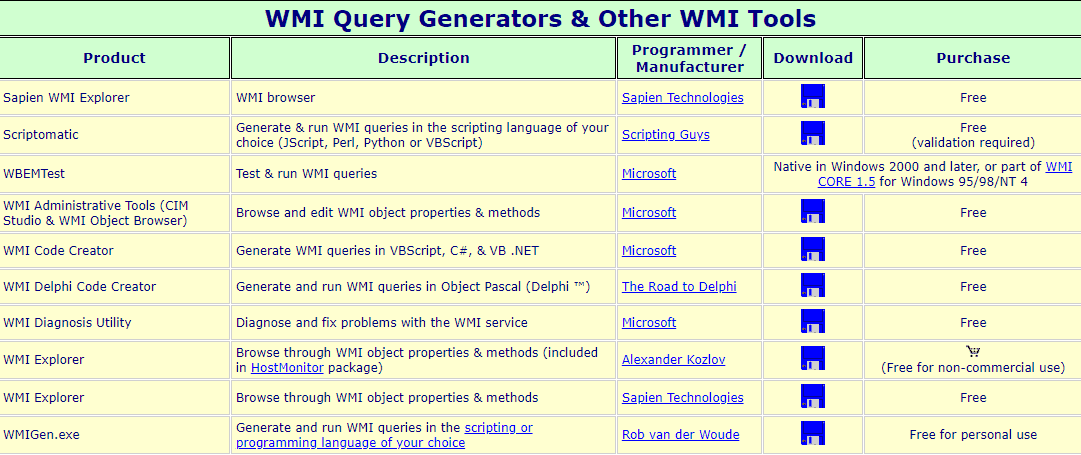
This is a handy website that offers some free tools that will help you to get started with delving into the world of WMI.
Key Features
- WMI management tools: support multiple tools that help explore the WMI environment
- Query Builder: use a visual interface to create complex WMI queries
- Error Handling: sends error messages and recommendations for troubleshooting
Why do we recommend it?
The highlight of this tool is that you can create and run WMI queries in the programming language of your choice. You can also use this tool to browse namespaces and receive information on WMI events.
Some of the applications listed here are actually quite old, but if you are looking for some low level information about how the system works, as well as how you can script with it in Jscript, Perl, Python or VBScript, then this could be quite a valuable learning resource.
There are diagnostic tools and explorers hosted on the site as well, so if you find that you need more information about a specific system on your network then you can look at downloading and installing one of these free programs.
While not as polished as some of the other resources in our list, there is definite utility in using older software like this if you are trying to gain a foundational understanding of how WMI works, and how you can create useful and practical scripts and applications that leverage this powerful framework to provide you with deep levels of information relating to your systems.
Who is it recommended for?
Works well for programmers who want to run custom queries.
Pros:
- Free tools: support free tools that help explore the world of WMI
- Compatibility: Works well with both Linux and Windows operating systems
- Diverse Solutions: Excellent for people who are looking for a variety of options, tools, and resources
Cons:
- Challenging: It could be difficult to navigate and manage several interfaces and functionalities
WMI Query Generators is Free for personal use.
7. PowerShell
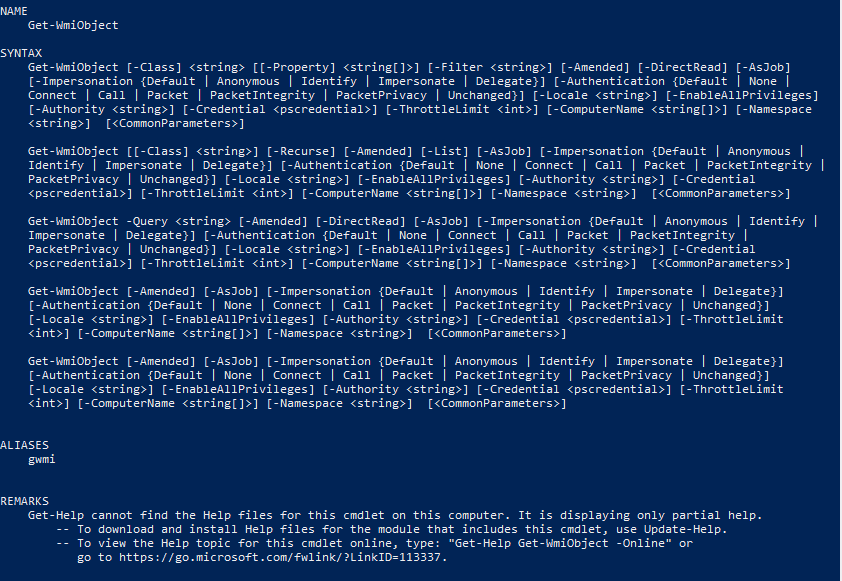
PowerShell is a command line interface that was engineered by Microsoft to help it to compete against Operating Systems such as Linux and Unix. It has incorporated many of the features that have made Linux and Unix such powerful Operating Systems. To this end, PowerShell has been able to become a stable and easy to learn interface that offers users much more than just WMI controls. That is not to say that PowerShell doesn’t have great functionality with WMI though.
Key Features
- Flexibility: allows creating custom commands as per the requirement
- Event Monitoring: Keeps an eye on all events and notifies on finding anything suspicious
- Remote Management: streamlines administrative tasks remotely over a network
Why do we recommend it?
PowerShell executes WMI functionalities through a set of cmdlets. The good part is that you can perform end-to-end management on both remote and local systems using these cmdlets.
There are hundreds of commands that can be built around the WMI interactions from within PowerShell, however the challenge is scripting these functions successfully.
If you are a system administrator, then you already probably know about the power that comes from using PowerShell in scripts and BATCH files. But if you have never heard of it before, now would be a good time to learn more about how to use it and what you can use it for.
The possibilities are limitless, and if you have a specific WMI requirement that needs to be accomplished, then chances are that you can create exactly what you are looking for from the humble PowerShell command prompt.

Who is it recommended for?
A good choice for PowerShell programmers who want to remotely manage WMI functionalities and events.
Pros:
- User-friendly: Easy to use and requires no additional setup or configurations
- Documentation: guides on how to use WMI to your advantage for tasks
- Ideal solution: both beginners and experienced users can use the tool for monitoring WMI data
Cons:
- Limited Interface: makes it impossible to get data from several sources
- No data visualizations: Lack of data visualizations can make it difficult to monitor in the long-term
PowerShell is free with Microsoft Windows Operating Systems.
8. Hyena WMI
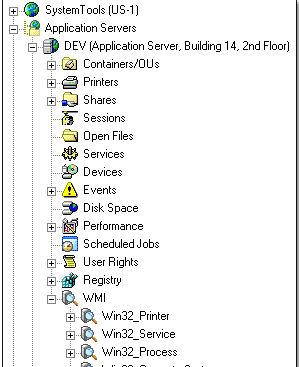
Hyena takes the WMI technology that is built into Microsoft Windows, and makes it even easier to use. WMI allows for manageability and improved vision of system components in a networked environment.
Key Features
- Graphical query builder: allows you to create your own WMI queries
- Filters: Sort and filter different WMI query results and export quickly to Microsoft Excel
- Task Automation: makes maintenance tasks in Windows environments easier and faster
Why do we recommend it?
Enables you to run WMI queries on any number of computers through a GUI interface. You can even do WMI operations on the output.
Microsoft has made many efforts to share scripting knowledge with users, but when it comes to editing old VBScripts, things can be a bit daunting for your average user.
This is where Hyena comes into the picture. Hyena is able to leverage the power of WMI by offering a system that communicates with several computers directly from the GUI.
This is done via a series of queries and even allows Hyena to perform additional WMI queries to the output of the queries.
The most compelling part about this system is that it requires no scripting knowledge on the part of the user, as all of this functionality is wrapped up in an easy to use GUI that is both intuitive and functional.
There are some built in WMI functions that come with the system, and these include:
- Predefined WMI queries for common classes and reports.
- The ability for users to create their own WMI reports
- Network capabilities that allow for queries to be executed on multiple machines simultaneously
- A graphical report builder
- Query result exports to Excel and Access for further data manipulation
There are plenty more features that are available through this system, and the product offers a 30 day free trial for you to demo before deciding on your purchase.
Who is it recommended for?
Well-suited for experienced network professionals working for Managed Service Providers (MSPs).
Pros:
- Predefined WMI queries: offers a wide range of pre-written queries to get you started
- User-defined WMI reports: generates custom inventory reports and WMI queries
- Integration with WMI: helps query system information and automates maintenance tasks
Cons:
- Outdated Interface: The layered menus and outdated UI make it challenging to find certain options
Pricing information is only available through contacting the company directly. A link can be found here.
9. NirSoft SimpleWMIView
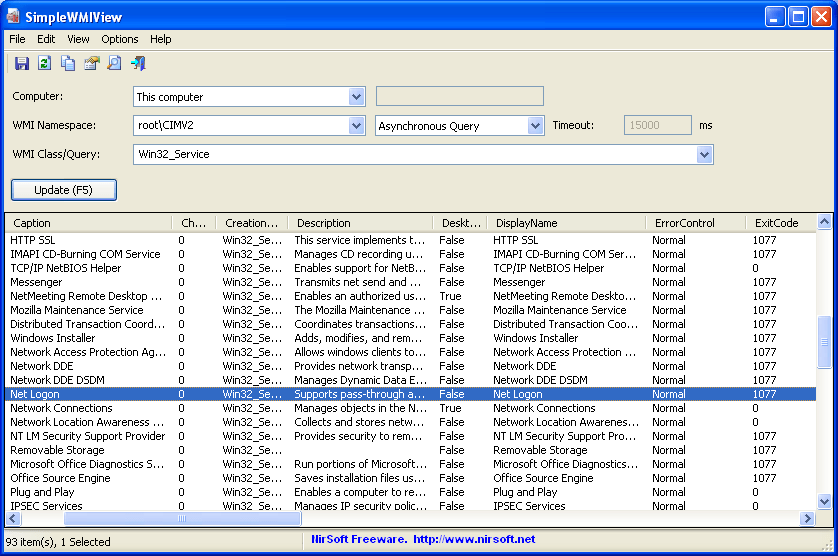
SimpleWMIView is exactly what it says it is: it is a simple tool for Windows which displays any and all of the the results of the many WMI queries that you may wish to run on your network in a simple table.
Key Features
- Filters: comes with pre-set filters for data sorting
- Completely free: The tool is free to download and use
- Interface: supports both GUI and CLI interfaces
Why do we recommend it?
A simple tool that displays WMI outputs in an easy-to-read table. You can also easily export this information to other tools for further processing.
This means that you can easily export the data to multiple different data formats. There are many different types of WMI commands that you may wish to run, and this application has many pre built queries that you may wish to use straight from the get go.
This application is somewhat unique in our list of programs as it also allows users to run it as a command prompt application. The output is therefore easier to automate into your scripting and automated reports that you might need to run at set intervals, making this quite a handy reporting tools as well.
Any and all WMI related information can be custom scripted into your environment, giving you a powerful tool at your disposal.
Who is it recommended for?
Works best for network engineers who want to combine WMI with other information to gain a holistic view of the network.
Pros:
- Simple Interface: Both beginners and professionals can use its features easily thanks to its simple interface
- Retrieve WMI Data: Users can access a variety of data kept in the WMI database
- Export Capabilities: Supports exporting WMI data in different file formats
Cons:
- Reporting: Does not support generating detailed reports as well as different export formats
NirSoft SimpleWMIView is free.
10. WMIX Free WMI Tools
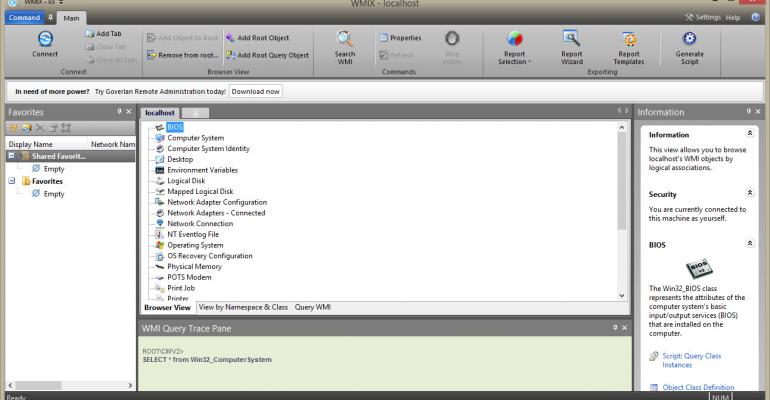
WMIX Free WMI Tools allows you to perform agentless Windows administration tasks remotely, which is what WMI enables you to do. Where this program differs from directly using WMI tools is that you do not need to understand how to script, nor do you need to know how to interpret vast amounts of data.
Key Features
- Open Source and Free: The tool and source code is accessible to everyone for free
- Remote task management: the ability to remotely carry out agentless Windows administration operations
- Modern GUI: makes it simple and quick for users to construct effective queries and reports
The program extracts and displays all of this data for you in a simple-to-use window. Once you have created your query, the program allows users to export the command that underpins the query to popular formats such as PowerShell or Visual Basic WMI Scripts.
This means that once the hard work has been done by the application, you can simply extract the commands that you need and then integrate them into your scripting or programs.
The GUI is modern and sleek, and it allows users to navigate the inner workings of the WMI system quickly and easily while building powerful queries and reports.
Pros:
- Ease of Use: compared to other tools, it is relatively easier to use
- Several file formats: enables users to export the command Visual Basic WMI Scripts or PowerShell formats
- No expert skills: The tool does not demand expertise in understanding how to script or interpret large data
Cons:
- Community response: bugs in open-source software can take some time to resolve
Pricing starts at $29 per month (paid annually).
Conclusion
There are so many great WMI tools out there that it can be difficult trying to find the right one for you. The great thing about all of this choice is that there is nothing stopping you from trying them all!
Even the applications that are not free will have a trial period that you can at least demo the products with, meaning that you can experiment with the applications before you have to commit to anything.
We always suggest trying out multiple tools until you find the one that suits you best!
WMI Tools & Software FAQs
What types of information can be obtained with WMI tools?
WMI tools can be used to obtain a wide range of information about the Windows operating system and associated hardware and software components, including system properties, software and hardware inventory, performance data, event logs, and security information, among others.
How do WMI tools work?
WMI tools work by using WMI APIs to access and query WMI data, and then presenting the data in a user-friendly format. WMI tools can be used to view and query WMI data locally or remotely, and can support a variety of output formats, including text, CSV, and HTML.
What types of tasks can be performed with WMI tools?
WMI tools can be used to perform a wide range of tasks, including software and hardware inventory, software deployment, security configuration, system monitoring, and troubleshooting.
What types of user access and permissions are required for using WMI tools?
Depending on the specific tool and the type of task being performed, WMI tools may require administrative privileges, or more granular permissions to access and query specific WMI data.
What are some best practices for using WMI tools?
Some best practices for using WMI tools include understanding the specific WMI namespace and class being queried, using filters and queries to narrow down results, and verifying the results with other system monitoring tools. It is also important to ensure that WMI is enabled and configured correctly on the target systems, and to use WMI tools only for legitimate and authorized purposes.
Related Post: Windows Monitoring Software and Tools


