
Cloud computing is rapidly evolving and transforming the way you manage your IT infrastructure. Myriads of organizations rely on the Google Cloud Platform (GCP), due to its potential to deliver on-demand scalability, flexibility, and cost-effectiveness to run their infrastructure and business-critical applications.
But for GCP to work efficiently, you need to monitor its health and performance round the clock. You need to leverage modern monitoring tools that will precisely monitor the critical metrics and identity issues in real-time before they affect the end-user or cause disruptions.
In this post, we are going to review the nine Best Google Cloud Monitoring tools and see how they can help you keep an eye on important KPIs of your cloud environment.
Here’s our list of the Best Google Cloud Monitoring Tools:
- ManageEngine Applications Manager – FREE TRIAL This system tracks applications, middleware, services, and platform, including on-premises servers and cloud platforms, such as GCP. Available for Windows Server, Linux, AWS, and Azure. Get a 30-day free trial.
- Site24x7 GCP Monitoring – FREE TRIAL Τop-rated Google Cloud Platform (GCP) Monitoring tool to monitor the health and performance of your entire GCP stack in real-time including a hybrid cloud and multi-cloud environment. Start a 30-day free trial.
- Paessler PRTG Cloud Monitoring – FREE TRIAL Cloud management tool that uses pre-customized sensors to monitor various cloud management services including Azure, AWS, and Google Cloud Platform. Start a 30-day free trial.
- ManageEngine OpManager Nexus – FREE TRIAL A unified observability platform that correlates metrics and logs to detect performance issues in Google Cloud. Start a 30-day free trial.
- Datadog A powerful GCP monitoring tool that gathers and displays an overview of data across these complex environments.
- Netdata Cloud Α popular infrastructure monitoring solution that monitors application health and performance and helps you optimize systems across the entire tech stack.
- Sematext Server monitoring that works on Google Cloud Platform, IBM Cloud, AWS EC2, Azure, DigitalOcean, and other platforms.
- AppDynamics Unifies business and application performance monitoring to boost business impact.
- New Relic A modern, intuitive Google Cloud Platform (GCP) monitoring tool that unifies observability for the platform.
- SolarWinds Hybrid Cloud Observability This service is able to monitor on-premises and cloud-based facilities, including Google Cloud Platform.
Why do we need “Cloud Monitoring”?
Cloud monitoring tools help you visualize and monitor the performance metrics and health of your cloud applications or services. These modern tools extract data in real-time related to your cloud resources and show it systematically in a single console. It keeps an eye on resource allocation, network availability, application performance, and other such cloud-related metrics.
With cloud monitoring tools, IT managers can ensure consistent and optimal performance of their cloud systems, with minimal downtimes.
To summarize, cloud monitoring tools can help organizations with the following tasks:
- Monitor health and performance of cloud-based services or applications
- Identify unusual activities or behavior
- Visualize and map resources and cloud ecosystem
- Recommend best practices to ensure optimal and consistent performance
- Evaluate resource levels, speed, and server response times to predict future vulnerabilities
- Retain maximum uptime of servers, infrastructure, and applications
- Enhance business continuity and reduce operating risks
Our methodology for selecting the Best Google Cloud Monitoring tool:
We've broken down our analysis for you based on these key criteria:
- Priority given to tools that provide live updates on system performance and health.
- Preference for tools that support various cloud platforms, including GCP, AWS, and Azure.
- Tools offering AI-driven insights and automated problem detection are highly valued.
- Emphasis on tools with intuitive dashboards and easy navigation.
- Tools that offer detailed reports, alerts, and actionable insights rank higher.
The Best Google Cloud Monitoring Tools:
1. ManageEngine Applications Manager – FREE TRIAL
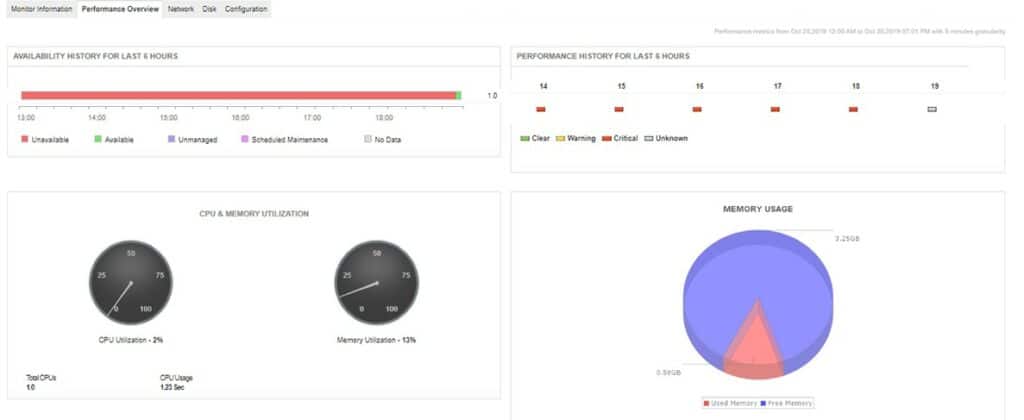
ManageEngine Applications Manager is a performance monitoring system for applications but it also tracks services, platforms, and operating systems. Its capabilities extend to Google Cloud Platform accounts. It is able to monitor performance metrics for Google Compute Engine, Cloud Storage, Cloud Filestore, and Kubernetes. The system can also track services on AWS, Azure, and Oracle Cloud Infrastructure.
Key features:
- Monitors CPU capacity and utilization for Compute accounts
- Monitors memory usage and interface capacity
- Identifies storage usage, enabling capacity planning
- Links platform capacity to application activity
- Creates an application dependency map that identifies all contributing components, which could be hosted on different platforms
Feature distinction
Applications Manager supports Cloud Filestore, Compute Engine, Kubernetes monitoring, and cloud storage services of GCP. You can use this tool to gain actionable insights for optimizing these services.
Why do we recommend it?
ManageEngine Applications Manager is a versatile tool that provides in-depth monitoring for various applications, services, and platforms, including GCP. Its strengths lie in resource monitoring, application dependency mapping, and alerting on potential performance issues.

Who is it recommended for?
Recommended for IT administrators who need a comprehensive tool to monitor performance metrics across different cloud services and platforms, particularly useful for capacity planning and ensuring optimal performance.
Pros:
- Options to host on-premises or on-cloud accounts
- Identifies resource shortages
- Alerts for potential performance problems
Cons:
- Not a SaaS package
Try out the full Applications Manager package with a 30-day free trial.
2. Site24x7 GCP Monitoring – FREE TRIAL
Site24x7 offers a top-rated Google Cloud Platform (GCP) Monitoring tool to monitor the health and performance of your entire GCP stack in real-time including a hybrid cloud and multi-cloud environment. It extracts actionable insights regarding customer behavior, security, and performance of applications with its modern automation abilities and AI-powered predictions.
Key Features
- Full Stack Discovery capability allows you to monitor and auto-discover GAE (Google App Engine), GCE (Google Compute Engine), GKE (Google Kubernetes Engine), Cloud SQL, Cloud IAM, VPC, BigQuery, Cloud Audit Logging, and more.
- Leverages IT automation tools to auto-resolve problematic resources and respond to performance issues.
- Automate event alerts and configure fail-safes without human intervention.
- AI-based predictions help you identify the root cause of the problem. AI engine allows you to deeply understand dependencies, anomalies, and events and find solutions before it harms the end-user.
- It can monitor organizational hybrid and multi-cloud environments through a single console including AWS, Microsoft Azure, and GCP.
- Extracts data related to your organization’s cloud capacity planning, resource utilization, operations, etc, and resolve issues proactively.
- Custom dashboards feature allows you to add your own charts, explore numerous performance metrics and create visual dashboards to get an overview of data across various GCP services.
- Over 100+ plugins integrations including MySQL, NGINX, WebLogic, Hadoop, and more.
- Get deeper visibility into serverless FaaS platforms such as GCF (Google Cloud Functions).
Feature distinction
Site24X7 offers a comprehensive view of more than 20 GCP services to identify and fix bottlenecks.
Why do we recommend it?
Site24x7 excels in real-time monitoring of GCP stacks, offering AI-powered predictions and IT automation for proactive issue resolution. Its ability to monitor hybrid and multi-cloud environments from a single console is a standout feature.

Who is it recommended for?
This tool is particularly beneficial for organizations utilizing GCP along with other cloud services, needing a unified monitoring solution with advanced AI capabilities for performance optimization and issue prevention.
Pros:
- Flexible cloud-based monitoring option
- Offers a host of out-of-box monitoring options and dashboard templates for SQL server
- Allows administrators to view dependencies within the application stack, good for building SLAs and optimizing uptime
- Offers root cause analysis enhanced by AI to fix technical issues faster
- Can unify SQL monitoring across multi-cloud environments
Cons:
- Site24x7 is a feature-rich platform with options that extended beyond databases management, may require time to learn all options and features
Price: Start with a 30-day free trial and get a quote once you register.
3. Paessler PRTG Cloud Monitoring – FREE TRIAL
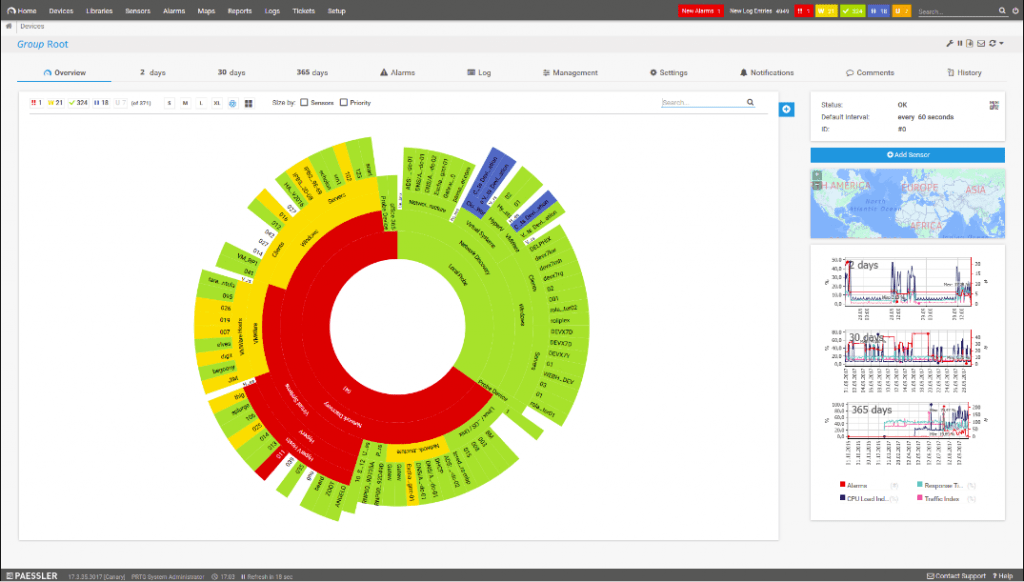
Paessler PRTG Cloud Monitoring tool provides an all-in-one view of your cloud services. It is a powerful cloud management tool that uses pre-customized sensors to monitor various cloud management services including Azure, AWS, and Google Cloud Platform. The PRTG “sensors” are monitoring tools responsible to monitor one measured value in your network. You can easily deploy PRTG Network Monitor into your GCP, AWS, and Azure platforms.
Key features
- Monitor global average response time.
- Resolve problems before the end-user takes action.
- Sends alerts when it detects potential issues or when a threshold value is exceeded. You get to define the threshold values.
- Central dashboard and app for the entire network and all your servers.
- Pre-configured device templates and auto-discovery features make it easier to get started with PRTG.
Feature distinction
PRTG offers many cloud-based sensors that can monitor services worldwide. You can even create a custom cloud sensor to meet your specific monitoring requirements.
Why do we recommend it?
Paessler PRTG provides comprehensive monitoring of cloud services with its pre-customized sensors. Its all-in-one view and alerting system for potential issues ensure effective cloud management across platforms like GCP, Azure, and AWS.

Who is it recommended for?
Ideal for IT teams seeking an all-encompassing cloud monitoring solution with a focus on ease of use, customizable reports, and a wide range of alert options.
Pros:
- Drag and drop editor makes it easy to build custom views and reports
- Supports a wide range of alert mediums such as SMS, email, and third-party integrations into platforms like Slack
- Supports a freeware version
Cons:
- Is a very comprehensive platform with many features and moving parts that require time to learn
You can test out Paessler PRTG Cloud Monitoring free through a 30-day free trial.
4. ManageEngine OpManager Nexus – FREE TRIAL

ManageEngine OpManager Nexus, formerly OpManager Plus,
offers deep cloud observability into every layer of your operations. It works well across Compute Engine, Google Kubernetes Engine (GKE) clusters, Cloud SQL, and platform services. Specifically, it correlates data from these services to improve your GCP’s performance.
Key Features:
- Correlates traces and telemetry signals to detect performance issues.
- Tracks a wide range of metrics, like CPU usage, disk utilization, I/O performance, memory usage, network throughput, and more.
- Monitors requests across services for unified views.
- Identifies unusual activities and their root causes.
- Leverages AI to quickly resolve Google AI incidents.
- Comes with prebuilt and customizable dashboards for real-time visibility.
Feature Distinction
Tracks compute and storage usage to identify overprovisioned or underutilized resources.
Why do we recommend it?
We recommend OpManager Nexus for monitoring GCPs because of its comprehensive approach. It correlates metrics from multiple services and analyzes them for deep visibility and insights. The best part is that all these insights are displayed on intuitive dashboards, so you can understand the data easily. Using this information, you can make informed decisions.

Who is it recommended for?
It is a good choice for cloud observability engineers, SREs, infrastructure managers, cloud app owners, and enterprises running multiple applications on the Google Cloud Platform.
Pros:
- Identifies resource wastage before they impact operations.
- Triggers incident responses through automated workflows.
- Connects infrastructure and security information on a single pane.
- Tracks request flows across all Google services.
Cons:
- Extensive features, which can be overwhelming for small teams.
ManageEngine OpManager Nexus has two pricing editions (all prices are per year):
- Professional – $1,233 for 50 devices
- Enterprise – $19,995 for 1000 devices
Start a 30-day free trial .
5. Datadog
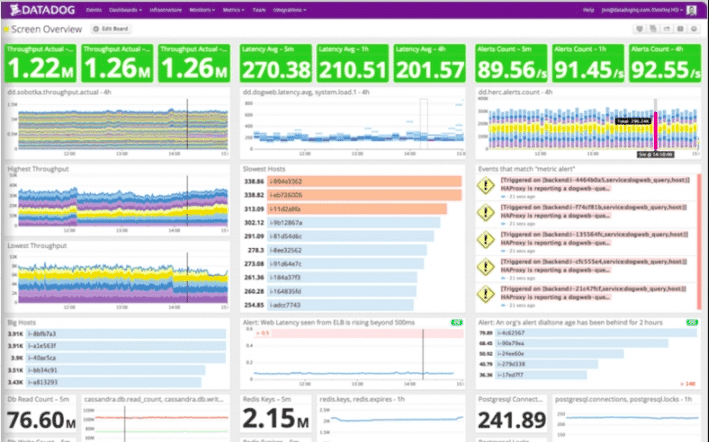
Datadog GCP considerably reduces upfront infrastructure costs for organizations and helps them deliver products/services faster to the market. With GCP, you can deploy scalable, distributed infrastructure but at the same time, you need to monitor every layer of this dynamic stack to detect performance issues.
Key Features
- Out-of-the-box integration dashboards provide an insightful overview of your every GCP service.
- Track and monitor each and every phase of a GCP migration to meet the desired benchmark.
- Over 400+ integrations help you monitor various application services during migration.
- Host Map extracts real-time data such as CPU usage, network throughput, etc. for all hosts present in availability zones to analyze their performance throughout the migration process.
- Unifies observability data from various environments such as hybrid and multi-cloud environments to get cross-platform visibility into applications.
- Service Map feature helps teams visualize the dependencies between containers, databases, APIs, and more. This makes it easier to follow data streaming from On-Premises to GCP architectures.
- Integrates with Google Cloud Run to gather data in real-time, monitor resources as soon as they are created, and automatically scale with GCP infrastructure.
- Integrates with Slack, PagerDuty, JIRA, and a wide range of collaboration-friendly tools to promote real-time collaboration.
Why do we recommend it?
Datadog offers extensive monitoring capabilities across cloud environments, including GCP. Its integration dashboards and ability to track every phase of GCP migration make it a powerful tool for performance analysis and optimization.
Datadog has a powerful GCP monitoring tool that gathers and displays an overview of data across these complex environments. It offers support for GCP services via integration that is easy to install. Moreover, you can also directly deploy Datadog Agent to your cloud instances and hosts to gather granular KPIs.

Who is it recommended for?
Recommended for businesses undergoing cloud migration or managing complex cloud infrastructures, looking for a tool that offers deep insights and real-time monitoring of their cloud services.
Pros:
- Provides quick insights into local and cloud servers through templates and prebuilt monitors
- Great interface, easy to use, and highly customizable
- Cloud-based SaaS product allows monitoring with no server deployments or onboarding fees
- Supports auto-discovery that builds network topology maps on the fly
Cons:
- Would like to see a longer 30-day trial
6. Netdata Cloud
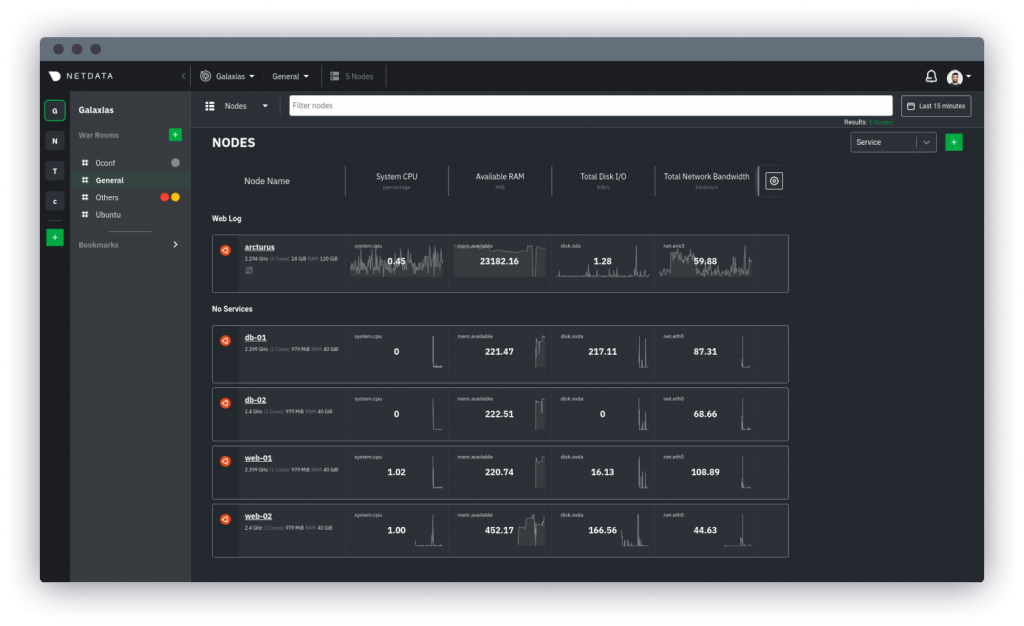
Netdata Cloud is a popular infrastructure monitoring tool that monitors application health and performance and helps you optimize systems across the entire tech stack. It can derive real-time per-second metrics for every node streamed.
Key Features
- Monitors and troubleshoots performance issues. Helps you learn from anomalies, collaborate with teams, and find solutions faster.
- Zero-configuration install gets the tool up and running in minutes.
- Includes custom dashboards, pre-built alarms, and per-second metrics for every node.
- You can explore a wide range of metrics at any scale with no limits.
- Monitor systems, gather real-time metrics and correlate them to troubleshoot the slowdowns all through a single console.
- Set performance threshold values and get automated alarms from affected nodes.
- The alarm panel will display the current values, affected charts, active alarms, and time when the analogy began. This helps IT teams mitigate risks and resolve issues to reduce MTTR.
Why do we recommend it?
Netdata Cloud is a popular choice for real-time monitoring and optimization across tech stacks. Its zero-configuration setup, custom dashboards, and intelligent alerting system make it a user-friendly and effective tool for infrastructure monitoring.
To resolve issues faster, the Netdata Cloud monitoring tool sends intelligent alerts, so teams can take action immediately. For analysis, you can drill down into metric correlations, collaboration tools, pre-built dashboards, and composite charts.

Who is it recommended for?
Suited for larger network environments where real-time metrics, easy troubleshooting, and minimal configuration are key requirements for infrastructure monitoring.
Pros:
- Simple yet intuitive interface
- Uses intelligent alerting to reduce false positives
- Can quickly drill down from top view metrics into granular details
- Requires no configuration – works well out of the box
Cons:
- Better suited for larger network environments
7. Sematext
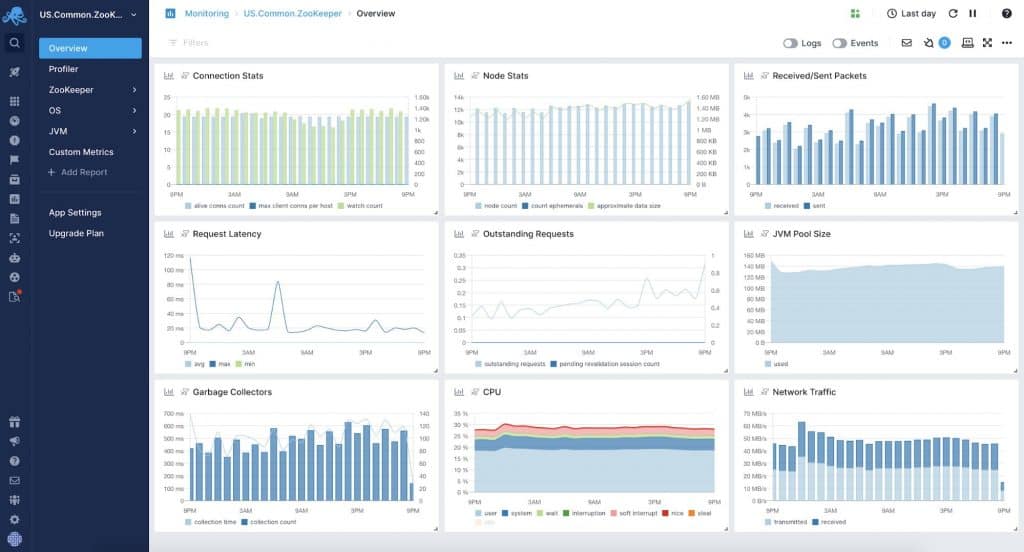
Sematext Cloud-based Server monitoring tool works on Google Cloud Platform, IBM Cloud, AWS EC2, Azure, DigitalOcean, and other platforms.
Key Features
- Gather critical performance metrics along with historical and current data for deeper analysis.
- Filter with the help of tags, pods, network interfaces, disks, etc.
- Get instant alerts on metrics of any service in server monitoring.
- A broad overview of all your infrastructure health and performance.
- Visualizes data for better capacity planning and optimal performance.
- Easy to set up and runs on Ubuntu, RedHat, CentOS, Debian, and other systems.
- It is a single GoLang binary with zero dependencies and uses little memory.
- Gathers all critical system metrics, network connection info, and processes.
- Spots underutilized resources, hot servers, and dying servers.
- Deployable in non-orchestration and orchestrated environments.
- Browse log files installed packages, etc. to drill down into more than just metrics.
Why do we recommend it?
Sematext stands out for its flexible server monitoring capabilities across various platforms including GCP. It offers comprehensive insights into infrastructure health and performance, facilitated by its powerful monitoring agent.
The power-packed monitoring agent gathers tags from cloud-specific sources. Plus, it is extremely easy to install and has a small footprint. It can collect historical and current utilization of containers, servers, or cloud instances and display critical metrics such as IO, disk usage, memory, CPU, network, load, and so on.

Who is it recommended for?
Ideal for organizations looking for a server monitoring tool that is easy to set up and run, offering detailed visualization and critical performance metrics across multiple cloud environments.
Pros:
- Uses Elasticsearch for flexible query options
- Supports data outside of just event logs such as SNMP reports
- Supports threshold-based alerts, ideal for maintaining SLAs
- Has a freeware version for testing
Cons:
- No on-premise version
- Relies on Kibana for data visualization
8. AppDynamics
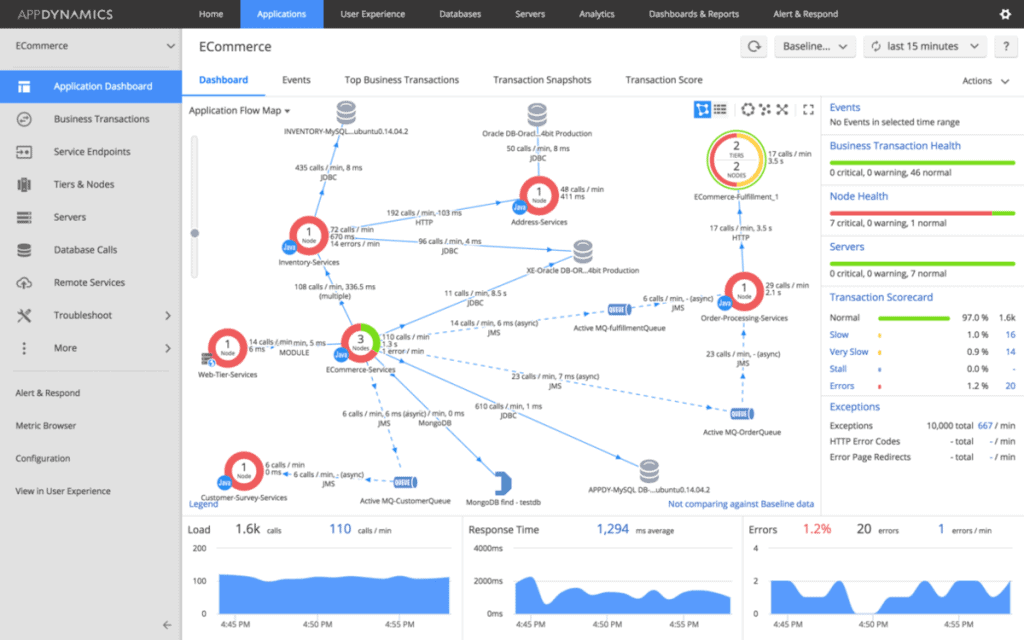
AppDynamics is yet another powerful tool that unifies business and application performance monitoring to boost business impact. It is able to meet your application intelligence needs, no matter what environment they run on. It can monitor apps in the cloud, on-premises, or in a hybrid environment.
Key Features
- Monitors cloud-native application on Google Cloud Platform in real-time, right from code level to user experiences.
- Reduces complexities and resolves performance issues with its end-to-end and proactive performance monitoring.
- Helps deliver better customer experiences with end-user monitoring.
- Provides deeper visibility into server and database infrastructures to make sure applications run seamlessly with better support.
- Flexible deployment model available via Google’s Cloud Platform, SaaS, or on-premises.
- Can monitor applications in hybrid environments through a single console
- Detects anomalies based on automatic dynamic baselines and set SLAs.
Why do we recommend it?
AppDynamics excels in unifying business and application performance monitoring, offering real-time monitoring and reducing complexities in cloud-native applications on platforms like GCP.

Who is it recommended for?
Best suited for large-scale enterprises that require extensive monitoring of their applications in the cloud, on-premises, or hybrid environments, with a focus on enhancing customer experiences and application support.
Pros:
- Tailored for large-scale enterprise use
- Excellent dependency mapping and visualizations to help troubleshoot complex application systems
- Includes a free version
Cons:
- Would like to see more templates for real-user monitoring
9. New Relic
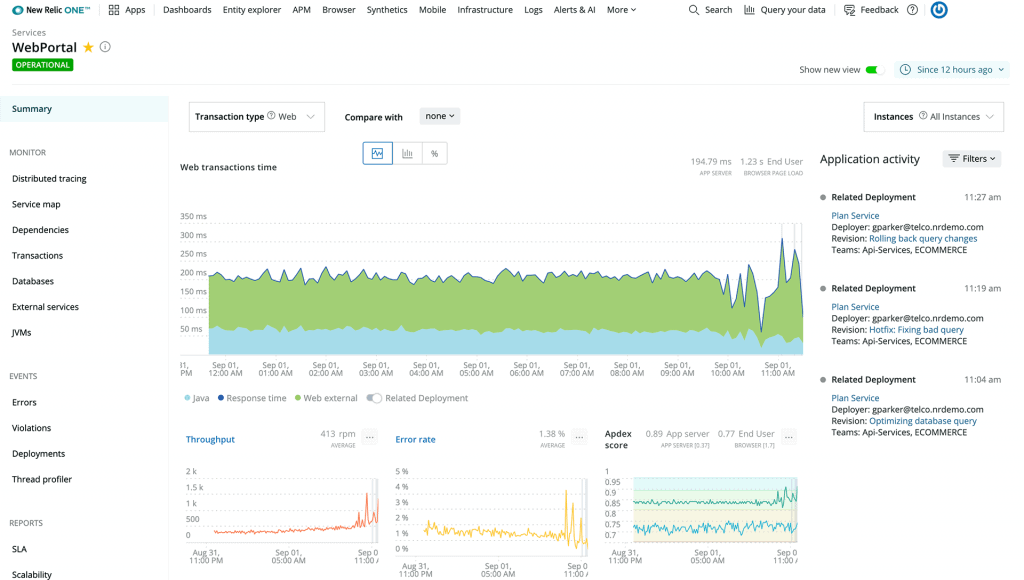
New Relic is a modern, intuitive Google Cloud Platform (GCP) monitoring tool that unifies observability for the platform. Drill down into the visibility of applications, infrastructure, and digital customer experiences on GCP with this feature-packed monitoring agent.
Key Features
- Offers end-to-end observability into events, metrics, logs, and traces correlated across all your GCP deployments.
- Cloud Adoption Solution (CAS) framework helps you quickly migrate and modernize your infrastructure from on-premises to GCP.
- Kubernetes Cluster Explorer tool offers ready-to-use visualization and navigation for Istio service mesh, Cloud Run serverless and Anthos hybrid services.
- Deeper visibility into Google’s microservices deployments and Kubernetes elements. Helps IT leaders to analyze performance metrics and find out the root cause of problems.
- Build visual dashboard experiences for stakeholders, operators, and developers.
- AI-based operations boost efficiencies related to incident remediation, anomaly detection, pattern recognition, and more.
Why do we recommend it?
New Relic provides a modern and intuitive monitoring solution for GCP, offering comprehensive observability across applications, infrastructure, and digital customer experiences.

Who is it recommended for?
Ideal for organizations looking for a tool to facilitate cloud migration and modernization, providing deep visibility and AI-based operations for efficient cloud management and incident remediation.
Pros:
- Certified for Microsoft Azure monitoring
- Uses anomaly detection to highlight abnormal behavior in your Azure environment
- Uses simple but intuitive admin dashboards
Cons:
- Better suited for small to medium-sized Azure networks
Related Post: New Relic Alternatives
10. SolarWinds Hybrid Cloud Observability
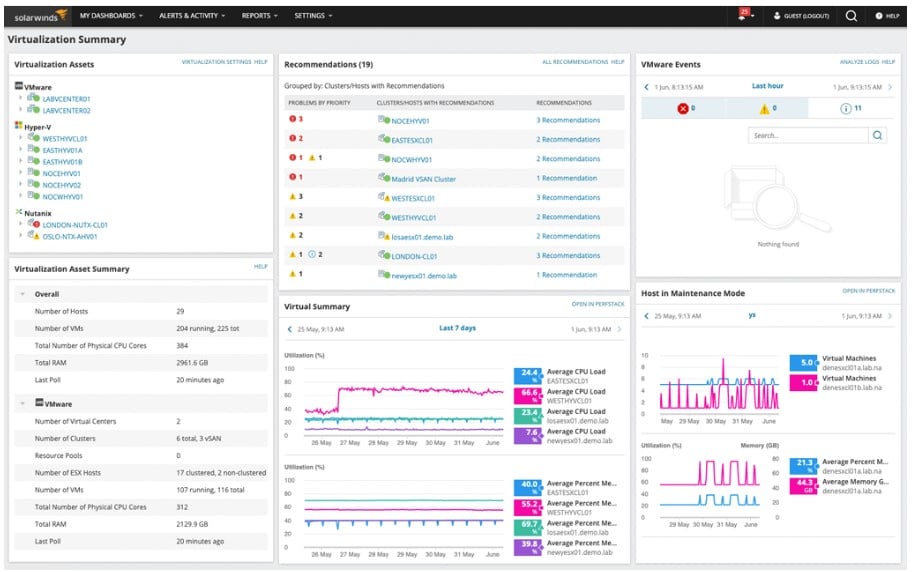
SolarWinds Hybrid Cloud Observability is a package of monitoring systems that discovers, maps, logs, and tracks IT assets and their usage. The system is designed to work with on-site assets and cloud platforms, including AWS, Azure, and Google Cloud Platform.
The service is able to link together applications, services, and resources to identify a dependency map. It also offers network mapping and a path map on demand that shows the journey of data between two given points.
Key Features:
- Deploys on-site over Windows Server or on a private cloud on AWS, Azure, and GCP platforms.
- Connects activity on all of the platforms that you run
- Shows a chain of services that contribute to the delivery of an application to users and monitors the difference in performance with respect to user experience
- Identifies if some applications are performing badly or if an application is performing well in some locations but badly in others.
- Monitors the performance of network and internet connections that carry data between applications and services.
- AI-based performance assessment that reduces overactive alerting
- Immediate root cause analysis on the identification of a problem
Feature distinction
A highlight of SolarWinds is its automated correlation of data across domains and their in-depth visualizations. This information offers the control we need to stay on top of our systems.
Why do we recommend it?
SolarWinds Hybrid Cloud Observability offers a holistic view of IT infrastructure, integrating on-site assets and cloud platforms like AWS, Azure, and GCP. Its ability to map dependencies, track application delivery, and offer AI-based performance assessment makes it a crucial tool for modern IT environments.

Who is it recommended for?
This tool is ideal for IT professionals managing complex, hybrid infrastructures, needing to monitor performance across multiple platforms and swiftly identify and resolve issues.
Pros:
- Excellent management console and ease of use
- Leverages AI to improve the accuracy of alerts
- Displays both live and historic metrics
- Features dependency mapping
Cons:
- Would like to see a longer trial period
You can assess SolarWinds Hybrid Cloud Observability with a 30-day free trial.
Conclusion
With this, we conclude our detailed review of the Top 9 Best Google Cloud Monitoring tools. These modern, intuitive tools can really help developers boost their productivity. They can shift their attention to building powerful software, while the Google Cloud monitoring tool takes care of the monitoring, visualization, and troubleshooting of GCP performance issues.
Now that you have an overview of the best cloud monitoring tools, you can get started with analyzing the performance and health of your GCP infrastructure.
Google Cloud Monitoring Tools FAQs
What is Google Cloud Monitoring?
Google Cloud Monitoring is a service provided by Google Cloud Platform that allows users to monitor the performance, uptime, and health of their applications and infrastructure running on Google Cloud.
What types of metrics can be monitored with Google Cloud Monitoring?
Google Cloud Monitoring can monitor a variety of metrics including resource utilization, network traffic, disk usage, application performance, and availability.
How does Google Cloud Monitoring collect data?
Google Cloud Monitoring collects data through various methods including agents, third-party integrations, and Google Cloud APIs. Users can also create custom metrics to collect specific data points.
Can I set up alerts with Google Cloud Monitoring?
Yes, users can set up alerts to notify them when specific conditions are met such as CPU utilization exceeding a certain threshold or a particular error occurring a certain number of times.
Can Google Cloud Monitoring be used with non-Google Cloud resources?
Yes, Google Cloud Monitoring can be used to monitor non-Google Cloud resources by using third-party integrations or by creating custom metrics.
Can Google Cloud Monitoring be used with other Google Cloud services?
Yes, Google Cloud Monitoring integrates with other Google Cloud services such as Google Kubernetes Engine, Google Compute Engine, and Google Cloud Functions.


