
There are many programming languages, and Python ranks among one of the most popular choices today because of its simplified syntax. There is a lot of emphasis on the natural language and this is why python codes are written and understood more easily when compared to codes written in other programming languages.
The popularity of Python among developers has led to the creation of many applications that run on this programming language. In fact, it is touted to be highly conducive for web and game development, AI, machine learning, training courses, and more.
Here’s our list of the Best Python Monitoring Tools:
- Site24x7 – FREE TRIAL Cloud-based monitoring tool that can stay on top of the health and performance of websites, servers, applications, and more. It is also designed to monitor Python-based applications and generate reports accordingly. Get a 30-day free trial.
- ManageEngine Applications Manager – FREE TRIAL Provides visibility into the performance of all your applications and their components. It also ensures an excellent user experience and the option to automate your IT and DevOps processes. Start a 30-day free trial.
- Paessler PRTG – FREE TRIAL A sensor-based monitoring system that can be used to monitor a wide range of systems, applications, and infrastructure including Python-based applications. Specifically, the sensor used for monitoring Python applications is the Python Script Advanced Sensor which comes as a part of the PRTG API. Start a 30-day free trial.
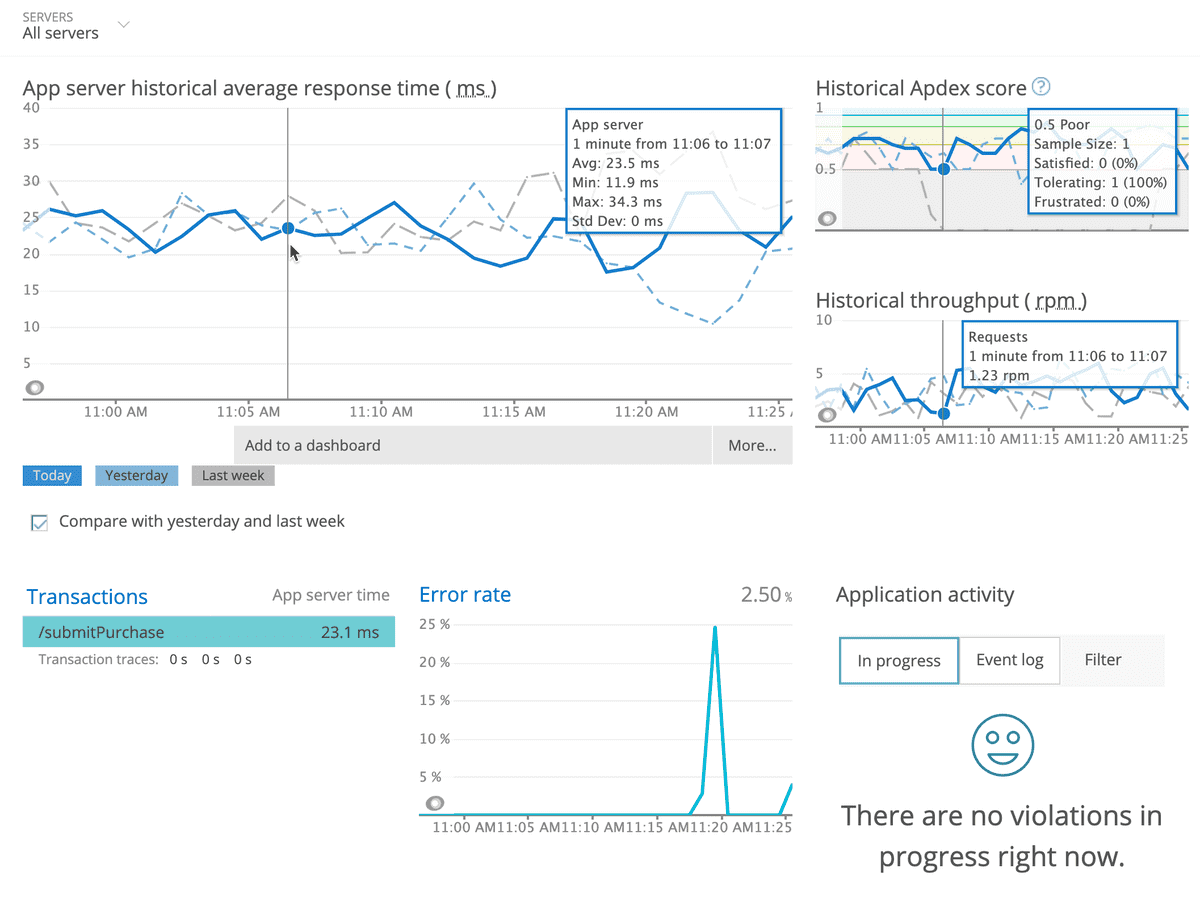
- Datadog Python Performance Monitoring and Analytics Based on the Datadog APM, it monitors application data and analyzes stack traces. Based on the monitoring results, it also generates detailed reports that come in handy for various business functions and decisions.
- New Relic One An advanced tool that helps engineers and analysts to get more out of their software, hardware, and their IT infrastructure as a whole. It supports detailed analysis, troubleshooting, and optimization to improve the overall health of your network.
- Dynatrace Helps to discover and solve performance issues in your Python code and applications.
- Solarwinds Python Monitoring Tool A powerful monitoring tool that provides a unified application and infrastructure monitoring including your Python code and applications. It can also monitor all Python services and tools to give you in-depth visibility.
Since there are so many applications that run on Python, you also need monitoring tools that are designed to specifically monitor these applications and give you valuable information to:
- Understand the normal and abnormal behavior of the python applications
- Send notifications when performance metrics go below or above the established thresholds
- Implement capacity planning
- Understand the software and hardware changes and their impact on your application
Our methodology for selecting Python Monitoring Tool:
We've broken down our analysis for you based on these key criteria:
- Comprehensive visibility into Python application health and performance.
- Automation capabilities for monitoring critical applications.
- Scalability to grow with business needs.
- Advanced features like service mapping, bug and inefficiency identification, and root cause analysis.
- Capability to monitor across different infrastructures, including cloud services.
Let's take a detailed look into what each of these tools offers to help you make an informed decision.
The Best Python Monitoring Tools
1. Site24x7 – FREE TRIAL
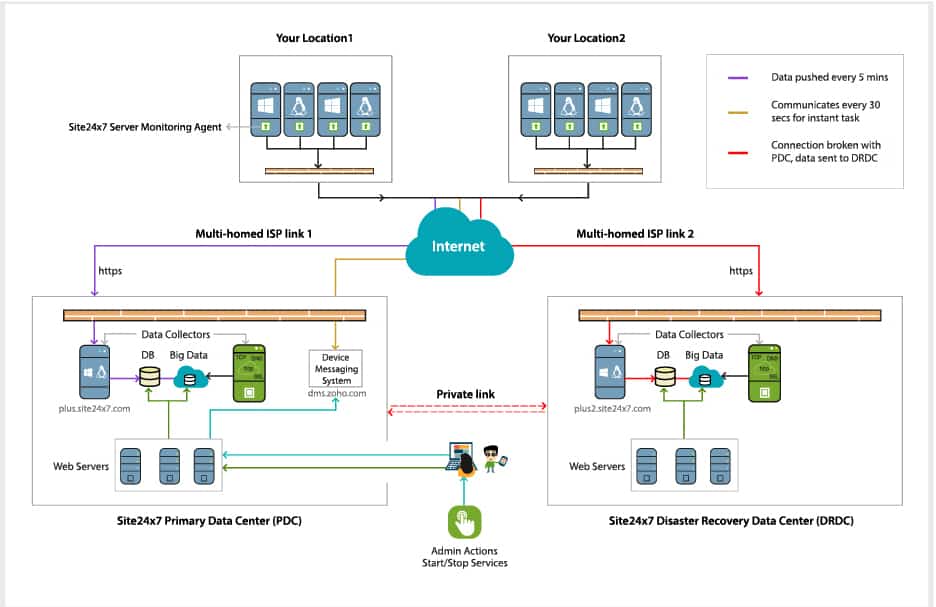
Site24x7 is a cloud-based monitoring tool that can stay on top of the health and performance of websites, servers, applications, and more. It is also designed to monitor Python-based applications and generate reports accordingly.
Key Features:
- Monitors the speed, availability, FTPs, REST APIs, SSL/TLS certificates, web transactions, end-user experience, SOAP web services, ping servers, and more of your website applications
- Provides insights across 110+ global monitoring locations
- Ensures that DevOps and SysAdmins have complete visibility into critical performance metrics
- Sends alerts across multiple channels (based on your configuration) when values go beyond a threshold
- Gives developers a complete view of all the necessary parameters to ensure optimal performance
- Tracks the behavior of users in real-time
- Supports applications built across different environments such as AWS, Azure, Java, .NET, and more
- Comes with root cause analysis capabilities to help stay on top of outages
- Monitors on-prem and cloud-based servers and applications
- Provides comprehensive insights across different cloud service providers
- Monitors data centers that are powered with virtualization and Hyper-converged infrastructure
- Centralizes log management to connect the dots and identify potential problems
- Aggregates data from hundreds of devices and environments run a search analysis on them and provides meaningful insights
- Monitors critical network devices and provides the visibility needed to manage large and complex networks

Why do we recommend Site24x7?
Site24x7 offers comprehensive monitoring for Python-based applications, ensuring optimal performance and availability. It excels in monitoring speed, availability, and a wide range of web transactions, with insights from over 110 global locations. The tool is designed for DevOps and SysAdmins, providing them with visibility into critical performance metrics. Its alert system, root cause analysis, and support for diverse environments enhance its utility.
Who is it recommended for?
Site24x7 is suitable for businesses that require monitoring of Python applications along with their entire website and server infrastructure. It is particularly beneficial for those who need detailed insights and monitoring capabilities across different cloud service providers and environments.
Pros:
- Highly scalable SaaS product
- Platform makes it easy to transition into other areas of monitoring such as network, application, or real user monitoring
- Simple and easy-to-use interface
- Supports a free version, great for home labs and testing
Cons:
- The Site24x7 is highly detailed, and may take time to full explore all options and features
There are five pricing tiers and they are:
- Starter pack for website monitoring – $9/month. Supports a maximum of 10 websites and up to 500 MB logs
- Infrastructure PRO – $35/month. 40 websites and premium support
- Classic – $89.month. 100 websites and 250 voice credits per month
- Enterprise – Starts at $225/month.
You can start the 30-day free trial.
2. ManageEngine Applications Manager – FREE TRIAL
ManageEngine Applications Manager is a comprehensive tool that provides visibility into the performance of all your applications and their components. It also ensures an excellent user experience and the option to automate your IT and DevOps processes.
Key Features
- Monitors end-user experience across different geographical sites
- Simulates business-critical process workflows o help you optimize them better
- Provides detailed visibility into your public, private, and hybrid cloud environments
- Monitors workloads of platforms such as AWS, Azure, OpenStack, and more.
- Troubleshoots application performance
- Stays on top of outages and pinpoints performance issues
- Monitors and troubleshoots diverse business environments including VMs, web servers, applications, etc
- Quickly identifies and solves database issues that impact application performance
- Comes with root cause analysis capabilities to point your efforts in the appropriate direction
- Optimizes the performance of Kubernetes, Docker, and RedHat OpenShift applications
- Improves the availability of ERP solutions such as SAP, Oracle, and Microsoft Dynamics
- Uses real-time monitoring to mitigate possible risks
- Continuously monitors the performance of your website and Internet services
- Automatically discovers applications and maps them in real-time
- Tracks incidents on ServiceNow and Slack
- Comes with 500+ built-in reports to analyze the performance of applications
- Tracks many intangible metrics such as user experience and customer journey
- Reduces the Mean Time To Repair (MTTR)
- Enhances collaboration among teams
- Verifies of code changes have an impact on the performance of applications

Why do we recommend ManageEngine Applications Manager?
ManageEngine Applications Manager is recommended for its comprehensive visibility into the performance of applications and their components. It simulates business workflows, monitors cloud environments, and troubleshoots performance issues effectively. The tool's root cause analysis capabilities and its ability to optimize Kubernetes, Docker, and ERP solutions make it a versatile choice for diverse business environments.
Who is it recommended for?
This tool is ideal for IT and DevOps teams needing to monitor a wide range of applications, including VMs, web servers, and databases. Its ability to track incidents on platforms like ServiceNow and Slack, along with its extensive reporting features, makes it suitable for medium to large enterprises.
Pros:
- Offers on-premise and cloud deployment options, giving companies more choices for install
- Can highlight interdependencies between applications to map out how performance issues can impact businesses operations
- Offers log monitoring to track metrics like memory usage, disk IO, and cache status, providing a holistic view into your database health
- Can automatically detect databases, server hardware, and devices in real-time
Cons:
- Can take time to fully explore all features and options available
Applications Manager comes in two editions – Professional and Enterprise. The Professional edition is ideal for small and medium enterprises that want to monitor up to 500 applications while the Enterprise edition is ideal for large enterprises as it can scale up to 10,000 applications, Click here to get a custom quote or Click here to start a free trial.
3. Paessler PRTG – FREE TRIAL

Paessler PRTG is a sensor-based monitoring system that can be used to monitor a wide range of systems, applications, and infrastructure including Python-based applications. Specifically, the sensor used for monitoring Python applications is the Python Script Advanced Sensor which comes as a part of the PRTG API.
Key Features
- Sends alerts through more than 10 channels including email, text, alarm, audio, HTTP requests, and more
- Comes with a full-featured web interface built on AJAX standards, thereby making it secure and high-performing
- You can schedule alerts to meet your preferences or use the PRTG API to write custom notifications
- Has apps for iOS and Android
- Supports failover tolerant monitoring to reduce downtime
- It has multiple points of monitoring to make it easy to compare values across different nodes or locations
- Comes with real-time maps containing live status information
- Its map designer tool allows you to create custom dashboards that meet your requirements
- Supports distributed monitoring to help you monitor several networks within your company
- Provides in-depth reporting
- You can export your historical monitoring data to different formats
- Paessler makes it easy to create reports on-demand or schedule their creation at regular intervals

Why do we recommend Paessler PRTG?
Paessler PRTG is recommended for its sensor-based system that effectively monitors a wide range of systems, applications, and infrastructure. The Python Script Advanced Sensor is particularly useful for monitoring Python applications. Its alert system, real-time maps, and distributed monitoring capabilities, along with in-depth reporting, make it a comprehensive monitoring solution.
Who is it recommended for?
Paessler PRTG is suitable for businesses of all sizes that need a flexible monitoring solution for their network, applications, and infrastructure. Its sensor-based approach is beneficial for those who require tailored monitoring for specific aspects of their IT environment.
Pros:
- Drag and drop editor makes it easy to build custom views and reports
- Supports a wide range of alert mediums such as SMS, email, and third-party integrations into platforms like Slack
- Supports a freeware version
Cons:
- Is a very comprehensive platform with many features and moving parts that require time to learn
Since PRTG is a sensor-based tool, your cost depends on the number of sensors you use. For example, if you use a sensor for monitoring CPU usage and one for memory, that counts as two sensors. If you use both these sensors on 10 devices, that counts as 20 sensors.
There are also many pricing bundles to choose from and they are:
- PRTG 500 – $1750 for 500 sensors
- PRTG 1000 – $3200 for 1000 sensors
- PRTG 2500 – $6500 for 2500 sensors
- PRTG 5000 – $11,500 for 5000 sensors
- PRTG XL1 – $15,500 for unlimited sensors
- PRTG Enterprise – Custom quote for 20,000+ sensors across multiple server installations
Click here for a 30-day free trial.
4. Datadog Python Performance Monitoring and Analytics
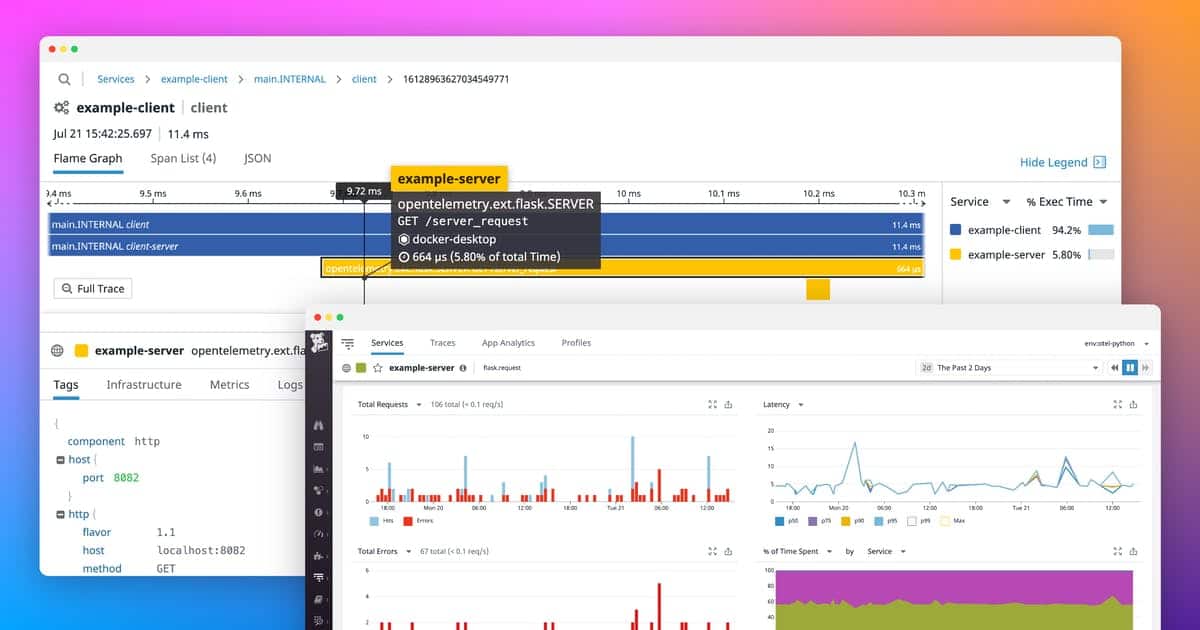
Datadog's python performance monitoring and analytics tool is based on the Datadog APM using which monitors application data and analyzes stack traces. Based on the monitoring results, it also generates detailed reports that come in handy for various business functions and decisions.
Key Features
- Monitors the performance of Python applications to ensure that the service level agreements are met
- Automatically identifies python application dependencies
- Troubleshoots issues at the application, endpoint, and customer levels
- Searches through the Python stack traces to highlight errors
- Automatically relates Python-based data from logs and traces to provide detailed root-cause analysis
- Continuously monitors applications and identifies possible errors and vulnerabilities so they can be addressed at the earliest
- Comes with built-in support for Python frameworks such as Django and Flask
- Troubleshoots the Python queries that have a negative impact on databases like MongoDB
- Monitors more than 400 integrations with Python applications
- Tracks Python data from auto-scaling infrastructure
- Monitors the Python applications across all environments
- Analyzes Python logs across all services
- Requires no manual setup or configuration
- Comes with pre-built reports that can be used for various business purposes like compliance
- Makes it easy to search and filter through tons of data
- Maps Python applications and their underlying architecture in real-time

Why do we recommend Datadog Python Performance Monitoring and Analytics?
Datadog's tool is recommended for its performance monitoring capabilities, particularly for Python applications. It excels in identifying application dependencies, troubleshooting issues, and providing detailed root-cause analysis. The integration with frameworks like Django and Flask, along with its ability to monitor over 400 integrations, makes it a comprehensive tool for Python developers.
Who is it recommended for?
Datadog is ideal for organizations that require continuous monitoring of Python applications across various environments. It is particularly useful for those who need advanced analytics and automated error detection capabilities.
Pros:
- Lightweight cloud-based tool
- AI-powered alerts help cut down on false alarms and alert fatigue
- Live reports make it easy to see high-level metrics and drill down quickly
- 450+ integrations to fit nearly any network environment
- Scalable pricing based on how much data is processed
Cons:
- Other event managers offer longer 30-day trial periods
There are three plans – Free, Pro, and Enterprise.
- The free plan (100% FREE) – Supports up to five hosts and retains metrics for one day.
- Pro ($15 per host per month) – Comes with 400+ integrations, out-of-the-box dashboards, and reports, and retains metrics for 15 months.
- Enterprise ($23 per host per month) – Machine learning-based alerts, premium support, and advanced features.
Click here to start the free trial.
5. NewRelic One
NewRelic One is an advanced tool that helps engineers and analysts to get more out of their software, hardware, and their IT infrastructure as a whole. It supports detailed analysis, troubleshooting, and optimization to improve the overall health of your network.
Key Features
- Comes with 300+ integrations to store all your data and logs in one place
- Ensures that queries are implemented quickly
- Has Grafana dashboards for an intuitive user experience
- Sends alerts in real-time
- Allows you to build custom apps
- Helps to optimize your software stack
- Monitors distributed services, applications, and serverless functions at all times
- Gives a comprehensive idea of what's going on with all applications
- Provides complete visibility into user experiences as well
- Proactively detects and explains anomalies
- Reduces false alerts and prioritizes issues that matter the most
- Diagnoses issues and helps you to respond faster to tickets
- Integrates well with many tools and open standards

Why do we recommend NewRelic One?
NewRelic One is recommended for its extensive integration capabilities and real-time alerting system. It provides comprehensive visibility into user experiences and application performance, with a focus on optimizing software stacks. The tool's ability to diagnose issues quickly and its AIOps capabilities make it a strong contender for improving network health.
Who is it recommended for?
NewRelic One is suitable for engineers and analysts looking to optimize their software, hardware, and IT infrastructure. It is ideal for high-traffic websites and services that require detailed analysis, troubleshooting, and optimization tools.
Pros:
- Focused on providing AIOps for websites and mobile apps
- Can identify and alert to SSL, JavaScript, load times, and browser issues
- Ideal for high-traffic websites and services – great for getting better uptime
- Offers a completely free tier
Cons:
- Available only as a cloud service
NewRelic One offers three plans and they are:
- Telemetry Data Platform – Collects, analyzes, and alerts on all your metrics. It is free up to 100 GB/month and costs $0.25 per GB beyond the free limit
- Full Stack Observability – Provides complete visibility and comes in Standard, Pro, and Enterprise editions
- Applied Intelligence – Reduces alert noise and helps to respond faster to incidents. The first 1,000 incident events free per month and $0.50 per incident beyond it.
Click here to get started.
Related Post: New Relic Alternatives
6. Dynatrace
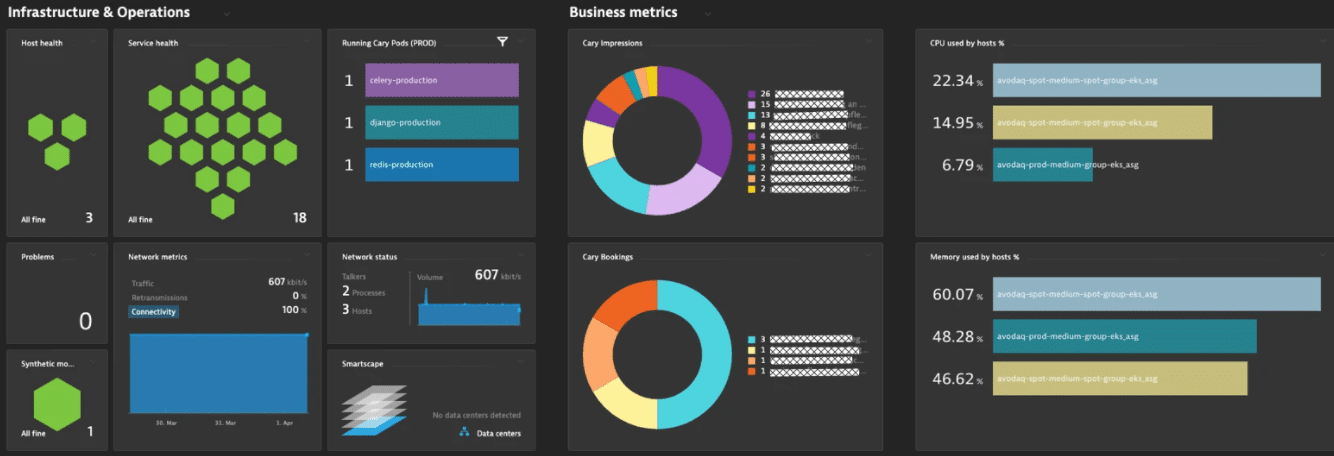
Dynatrace's Python monitoring tool helps to discover and solve performance issues in your Python code and applications.
Key Features
- Provides a detailed view into the health and performance of your applications and servers
- Identifies dependencies in your code
- Gives real-time snapshots of which hosts are running Python processes
- Automatically keeps track of the change in the environment, so you can focus on building and not monitoring
- Monitors Python applications and services at the process level
- Provides information on which processes are making calls and which processes are being called by other processes
- Focuses on process-specific context for the smooth running of your environment
- Explores connected services in-depth
- The reports and dashboards give just the information you want
- Enables you to drill down into detailed metrics just when you need them
- Provides an in-depth view of your environment's performance from your customers' perspective
- Offers web monitoring for all web applications
- Easy to set up and use
- Comes with out-of-the-box reports that can be used for internal and external compliance

Why do we recommend Dynatrace?
Dynatrace is recommended for its detailed insights into application and server health and performance. It effectively identifies dependencies and provides real-time snapshots of Python processes. Its focus on process-specific context and in-depth view of customer experience performance makes it a valuable tool for large network environments.
Who is it recommended for?
Dynatrace is particularly suited for large organizations that need a highly visual and customizable monitoring solution. It is beneficial for those who require AI-driven baseline analysis and anomaly detection in user behavior.
Pros:
- Highly visual and customizable dashboards, excellent for enterprise NOCs
- Operates in the cloud, allowing it to be platform-independent
- Leverages AI to provide baseline analysis and detect user behavior anomalies
Cons:
- Designed specifically for large networks, smaller organizations may find the product overwhelming
Dynatrace comes in six flavors and they are:
- Full-stack monitoring – $69/month for an 8GB host. Full-stack observability for apps, microservices, and infrastructure
- Infrastructure monitoring – $21/month for an 8GB host. Observability for cloud platforms, containers, and data center technologies
- Digital experience monitoring – $11/month for 10k Digital Experience Monitoring Units. Optimize user experiences across mobile, web, hybrid, and IoT applications
- Application security – $10/month for a 8GB host. Runtime application vulnerability detection, optimized for the cloud and Kubernetes
- Open ingestion – $25/month for 10k Davis Data Units. Extend observability with log monitoring, custom metrics and events, FaaS traces
- Cloud automation – Custom pricing. Full life-cycle observability enabling intelligent, risk-free & faster delivery
Click here to start your 15-day free trial.
7. Solarwinds Python Monitoring Tool
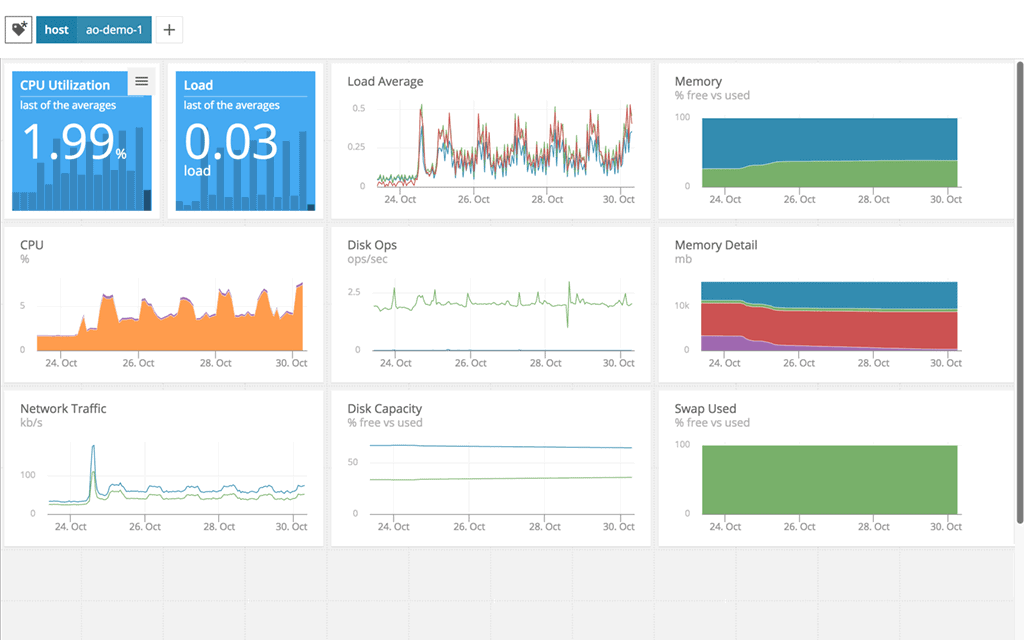
Solarwinds Python Monitoring Tool is part of Solarwinds Observability SaaS. It is a powerful monitoring tool that provides a unified application and infrastructure monitoring including your Python code and applications. It can also monitor all Python services and tools to give you in-depth visibility.
Key Features
- Provides complete visibility into the health and performance of all Python applications
- Automates the monitoring of business-critical applications
- Sends early warning notifications to minimize downtime
- Scales well with your business
- Creates a service map to explain the impact of dependencies on end-user performance
- Identifies bugs and inefficient codes
- Pinpoints the root cause of the problem
- Monitors systems and applications across different infrastructure
- Its intuitive dashboard helps to compare applications and infrastructure metrics
- Monitors AWS and Azure services
- Comes with color-coded heatmaps to give a visualization of key performance metrics
- Integrates with 150+ plugins
- Brings together log and trace data across applications
- Sends notifications through many communication channels such as Slack and PagerDuty
- Reduces MTTR
- Allows you to add custom metrics where needed
- Comes with out-of-the-box dashboards to maximize performance

Why do we recommend Solarwinds Python Monitoring Tool?
Solarwinds Python Monitoring Tool is recommended for its comprehensive and unified application and infrastructure monitoring capabilities. It offers full visibility into the health and performance of Python applications, automates monitoring of critical applications, and provides early warning notifications. Its ability to create service maps and identify bugs and inefficient codes makes it a valuable tool for optimizing end-user performance.
Who is it recommended for?
This tool is ideal for developers and system administrators who work with Python applications and require a robust monitoring solution. It is particularly suitable for businesses that need to monitor systems and applications across different infrastructures, including cloud services like AWS and Azure.
Pros:
- Offers great visualizations reflecting live and historical health metrics and resource consumption
- Is easily scalable, built as a cloud service
- Tracks all major resources such as CPU, memory, and network usage
- Can monitor Docker, Azure, and Hyper-V platforms, offering more flexibility than competing options
Cons:
- Would like to see a longer trial period
It starts at $27.50 per service/month. Click here for a free trial.
Conclusion
To conclude, Python applications are popular and widespread because the Python programming language is natural and easy to use. Since these applications are so popular, they also require continuous monitoring to ensure that they are at optimal performance.
The above tools discussed in this article can monitor Python applications and can even suggest code optimizations when needed. These tools analyze the performance of applications, servers, and the environment as a whole to give you a holistic understanding of the performance metrics and the measures you can proactively take to improve the performance of your applications.
Related Post: Best IPAM Tools for IP Address Tracking Management


