
As the cloud era evolves rapidly, various tools to host applications continue to expand at a faster pace. Serverless computing is one of the popular methods used to host applications and that has resulted in the need to use “serverless monitoring” tools.
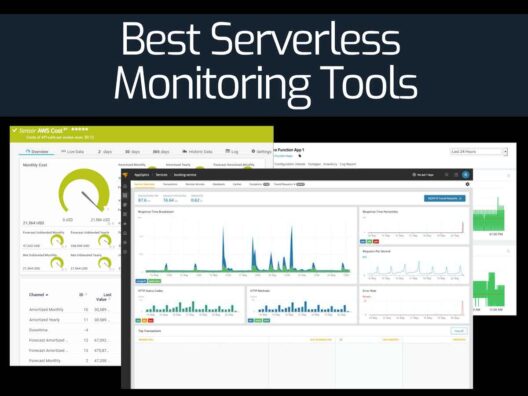
Here’s our list of the best serverless monitoring tools:
- ManageEngine Applications Manager – FREE TRIAL This tool is able to track the software in your system, the services that support them, and the platforms that host them, including serverless hosting packages. Available for Windows Server, Linux, AWS, and Azure. Get a 30-day free trial.
- Site24x7 – FREE TRIAL One of the best, top-rated serverless monitoring tools featuring pre-determined scenario types. Get a 30-day free trial.
- Paessler PRTG – FREE TRIAL A tool able to monitor your entire IT infrastructure to reduce related risks involved in your serverless infrastructure.
- ManageEngine OpManager Nexus – FREE TRIAL Cloud observability tool that correlates metrics and logs across your multi-cloud and hybrid infrastructure to identify and resolve performance issues quickly. Start a 30-day free trial.
- Datadog A popular serverless monitoring platform that offers end-to-end serverless monitoring service to identify and fix performance issues in your serverless applications.
- SolarWinds Observability SaaS A tool that speeds up the process of detecting and resolving the root cause of application performance errors and provides full-stack visibility into your KPIs.
- Dashbird An extremely simple user interface with a powerful alerting system and a live tailing feature to provide instant live updates.
- IOpipe Οffers a thorough performance analysis of your serverless infrastructure and its granular behavior.
- SenseDeep Οne of the top-rated, intuitive serverless monitoring tools for AWS.
- New Relic Α modern, faster AWS observability tool used to monitor and troubleshoot Lambda.
- AWS CloudWatch Αn observability and monitoring service developed to monitor your serverless applications, optimize resource utilization, respond to performance changes faster and get a unified view into the status of serverless functions.
Most companies find it challenging to switch to the serverless infrastructure due to the lack of observability it provides. In this post, we are going to look at the best serverless monitoring tools you can use to get insights and deeper visibility into your serverless infrastructure.
Why do we need “Serverless monitoring”?
Before we state the need for serverless monitoring, let us first learn what is serverless computing.
Serverless computing is an application hosting model that is fully managed by cloud providers, viz. the cloud providers will patch, scale and secure the servers rather than you. Now, serverless applications are quite difficult to monitor due to the configuration expenses of analytics solutions. Besides, there are many cloud instances to monitor at the same time.
Serverless monitoring helps your systems provide data, which you can use to understand what’s really happening with your functions. With serverless monitoring tools, organizations are able to monitor latency, costs, resource usage, invocation errors, cold starts and many other key metrics.
A good serverless monitoring tool will detect application errors in real-time, thereby directing them towards the right channel for resolution. Monitoring your serverless infrastructure is a bit challenging, as these Functions-as-a-Service environments have a restricted proprietary nature.
We recommend these top 11 best serverless monitoring tools.
Our methodology for selecting the best serverless monitoring tool:
Get rank the serverless monitoring tools we test based on the following criteria:
- Prioritize tools with comprehensive performance tracking.
- Look for capabilities to monitor across various platforms.
- Assess tools for scalability to adapt to growing business needs.
- Consider the depth of insights provided into application performance.
- Value the ability to quickly identify and resolve performance issues.
The Best Serverless Monitoring Tools
1. ManageEngine Applications Manager – FREE TRIAL
The performance of microservices and the severless systems that host them are closely connected and ManageEngine Applications Manager monitors them both. This system discovers all of your applications and the components that contribute to them. It then identifies the platforms that host them and tracks the performance of those as well. As applications interact with other applications and those applications in turn draw on services and servers, the application dependency map that this system creates becomes complicated.
Key Features
- Models complex relationships between applications, services, and servers
- Identifies host resource availability to meet upcoming application requirements
- Records invocations and cold starts
- Alerts for excessive errors
- Concurrent limits alerts
- Monitors memory management
- Alerts by SMS, email, Slack, and Service Desk system

Why do we recommend it?
ManageEngine Applications Manager is recommended for its adeptness in modeling complex relationships between applications, services, and servers. Its predictive capacity forecasts and application dependency mapping make it a powerful tool.
The Applications Manager isn’t limited to supervising microservices and serverless systems. It will track all of your software running on Windows Server, Linux, AWS, Azure, Google Cloud Platform, and Oracle Cloud Infrastructure.
This tool is also available to monitor systems on multiple sites in one console. The service also has a Free edition. The software for Applications Manager will run on Windows Server, Linux, AWS, and Azure.
Who is it recommended for?
It is particularly suited for organizations managing a mix of microservices and serverless systems, needing detailed performance tracking across multiple platforms including AWS, Azure, and Google Cloud.
Pros:
- Predictive capacity forecasts alert to imminent resource shortages
- Excessive usage of microservices can be identified
- Identifies over-provision of cloud services
- Capacity planning support
Cons:
- Not a SaaS package
Access a 30-day free trial.
2. Site24x7 – FREE TRIAL
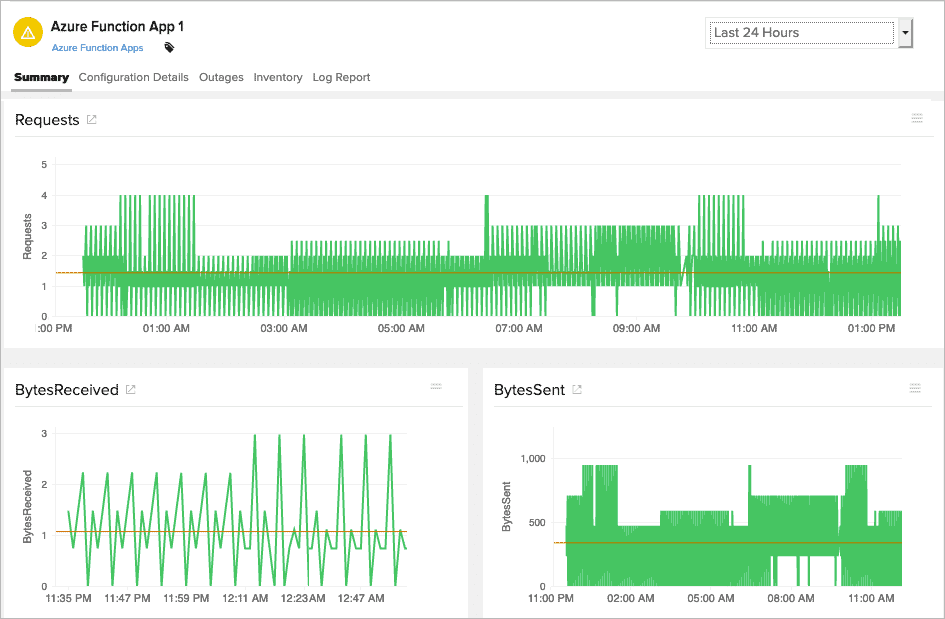
Site24x7 is one of the best, top-rated serverless monitoring tools featuring pre-determined scenario types. Your team managers can select their ideal scenario type to design or monitor custom events. It provides excellent accessibility as it is available to use as a user-friendly mobile application.
Key Features
- Monitor critical metrics of your serverless infrastructure including internal errors, invocations, activity, code execution time, throttles, and memory to make sure the app development process remains seamless.
- Get real-time status and performance information of your function apps via a central dashboard with a responsive widget
- Features one-click integration
- End-to-end visibility into function applications
- Auto-discovery
- Provides real-time alerts to reduce error resolution time
- Has a well-optimized mobile application for convenient use

Why do we recommend it?
Site24x7 stands out for its flexibility in cloud-based monitoring and comprehensive visibility into serverless functions. Its AI-enhanced root cause analysis is a key feature for quick troubleshooting.
The only downside is that Site24x7 comes with a limited set of pre-defined plugins, and building plugins from scratch through the platform is quite a tedious task.
Site24x7 provides real-time complete visibility into the performance of your serverless platforms such as AWS Lambda, Azure Functions, and Google Cloud Functions.
Who is it recommended for?
This tool is ideal for teams seeking a user-friendly mobile application for monitoring serverless infrastructures, especially in AWS Lambda, Azure Functions, and Google Cloud Functions.
Pros:
- Flexible cloud-based monitoring option
- Offers a host of out-of-box monitoring options and dashboard templates
- Allows administrators to view dependencies within the application stack, good for building SLAs and optimizing uptime
- Offers root cause analysis enhanced by AI to fix technical issues faster
Cons:
- Site24x7 is a feature-rich platform with options that extended beyond databases management, may require time to learn all options and features
You can start the 30-day free trial.
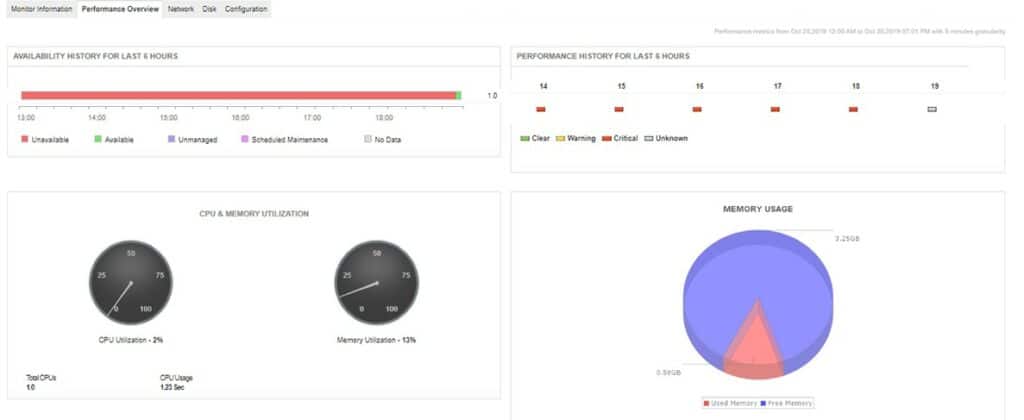
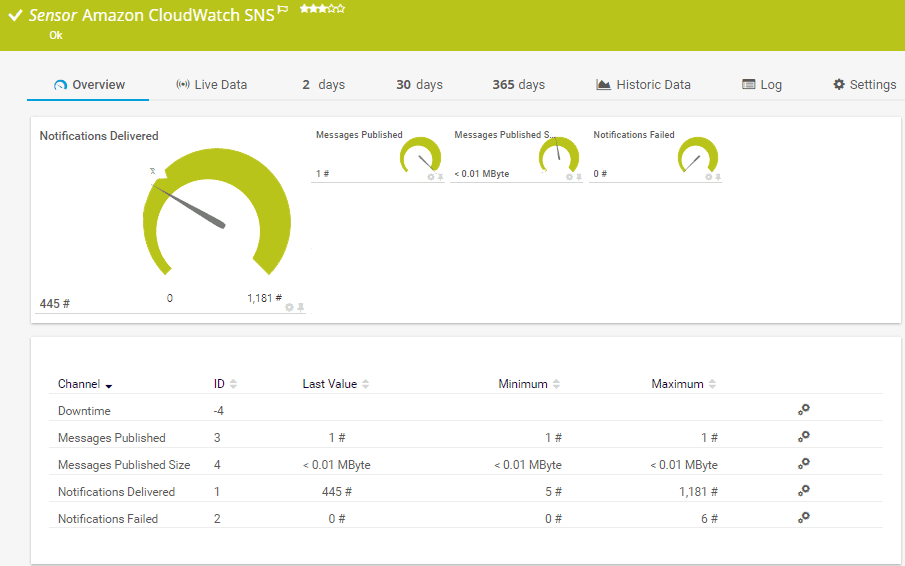
3. Paessler PRTG – FREE TRIAL
Paessler PRTG serverless monitoring tool is able to monitor your entire IT infrastructure to reduce related risks involved in your serverless infrastructure. Therefore, it also helps you reduce MTTR. The monitoring tools help you resolve issues quickly, allowing you to bypass bottlenecks quickly.
Key Features
- Collect performance metrics of functions to aid your decision-making process
- With CloudWatch Sensor, you can monitor critical system settings without worrying about which OS is running
- No need to open any port when sending queries or retrieving data. Thus, it provides enhanced security. It also promptly notifies about capacity shortages or errors
- With precise tracking, you can automatically detect any fluctuations in the capacity of services
- Helps free up resources and use them for other beneficial processes
- Boost response time of applications with flexible scaling
- Correlate metrics with other monitoring data to find resolutions faster
- Automated real-time alerts
- One centralized dashboard provides a unified overview of serverless infrastructure
Why do we recommend it?
Paessler PRTG excels in monitoring a wide IT infrastructure range, offering significant versatility. Its combination of packet sniffing, WMI, and SNMP for network performance reporting is particularly noteworthy.

Who is it recommended for?
It is recommended for large organizations needing a comprehensive tool to monitor diverse serverless environments and IT infrastructures, including those with complex networks.
Pros:
- Uses a combination of packet sniffing, WMI, and SNMP to report network performance as well as discover new devices
- Autodiscovery reflects the latest inventory changes almost instantaneously
- Drag and drop editor makes it easy to build custom views and reports
- Supports a wide range of alert mediums such as SMS, email, and third-party integration
- Supports a freeware version
Cons:
- Is a very comprehensive platform with many features and moving parts that require time
You can try Paessler PRTG free through a 30-day free trial.
4. ManageEngine OpManager Nexus – FREE TRIAL

ManageEngine OpManager Nexus, formerly OpManager Plus, unifies monitoring across 300+ cloud resources, including the leading service providers, like AWS, Azure, GCP, Oracle, Alibaba, Tencent, and more. It automatically discovers services across these providers, analyzes them, and displays the insights on a centralized console.
Key Features:
- Tracks performance metrics and resource usage directly from cloud deployments.
- Collects and correlates logs from multiple service providers and applications.
- Offers distributed tracing for end-to-end visibility.
- Detects unusual changes and unexpected configuration issues.
- Provides AI-driven event correlation to identify the root cause of problems.
- Comes with automated remediation workflows.
- Monitors more than 300 cloud resources and services.

Why do we recommend it?
OpManager Nexus is a unified platform that combines data from your cloud environments to provide an accurate picture of issues. A distinguishing aspect of this tool is its wide coverage, as it can correlate data from 300+ cloud services and providers. It can even combine data from your on-premises and hybrid environments for comprehensive visibility.
It can track a wide range of metrics, like CPU utilization, memory consumption, latency, error rates, and throughput, to provide detailed insights into your cloud operations. Also, it combines logs from multiple sources to help with RCA and compliance reporting.
Who is it recommended for?
It is recommended for organizations with large cloud operations, SaaS providers, cloud infrastructure teams, and cloud service providers.
Pros:
- Uses AI to identify anomalies.
- Offers proactive security posture management
- Comes with remediation workflows.
- Supports auto-scaling and capacity planning.
Cons:
- It can take a while to understand all the features.
OpManager Nexus costs $1,233 for 50 devices if you choose the Professional edition. On the other hand, the Enterprise edition starts at $19,995 for 1000 devices. Start a 30-day free trial.
5. Datadog
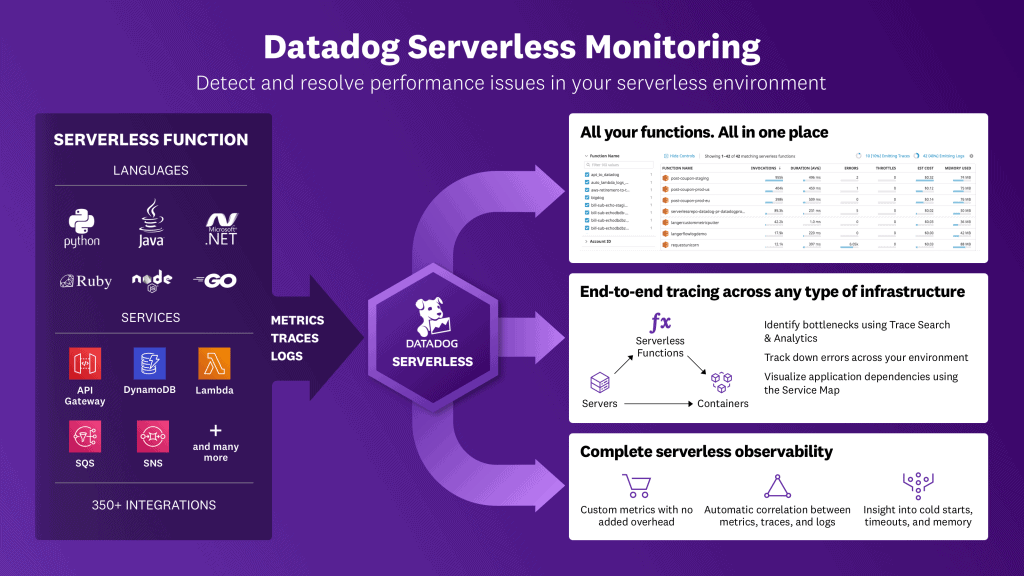
Datadog is again one of the popular serverless monitoring tools that offer end-to-end serverless monitoring service to identify and fix performance issues in your serverless applications. This in turn reduces MTTR and MTTD. Datadog monitoring tool provides deeper visibility into performance metrics; logs and traces for each invocation taking place in your serverless infrastructure, thus helping your tech team develop and deploy new code without hesitance.
Key Features
- Trace anytime, anywhere
- Correlate crucial business performance metrics
- Unified view into your serverless applications
- Deeper observability into your serverless infrastructure, be it functions, VMs or containers
- Optimize application performance by filtering functions that are creating cold starts, high latency, errors
- Real-time alerts on timeouts, memory, and concurrency metrics to prevent poor UX.
- Uses ML-based anomaly and forecasting monitors to reduce manual tasks of alerting
- Visualize, monitor, and analyze KPIs via customizable dashboards

Why do we recommend it?
Datadog is recommended for its end-to-end serverless monitoring capabilities, providing deep visibility into performance metrics, logs, and traces. Its ability to monitor both internal and external aspects of network performance is a significant advantage.
Who is it recommended for?
Datadog is well-suited for businesses requiring detailed observability of their serverless infrastructure, including functions, VMs, or containers.
Pros:
- Offers numerous real user monitors via templates and widgets
- Can monitor both internally and externally giving network admins a holistic view of network performance and accessibility
- Changes made to the network are reflected in near real-time
- Allows businesses to scale their monitoring efforts reliably through flexible pricing options
Cons:
- Would like to see a longer trial period for testing
6. SolarWinds Observability SaaS
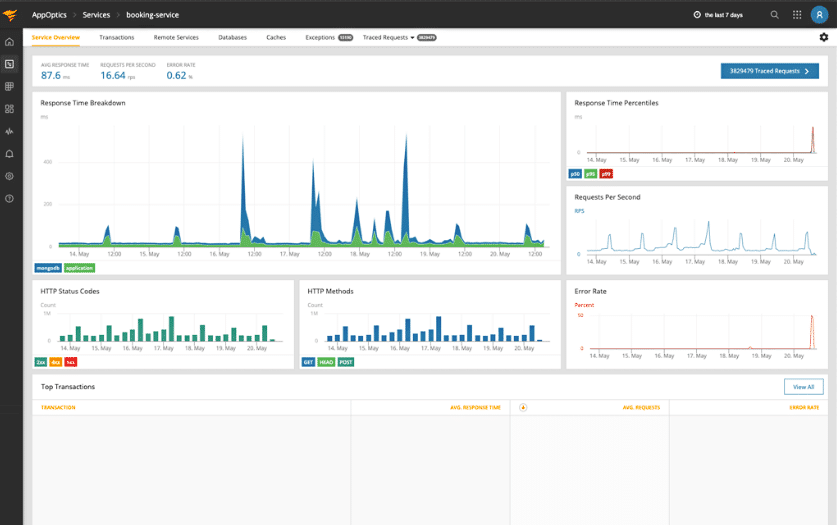
SolarWinds Observability SaaS (formerly AppOptics Applications Performance Monitoring (APM)) speeds up the process of detecting and resolving the root cause of application performance errors. The tool provides full-stack visibility into your KPIs.
Key Features
- Trace transaction outliers
- Monitor transactions and crucial APM metrics
- Identify functions that are generating bottlenecks for your applications
- Can scale with your business to provide deeper visibility into all your serverless environments
- Alerts on hotspots for quick actions
- Get down-to-the-code insights into performance bottlenecks, application performance and detect where the errors occur

Why do we recommend it?
SolarWinds Observability is recommended for its comprehensive full-stack visibility and ability to quickly identify and address application performance issues. Its effective tracking of transaction outliers and APM metrics significantly reduces downtime.
It can detect various metrics such as application errors, performance issues or resource allocations across a stack. This helps you reduce downtime and prevent poor end-user experiences.
Who is it recommended for?
This tool is ideal for businesses needing scalable solutions for monitoring serverless environments, particularly those using Docker, Azure, or Hyper-V platforms.
Pros:
- Offers great visualizations reflecting live and historical health metrics and resource consumption
- Is easily scalable cloud service
- Tracks all major resources focusing on over 180 different metrics
- Can monitor Docker, Azure, and Hyper-V platforms, offering more flexibility than competing options
Cons:
- Would like to see a longer trial period
7. Dashbird
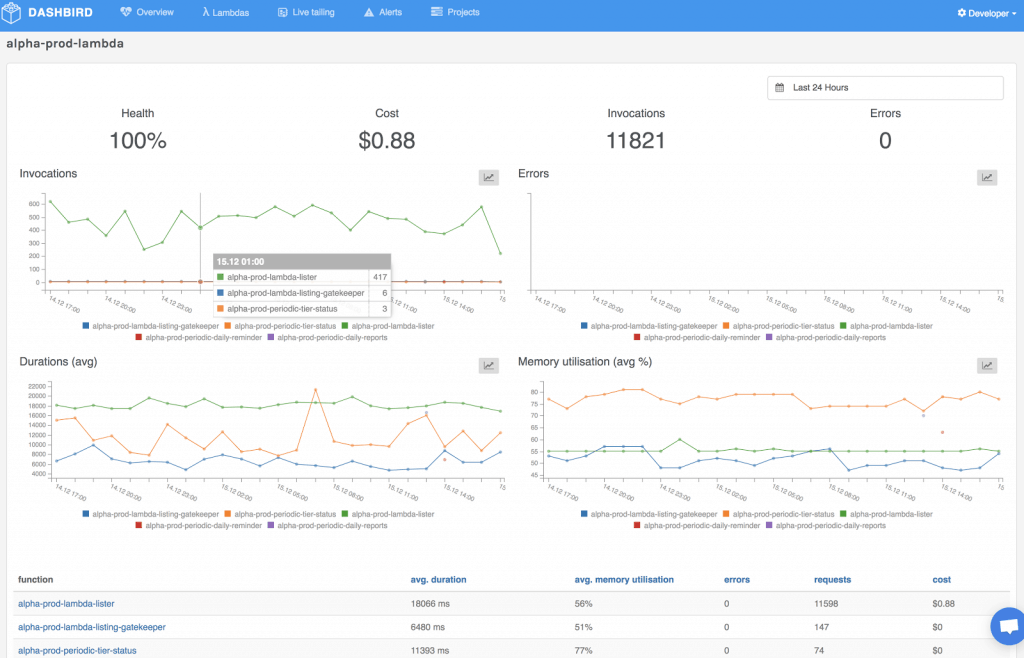
Dashbird comes with an extremely simple user interface, making its setup a breeze! Apart from this, Dashbird has a powerful alerting system and a live tailing feature to provide instant live updates. You can work with Dashbird without writing a single line of code. It gathers all the data from AWS X-Ray and CloudWatch, so your serverless applications do not have latency issues.
Key Features
- End-to-end observability into logs, metrics, and traces through a single unified dashboard
- Valuable insights with intelligent suggestions to enhance cost, security, compliance, efficiency, and posture of applications
- Features pre-built custom filters and checks, so you can trace cold starts, timeouts, errors, anomalies, and downstream service failures from logs and metrics
- With native integrations, it can monitor multiple cloud components in AWS Cloud

Why do we recommend it?
Dashbird is commended for its simplicity and powerful alerting system. Its codeless monitoring approach and end-to-end visibility across ecosystems make it a strong contender.
Who is it recommended for?
Ideal for teams seeking a straightforward interface and comprehensive integration into cloud environments, particularly in AWS Cloud.
Pros:
- Sleek and clean interface – highlights key insights well
- Supports end-to-end visibility across your entire ecosystem
- Supports codeless monitoring – great for less technical teams
- Offers a wide range of integrations into cloud environments
Cons:
- Can take time to fully explore all options
8. IOpipe
IOpipe serverless monitoring tool offers a thorough performance analysis of your serverless infrastructure and its granular behaviour. With this precise tool, you can understand what is really happening with your code as it runs, thus helping you with faster debugging and iterating. To avoid poor user experiences, IOpipe discovers errors and performance issues faster and fixes them without the need to go through log files.
Key Features
- Get real-time alerts when your functions start to misbehave
- With AWS Lambda functions profile, understand what exactly your code is doing as it runs line by line
- Trace which bottlenecks are slowing down your applications
- Clean, easy-to-use interface
- Extract real-time metrics with customizable events and customizable alerts for granular error logs
- Trace and profile function and performance cold starts
- Supports Python, Node.js, Java

Why do we recommend it?
IOpipe's granular behavior analysis and performance troubleshooting capabilities make it a valuable tool for serverless monitoring. Its support for various languages enhances its versatility.
Who is it recommended for?
Recommended for larger development teams needing detailed insights into serverless infrastructure performance, particularly those working with AWS Lambda functions.
Pros:
- Supports various languages
- Does an excellent job at streamlining and automating the bug-handling process
- Easily visualizes where bottlenecks occur
- No-frills interface gets the job done
Cons:
- Better suited for larger dev teams
9. SenseDeep
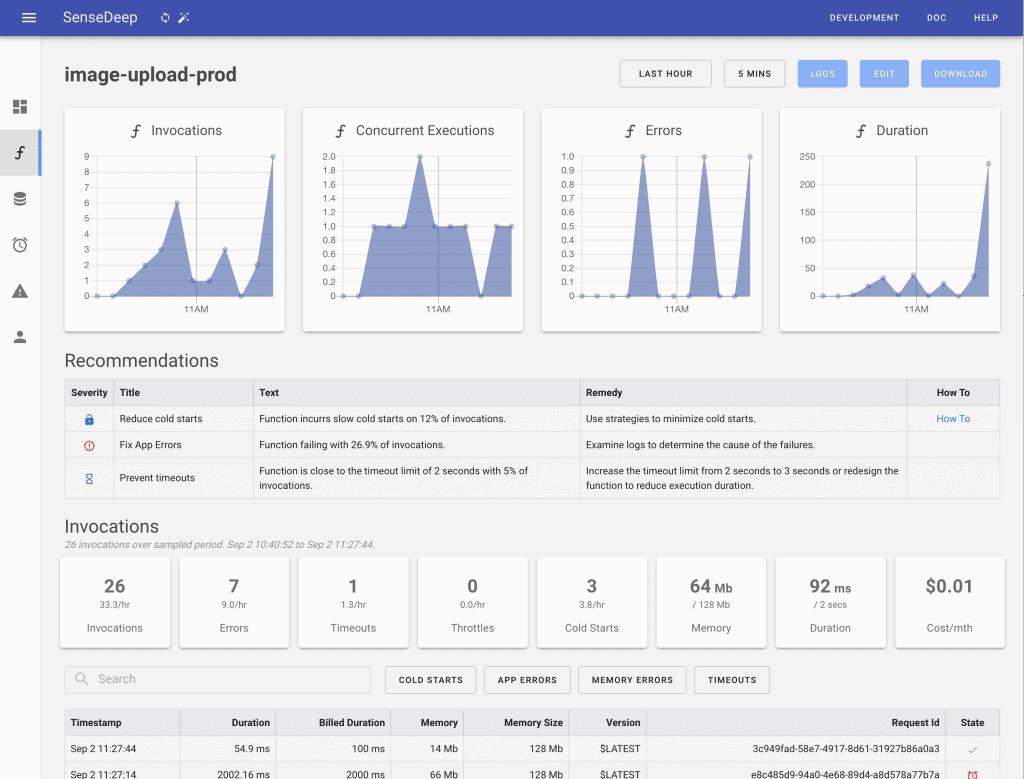
SenseDeep is one of the top-rated, intuitive serverless monitoring tools for AWS. It efficiently helps you monitor and troubleshoot your serverless infrastructure with real-time innovation traces. To reduce MTTR, it provides automated notifications and alerts for application events and performance metrics. Organizations can leverage SenseDeep to monitor and analyze all microservices including all the Lambdas and Logs. It extracts insights about metrics such as cold starts, throttle, invocations, errors and cost. You will be able to drill-down events with detailed invocation traces.
Key Features
- Automated error detection 24*7
- Automated alerts and notifications for Lambda metrics and application log events
- Provides Lambda-specific suggestions and ML-based best practices
- Faster log viewer provides real-time status and updates with live tail feature

Why do we recommend it?
SenseDeep is recommended for its focus on automating monitoring tasks and leveraging machine learning for anomaly detection. Its detailed invocation traces and real-time updates stand out.
Who is it recommended for?
Ideal for organizations looking to monitor and analyze microservices, including AWS Lambda and Logs, requiring both live and historic insights.
Pros:
- Focuses on automating repetitive monitoring tasks
- Leverages machine learning to detect anomalous activity
- Supports microservers alongside traditional applications
- Easily see both live and historic insights
Cons:
- Can take time to fully explore the platform and all of its features
10. New Relic
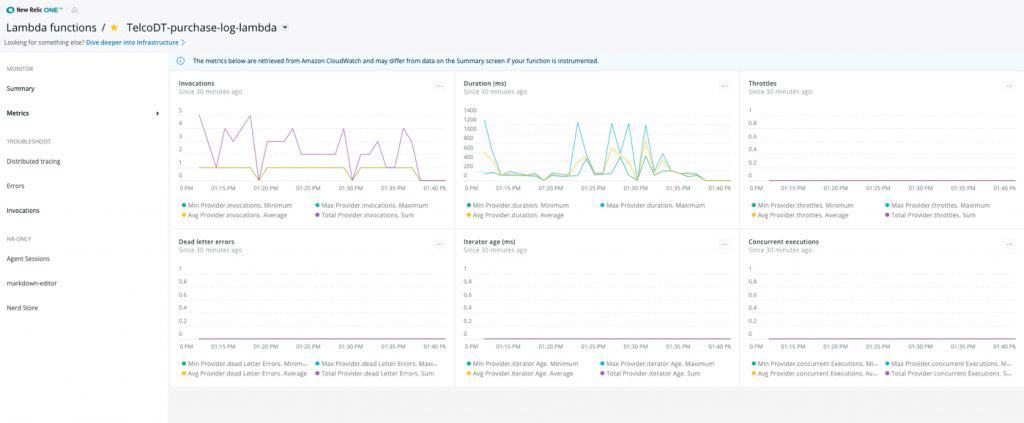
New Relic is a modern, faster AWS observability tool used to monitor and troubleshoot Lambda. It can quickly detect, monitor, visualize, troubleshoot and send alerts for all your Lambda functions. With a user-friendly UI, it can drill-down into the functions and extract Lambda-specific metrics such as error rate, throughput, invocation source data, stack traces, and so on. The New Relic Distributed Tracing feature has high cardinality; hence it can spot highly uncommon errors as well.
Key Features
- Monitors and troubleshoots all your serverless functions and microservices to provide an overview through single-pane-of-glass.
- Get real-time dynamic insights across the entire stack to keep track of the stability status, even if the applications scale rapidly.
- New Relic CLI Installer and Lambda Layer feature offer rapid auto-instrument monitoring for their serverless functions with NO need to write code
- Filter metrics based upon a complex set of attributes to extract rich, specific invocation data
- Build custom alerts based upon custom invocation criteria
- Supports Python, Java, Node and does not require AWS data access
- Global technical support and solid community
- Well-organized documentation

Why do we recommend it?
New Relic is recommended for its comprehensive AWS observability, enabling quick detection, monitoring, and troubleshooting of Lambda functions. Its high cardinality in distributed tracing is especially beneficial.
Who is it recommended for?
This tool is well-suited for small to medium-sized networks needing a user-friendly UI for in-depth Lambda function monitoring and troubleshooting.
Pros:
- Certified for Microsoft Azure monitoring
- Uses anomaly detection to highlight abnormal behavior in your environment
- Uses simple but intuitive admin dashboards
Cons:
- Better suited for small to medium-sized networks
Related Post: New Relic Alternatives
11. AWS CloudWatch
AWS CloudWatch is an observability and monitoring service developed to monitor your serverless applications, optimize resource utilization, respond to performance changes faster and get a unified view into the status of serverless functions.
Key Features
- Gather and store logs in real-time from AWS services, resources, and applications
- Collects default metrics from various AWS services without demanding any efforts
- Can collect custom metrics from your own apps to spot trends, troubleshoot problems, and monitor performance
- Gathers and aggregates container logs and metrics such as memory, CPU, disk, network information from every container to automatically build custom metrics for monitoring and alerting
- Gathers and aggregates Lambda logs and metrics
- Unified view with custom dashboards. Allows you to visualize your applications and cloud resources and create reusable graphs.
- Allows you to combine multiple alarms for an entire application to receive one alarm notification for all issues happening in an application
- Correlated metrics and logs and set alarms for operational issues
- Integrates with AWS IAM to control which resources and users can access your data. Thus, offers excellent security to users. CloudWatch Logs is FedRamp and PCI compliant to execute exceptional data encryption measures
Why do we recommend it?
AWS CloudWatch is recommended for its native integration with the AWS ecosystem, offering extensive monitoring capabilities. Its ability to provide a unified view of serverless functions is a key advantage.
It gathers monitoring data through events, metrics and logs to provide an overview of AWS services, resources, and applications running on On-Prem and AWS servers. It can detect anomalous behavior in your serverless functions, send alerts, visualize logs and extract metrics at the same time. With these metrics, you can take automated actions, explore insights to smoothly run your applications and troubleshoot errors.

Who is it recommended for?
Best suited for small to medium-sized networks operating within the AWS environment, looking for a tool that offers comprehensive monitoring and observability of their serverless applications.
Pros:
- Native to AWS ecosystem
- Supports a wide range of AWS itegrations into services like AWS IAM
- Provides a single pane to view your ecosystem
- Offers simple reporting, alerts, and data visualization
Cons:
- Better suited for small to medium-sized networks
Conclusion
Serverless architecture is a modern, effective and faster way to build applications. But, observability into the applications’ performance and operations is a bit challenging, when it comes to serverless infrastructure. This is the reason why most organizations are leveraging serverless monitoring tools to monitor and troubleshoot back-end operations of their serverless functions.
These tools are able to reap the maximum benefits out of your serverless functions.


