
Linux is one of the most used operating systems in enterprise and production networks. Today we're going to jump into the Best Linux Monitor Tools & software to ensure uptime, security and resiliency in your systems!
Network Monitoring Software, as well as the tools that support them, are an integral part of any IT infrastructure setup, especially for system admins and support staff. These technical roles require that people are constantly aware of what is happening on the network, and if there are any problems.
Here is our list of the best Linux network monitors:
- ManageEngine OpManager – FREE TRIAL This service monitors both networks and servers. The servers can be running Windows Server or Linux. Available for Windows Server and Linux.
- Site24x7 Infrastructure – FREE TRIAL A monitor for servers and services that has been extended with a network monitoring module. This is a cloud-based service.
- Zabbix A fee, open-source infrastructure management system that monitors networks server and applications. The tool will supervise servers running Windows Server and Linux. Runs on Linux, macOS, and Unix.
- Nagios Core A free open-source infrastructure monitor for networks, servers, and applications. This software installs on Linux and can monitor servers across a network, including those running Windows Server.
- Datadog Infrastructure This system monitoring platform is resident in the cloud so it isn’t reliant on a host of any particular operating system. The tool reaches out across the internet and through networks to monitor servers no matter where they are.
- OpenNMS Horizon A free open-source monitoring tool that manages network devices and network traffic. Installs on Linux.
- Zenoss Core A free systems monitoring package that can be extended by ZenPacks to monitor just about any IT resource. Installs on Linux.
- Cacti A free network monitoring system that creates live performance graphs that are built on live SNMP responses. Installs on Linux.
- nTopNG A free network monitor built on top of a packet sniffer. Available for Linux, FreeBSD, Windows, macOS, and RaspbianOS.
- SolarWinds Netflow Traffic Analyzer This tool is able to monitor traffic to and from any device, including Linux hosts. The SolarWinds software installs on Windows Server but can communicate with Linux devices over the network.
Being alerted of any sudden issues is an important aspect of Network Monitoring and Management Software solutions as well, so making sure that your application can offer you that kind of real time warning and notification is highly important.
When you factor in all of the additional complexities that the Linux operating System brings to the equation, then it soon becomes paramount for your environment to be equipped with all of these capabilities, and more. We have rounded up 18 examples of software platforms that could help to make your life much easier if you have been tasked with monitoring and maintaining a Linux equipped operational environment. We will go over some of the top features as well as look at some elements that could take your administration game to the next level.
Let’s get started!
Here's the Best Linux Monitors for Managing your Linux/Unix Systems of 2026:
Our methodology for selecting Linux network monitoring tools and software
We reviewed various Linux monitoring tools and analyzed the options based on the following criteria:
- Support for various Linux distros
- Amount of support and documentation available
- A facility to analyze Linux performance over time
- Graphical interpretation of data, such as charts and graphs
- A free trial period, a demo, or a money-back guarantee for no-risk assessment
- A good price that reflects value for money when compared to the functions offered
1. ManageEngine Opmanager – FREE TRIAL
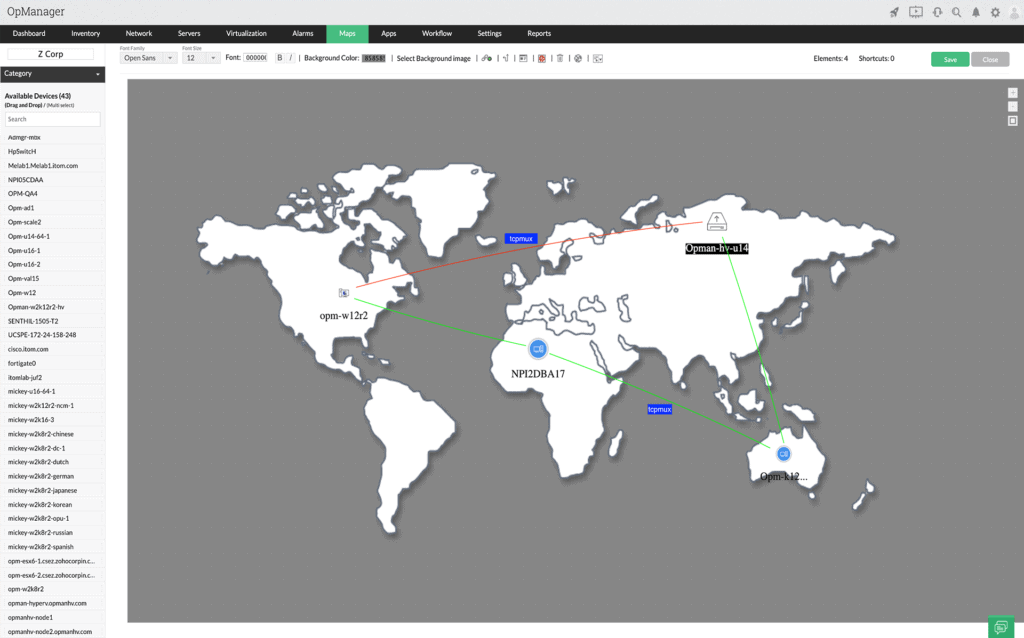
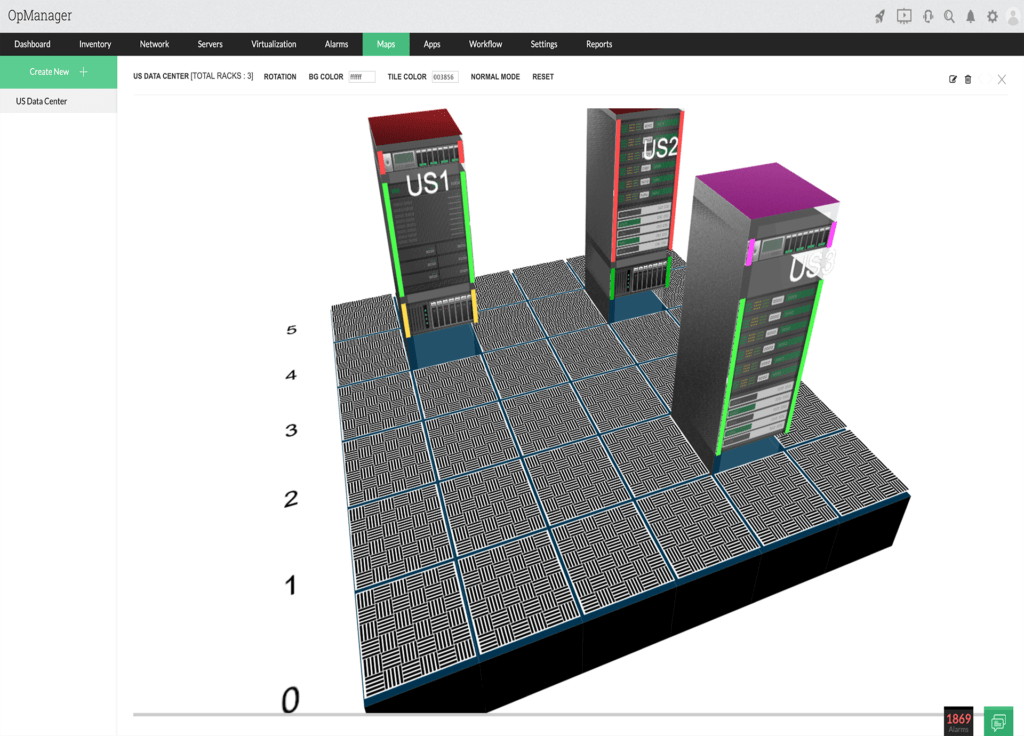
OpManager is another well known tool and software suite in the Network Monitoring realm that has extremely well-rounded functionality! They can monitor Linux & Windows Servers, as well as a Vmware, Hyper-V, Xen and Nutanix virtualization platforms quite easily! They offer a Very competitive rate in terms of price and for the functionality you get out of the software.
Key Features:
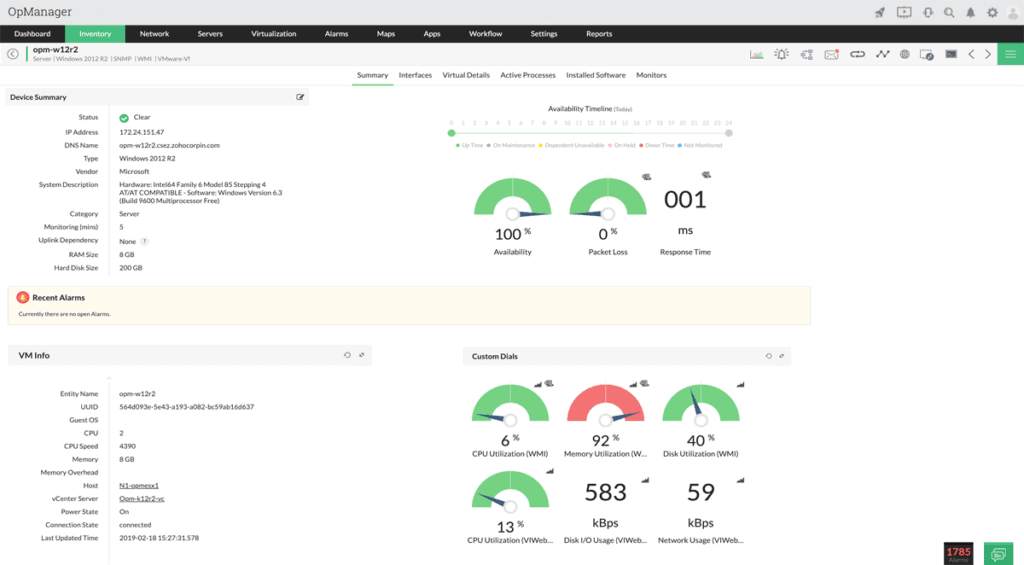
- Over 200 customizable widgets
- Intelligent alerting reduces false positives
- Supports numerous alerting channels
- Integrates well with ManageEngine products
Why do we recommend it?
ManageEngine Opmanager stands out for its highly customizable nature and intelligent alerting system, making it a versatile choice for diverse network monitoring needs.
Some features & capabilities of this software include:
- Network Performance & Bandwidth Monitoring
- Monitor Server Health and Performance
- Customizable Dashboards
- WAN and LAN Link monitoring
- Setup Alerts & Notifications
- and Much More!
Who is it recommended for?
Recommended for businesses that need a feature-rich, customizable network monitoring solution, particularly those looking to integrate with other ManageEngine products.
Pros:
- Designed to work right away, features over 200 customizable widgets to build unique dashboards and reports
- Leverages autodiscovery to find, inventory, and map new devices
- Uses intelligent alerting to reduce false positives and eliminate alert fatigue across larger networks
- Supports email, SMS, and webhook for numerous alerting channels
- Integrates well in the ManageEngine ecosystem with their other products
Cons:
- Is a feature-rich tool that will require a time investment to properly learn
Click on the Link below to Find out all the Major benefits OpManager has to offer for monitoring your Linux Server environment at a great price!
https://www.manageengine.com/network-monitoring/
![]()
2. Site24x7 Infrastructure – FREE TRIAL
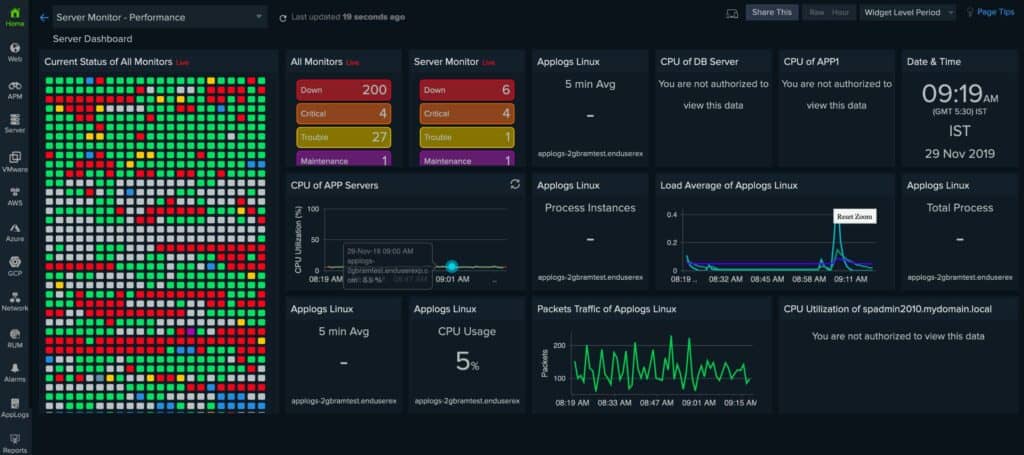
Site24x7 is a cloud-based system monitoring platform and Infrastructure is its server monitoring module. The Infrastructure system has been extended to monitor networks as well.
Key Features:
- Holistic monitoring: network, server, user
- Real-time device discovery and reporting
- User-friendly interface and features
- Freeware version for initial testing
Why do we recommend it?
Site24x7 Infrastructure is recommended for its comprehensive and user-friendly approach to monitoring, covering networks, servers, and user experience in one platform.
The server monitoring part of the system can unify the monitoring of servers in different locations and also with different operating systems. Although the processing for the monitoring service takes place in the cloud, it needs an agent program installed on enrolled servers. The agent will install on Debian, Ubuntu, CentOS, Red Hat, Madriva, Fedora, SUSE, CoreOS, Raspberry Pi, and Arch Linux ARM as well as Windows Server.
The agent program gathers statistics and uploads those to the Site24x7 server for processing. The dashboard for the monitoring service is also resident in the cloud. It can be accessed by technicians through any standard Web browser from anywhere. The console includes a number of standard server monitoring screens. These can be customized by the user through drag-and-drop widgets.
The Infrastructure module includes other functions — it has a service to monitor networks as well. The network monitor covers device health and also reports on network traffic. These two functions spot performance issues that are caused by problematic network devices. It is also able to see when network capacity is reaching its limits on different links.
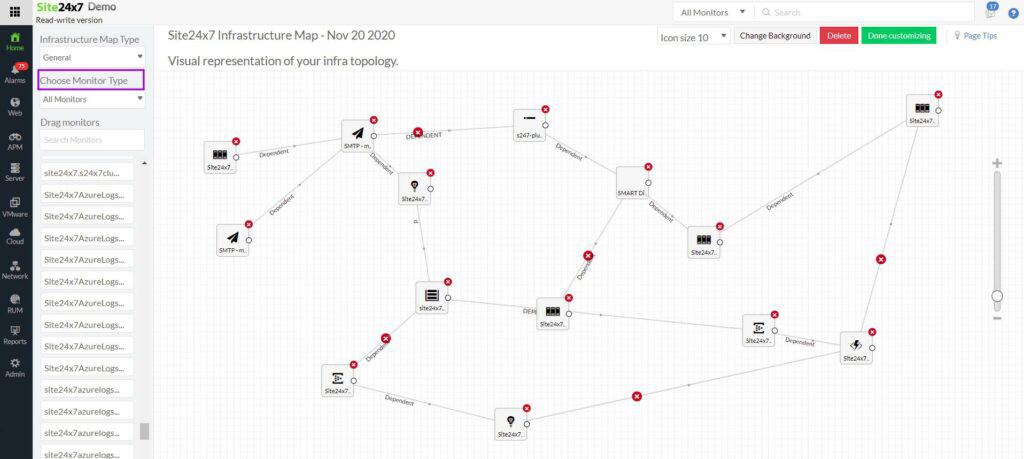
The network monitor is able to monitor switches, routers, load balancers, firewalls, VPNs, and wireless network APs. It has an autodiscovery service, which identifies all of the devices connected to the network. It will also draw up a network topology map. Both the map and the inventory get automatically updated whenever a device is added, moved, or removed.
Both the server and network monitoring tools include an alerting service. This creates performance and capacity thresholds on all of the resources that are monitored. If performance drops or capacity approaches its limit, the system generates an alert. Alerts can be forwarded to key personnel by SMS message or email.
Who is it recommended for?
Ideal for organizations looking for an all-in-one monitoring solution that bridges technical, user behavior, and business metrics insights.
Pros:
- One of the most holistic monitoring tools available, supporting networks, infrastructure, and real user monitoring in a single platform
- Uses real-time data to discover devices and build charts, network maps, and inventory reports
- Is one of the most user-friendly network monitoring tools available
- User monitoring can help bridge the gap between technical issues, user behavior, and business metrics
- Supports a freeware version for testing
Cons:
- Is a very detailed platform that will require time to fully learn all of its features and options
Both the server and network monitoring tools are included in the Site24x7 All-in-one plan, which contains all of the monitoring services of the Site24x7 platform. So, there are two options for those who want to monitor Linux servers and networks with the same tool. Site24x7 Infrastructure is available for a 30-day free trial.
Pricing:
The base package for Site24x7 Infrastructure costs $9 per month when paid annually. The Network Monitoring element includes access to five interfaces. Upgrades cost $50 per month for a system with 100 network interfaces, $75 per month for 250 network interfaces, and $200 per month to monitor 1,000 network interfaces.
You can get more information and access to a 30-day free trial.
https://www.site24x7.com/server-monitoring.html
3. Zabbix
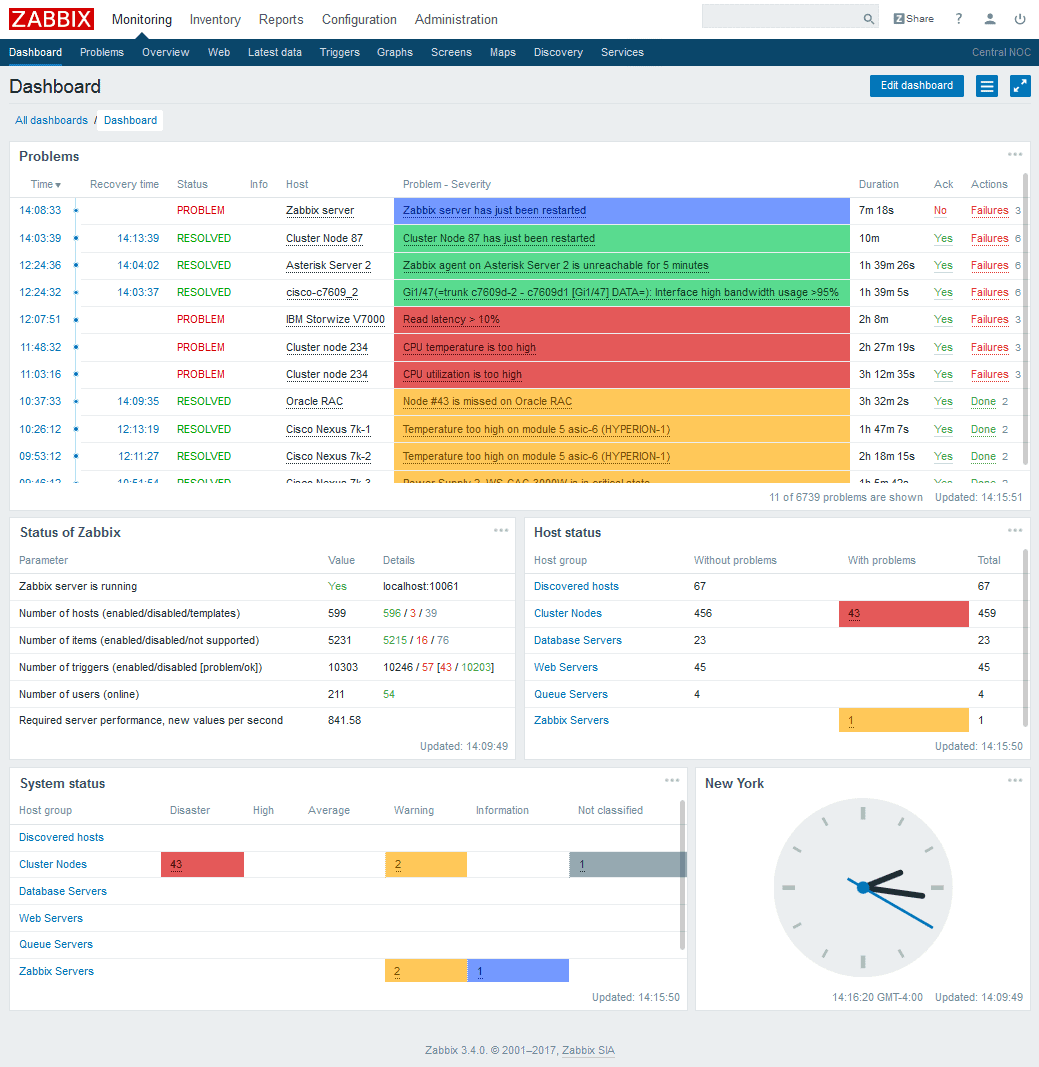
For the past 20 years, Zabbix has been providing enterprise-level, real-time monitoring that allows for millions of different metrics to be collected and monitored, from thousands of different sources, including servers, virtual machines and network peripheral devices.
Key Features:
- Open-source, transparent monitoring
- Broad monitoring range with SNMP, ICMP
- Immediate device and configuration detection
- Robust notification system variety
Why do we recommend it?
Zabbix is recommended for its versatility as an open-source tool, providing a broad range of monitoring capabilities along with an efficient notification system.
Zabbix is an open source, free to use product that makes it especially tempting for businesses to adopt, especially in these difficult economic times. Zabbix has a customizable problem detection system that lets users define what metrics need to be monitored, and at what point an alert needs to be issued.
It can detect problems states by monitoring the incoming traffic flows of the network automatically, which means that there is no need for a constant peer-to-peer connection. This is especially useful to Linux administrators that need to focus their attention on keeping systems running smoothly.
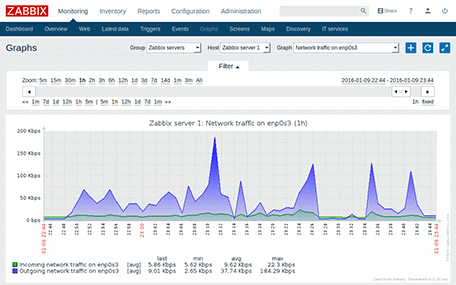
Because of the massive amounts of data that are collected continuously by the system, Zabbix can generate useful and meaningful graphs in real time, giving you amazing insight into your current environments overall traffic flows, and general health of the network.
Add to this the ability to automate network discovery, auto registration of active agents, and also integrate low-level device discovery, and you have an effective product that can do almost any monitoring that you require within your Linux environment.
Zabbix really starts to shine where scaling in required, as it can scale to thousands of data collection points. It allows you to monitor from behind a firewall, and even from the DMZ segment of your network.
Although the system runs on Linux, it allows for data and information collection from multiple different sources, including Windows severs and PCs, making it a great all-round monitoring solution.
Who is it recommended for?
Best suited for businesses seeking a flexible, open-source solution for extensive network and system monitoring, particularly in Linux environments.
Pros:
- Open-source transparent tool
- Uses both SNMP and ICMP for a broader monitoring range
- Can detect new devices and configuration changes immediately
- Offers useful templates for quick insights
- Robust notification system supports SMS, email, custom script, and webhook
Cons:
- The interface isn’t as intuitive as solutions such as DataDog or Site24x7
- Would like to see better-alerting features, specifically related to reducing false positives
A free copy can be downloaded from here.
Pricing: Zabbix is free to download, install and use.
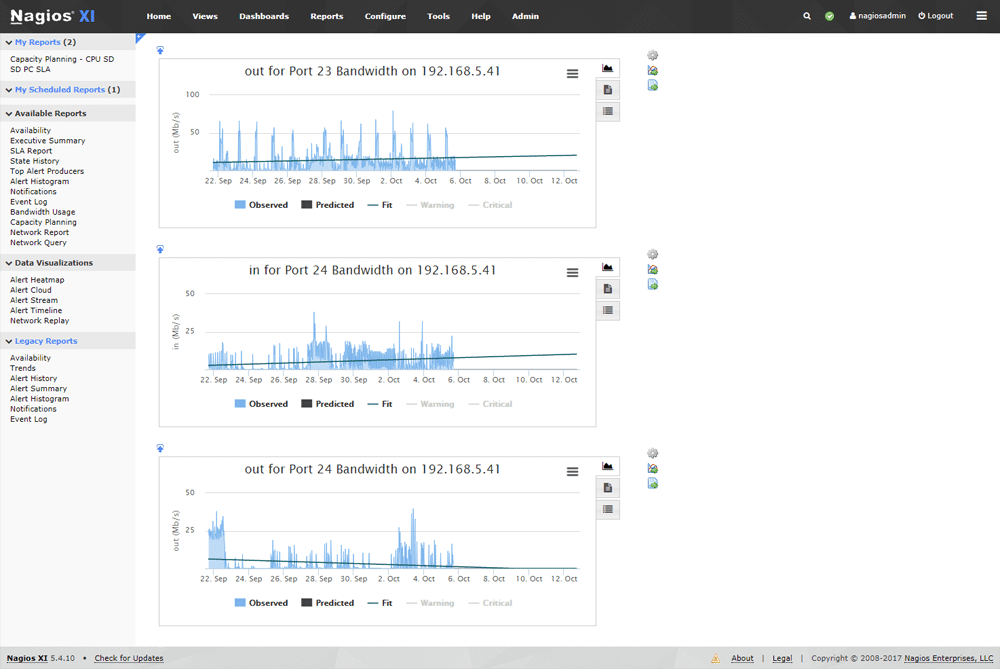
4. Nagios Core
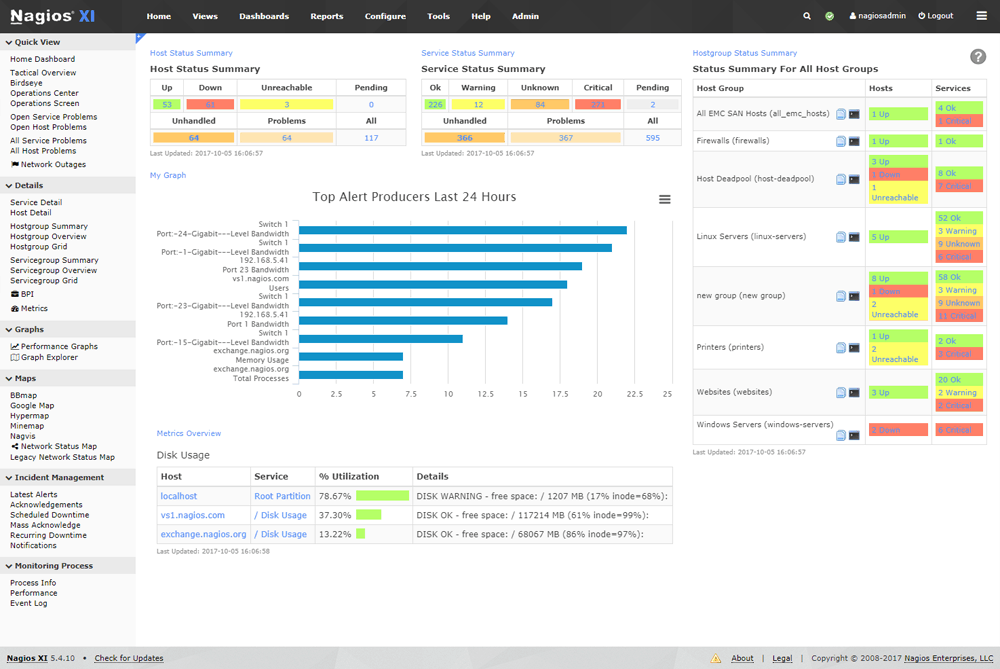
Nagios Core is a Linux and Unix monitoring system that runs natively in those environments, and is suitable for large scaled networks that require constant monitoring and data collection.
Key Features:
- Open-source, flexible tool
- Informative, simple interface
- Robust API for custom integrations
- Suitable for large-scale networks
Why do we recommend it?
Nagios Core is recommended for its open-source nature and robust API, making it highly flexible and scalable for large network environments.
Nagios core acts as a basic event scheduler, event processor and alert manager. These services are all able to monitor the specific devices that need to be monitored and can be specified from within the application itself.
Nagios Core has been designed so that it is both flexible and scalable within enterprise environments, making it capable of monitoring many different devices and device metrics simultaneously. It also provides APIs to allow for feature creation and integration with existing systems, making it even more flexible.
This has resulted in thousands of different add-ons being created by users from around the world, which all contribute to the Nagios Core Eco-system. From within the system it is therefore possible to monitor all devices that reside on your network. It is also possible to monitor the status of inter-site links across the WAN, and it also makes it easy and quick to do.
Individual ports can be monitored for application troubleshooting, and a whole range of other network data.
Nagios Core is an impressive Unix and Linux styled monitoring platform, that offers all of the enterprise functionality that your IT team will need to keep your systems running smoothly and efficiently.
Who is it recommended for?
This tool is ideal for enterprises requiring a scalable, customizable monitoring solution, especially those who wish to integrate custom applications.
Pros:
- Open-source transparent tool
- Simple, yet informative interface
- Flexible alerting options support SMS and email
- Robust API backend makes it a great option for developers who want to integrate their own custom applications
Cons:
- The open-source version lacks the quality support found in paid products
A demo of Nagios Core can be downloaded from here.
Pricing: Starts at $1,995
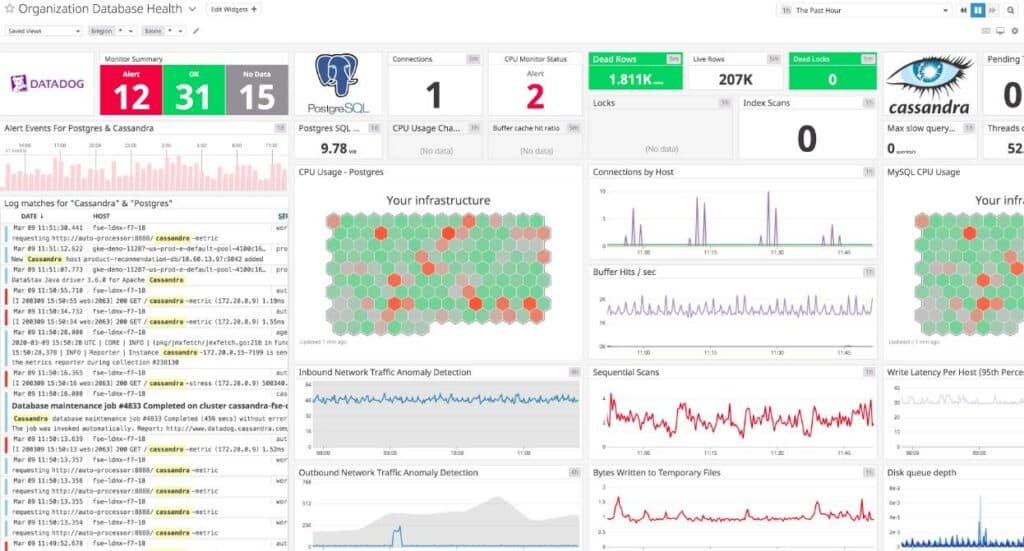
5. Datadog Infrastructure
Datadog is an infrastructure monitoring platform that is based in the cloud. It is a suite of modules, each of which monitors a different type of resource. Among the packages available from Datadog are network monitors and also server monitors. The server monitoring system offered by Datadog is called Datadog Infrastructure and it is able to monitor servers running Linux and Windows Server.
Key Features:
- Intuitive cloud-based interface
- Real-time network topology maps
- Flexible pricing for scalability
- Comprehensive Linux server monitoring
Why do we recommend it?
Datadog Infrastructure is commended for its cloud-based, intuitive interface and real-time network mapping, offering a comprehensive and scalable monitoring solution.
As this is a cloud-based system, it isn’t bound by the limits of one LAN. It can monitor servers anywhere and one Datadog Infrastructure account can group together the monitoring of many servers operating on many sites and also in the cloud. It is also possible to group the monitoring of servers running different operating systems.
The Datadog Infrastructure system displays all of the resources of all monitored servers on one page. For example, you can see all of the disk space usage of all servers. From an overview of all resource usage, you can zoom down to see all individual servers in one view, then drill through to each server and look at its statistics.
The data visualizations in the dashboard for Datadog Infrastructure make it easy to quickly understand all of the operations of all Linux servers. It is also possible to create a customized screen that collects all of the metrics that are important to you in one view.
The big advantage of Datadog Infrastructure is that, as well as showing the resource activities of your Linux servers, it will show all of the services that support your user-facing software. You can see all of the application stack that supports systems such as websites and spot where problems arise. This research capability extends down to the server’s performance.
You don’t need to sit and watch the dashboard of Datadog Infrastructure waiting for problems to arise because the service includes performance thresholds that will trigger alerts if crossed. These alerts show in the screens of the console and can also be forwarded on to key personnel by SMS, email, or collaboration system.
Datadog Infrastructure includes processing power in with the software so you don’t have to host the system on your site. Technicians access the dashboard through any standard Web browser from anywhere.
Who is it recommended for?
This tool is suitable for businesses seeking a scalable, cloud-based infrastructure monitoring platform, especially those with diverse server environments.
Pros:
- Has one of the most intuitive interfaces among other network monitoring tools
- Cloud-based SaaS product allows monitoring with no server deployments or onboarding costs
- Can monitor both internally and externally giving network admins a holistic view of network performance and accessibility
- Supports auto-discovery that builds network topology maps on the fly
- Changes made to the network are reflected in near real-time
- Allows businesses to scale their monitoring efforts reliably through flexible pricing options
Cons:
- Would like to see a longer trial period for testing
Price:
Datadog Infrastructure is offered in three editions:
- Free — Monitors up to five hosts and has a one-day data retention period.
- Pro – Has a 15-month data retention period and costs $15 per host per month.
- Enterprise – Includes AI-based performance thresholds and costs $23 per host per month.
You can access a 14-day free trial.
6. OpenNMS
OpenNMS is another open source project that is based on Unix/Linux architecture, and offers a carrier-grade platform that is designed for building highly integrated and effective network monitoring solutions.
Key Features:
- Open source with customization potential
- Stable and beta version options
- Wide monitoring range and alerts
- Extensive documentation support
Why do we recommend it?
OpenNMS is recommended for its dual offering of a stable and a beta version, catering to different needs while providing a wide range of monitoring options.
There are two distinct versions of OpenNMS, Meridian and Horizon. Meridian can be thought of as the stable release of OpenNMS, which changes very seldomly, and is advisable to enterprises that need stability and functionality.
Horizon is more of an experimental version of OpenNMS, which innovates often, and includes experimental functionality that has unknown factors that are not necessarily suitable for production environments. Whichever version of OpenNMS you decide on, there are some features that you can expect to use straight out of the box.
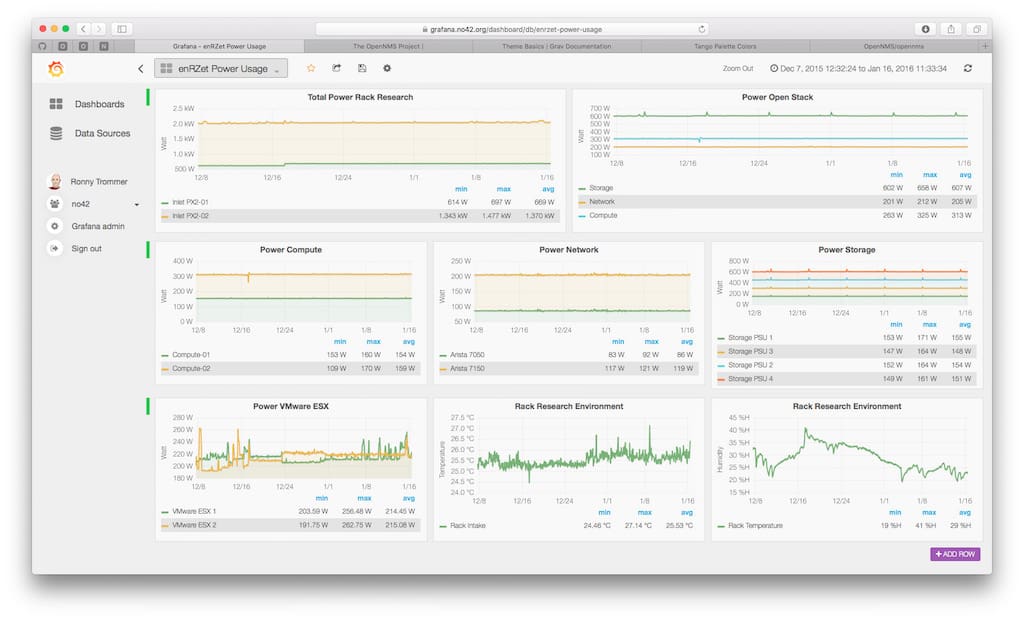
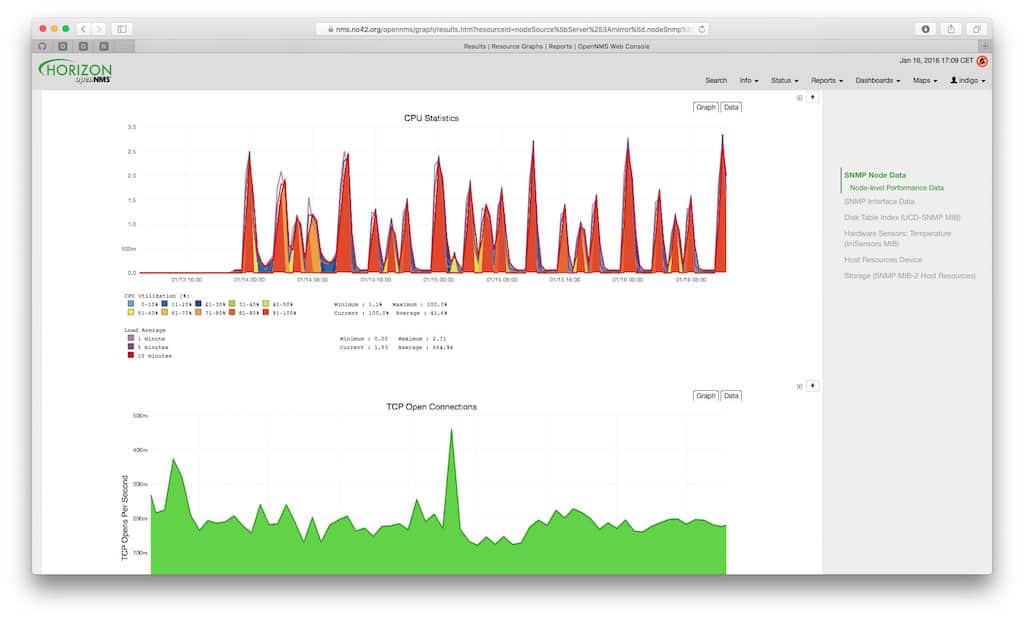
The software platform is able to detect service outages such as latency and performance graphing, as well as synthetic bench-marking for network performance analysis. There is default application template support, so you can monitor popular applications without having to do too much configuration to get your monitoring system setup.
Performance management is handled with industry standard agents such as SNMP, JMX, WMI, NRPE, NSCLient++ and XMP. These can be setup with relative ease, allowing your team to gain valuable insight into your company’s IT infrastructure.
System administrators will be pleased to know that they can monitor all device types, from Windows PCs and servers, to Linux based systems, as well as network appliances such as switches and routers. The OpenNMS system installs onto a Linux server, and runs continuously while scanning your environment for data.
OpenNMS also offers great alert and warning functionality, which notifies you about any threshold exceeding events, such as non-responsive devices or bandwidth allocation overutilization.
This means that you will never be caught completely unaware if any devices or systems fail on your network, making OpenNMS a compelling choice for IT professionals.
Who is it recommended for?
Best suited for organizations that value open-source flexibility and require a robust, customizable monitoring platform with comprehensive support documentation.
Pros:
- Open source projects, lots of room for customization, and personalized add-ons
- Has a large amount of documentation available
- Features two versions, a stable version and a beta test version for new features
- Offers a wide range of monitoring options and flexible alert notifications
Cons:
- Users rely on help documents and forums for support, which isn’t always the quickest way to resolve issues
The latest version of OpenNMS can be downloaded from here.
Pricing: Free and opensource
7. Zenoss Core
Zenoss Core is an on-premises, self-managed, community supported monitoring solution that runs on a Linux platform, and offers stability, scalability, and excellent monitoring features. It provides users with event management, basic monitoring, a unified monitoring solution, limited root-cause analysis, reports, and more.
Key Features:
- Supports Fortinet, Cisco Layer 2-4
- Automatic network discovery
- Monitors up to 500 devices
- On-premises, community-supported
Why do we recommend it?
Zenoss Core is a strong candidate for its capacity to monitor a significant number of devices and its efficient network discovery features.
The Zenoss Core product can monitor up to 500 devices, but other versions such as Zenoss On Premises, or Zenoss Cloud, can provide monitoring for 100,000 devices, and unlimited numbers for the cloud version.
Server monitoring and analytics are important for IT professionals as it provides essential insight into the current state of operation within the organization’s operational framework, and allows for quick and easy diagnostics and reporting.
This means that your team can stay on the same wave-length, and measure the same metrics. This reduces the overall complexities of the troubleshooting phase of support, and results in faster issue resolution. The kinds of events that can be monitored are almost limitless, with anything from chassis intrusion detection, to Linux and Microsoft monitoring, to hard drive and fan speeds and health.
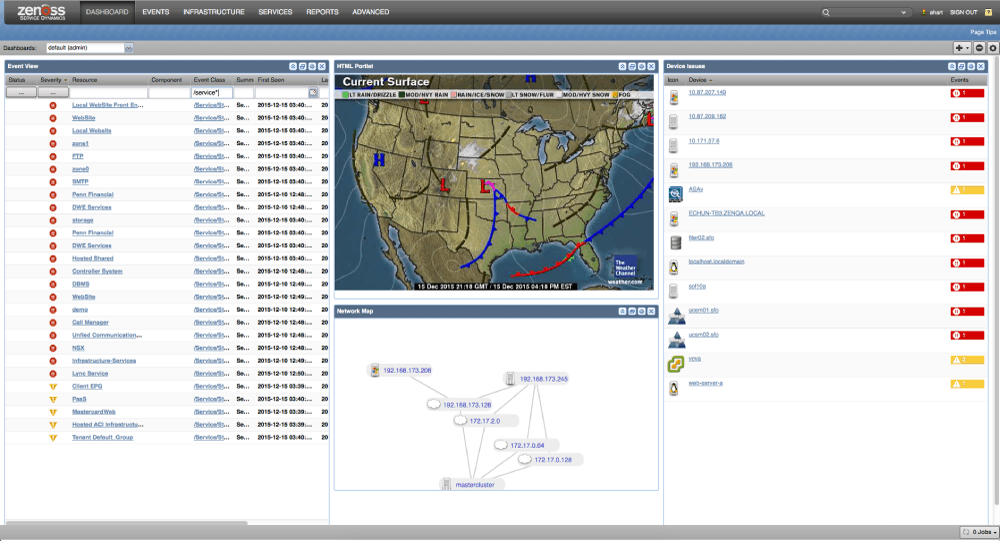
Zenoss can be as localized, or as global as you need your monitoring to be. It allows your planning team to gain valuable information about the current state of your networks, both local and wide, giving them the information that they need to plan, maintain, and support the existing infrastructure.
Local workstations and servers can be actively monitored, while switches and routers can be added to the alert and notification feature, giving your team real time feedback on issues as and when they occur.
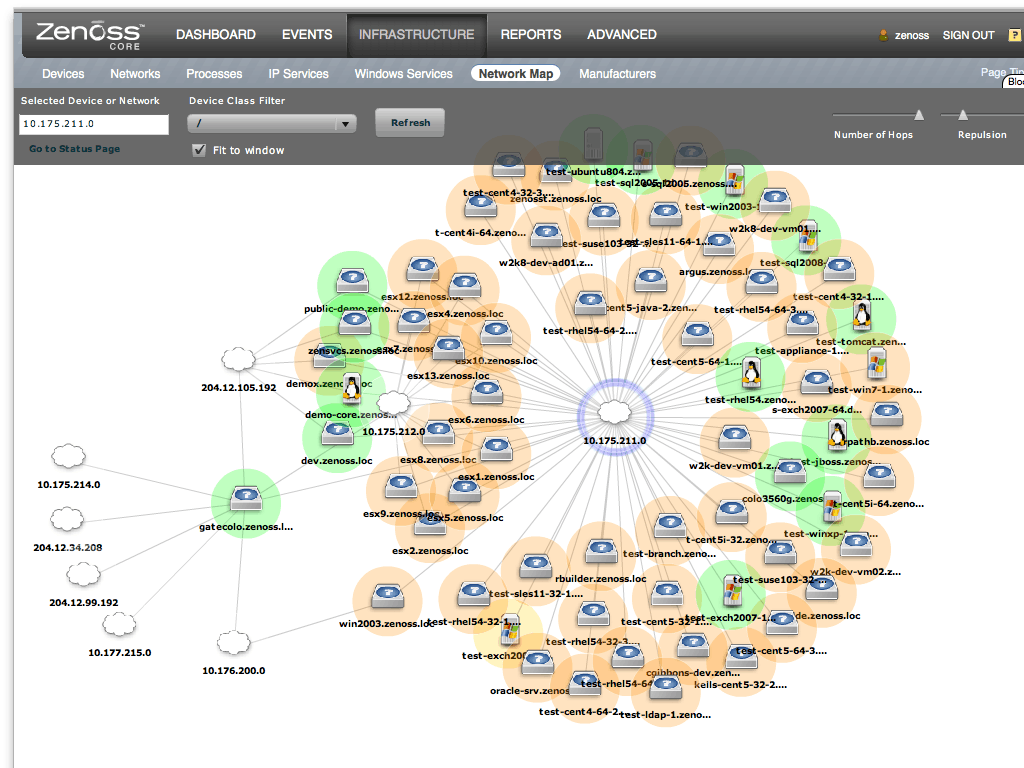
Perhaps you’d like to know how many workstations, wireless devices, or printers are attached to a certain segment of the network? Zenoss makes visualizing your network very easy by giving proper tools that trace out the network path for each class of these devices.
Data logs and system logs are all accessible from one centralized location, which gives you all of the tools that you need to investigate suspicious activity on your network, and compile a comprehensive report about any anomalies that may be occurring in your environment.
Who is it recommended for?
Ideal for mid-sized organizations looking for an on-premises, community-supported monitoring solution, especially those using Fortinet and Cisco devices.
Pros:
- Offers Fortinet monitoring through a simple plugin
- Uses network discovery to automatically pull in new devices that enter the network
- Supports Cisco Layer 2-4 devices
Cons:
- Support is only for paid tiers
Schedule a demo here.
Pricing: Pricing is available on request, and can be asked for from here.
8. Cacti
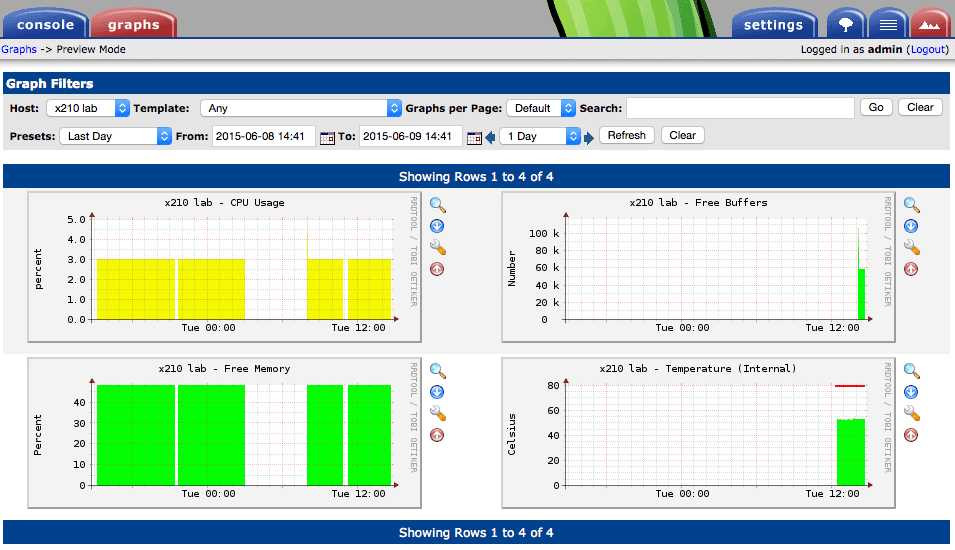
Cacti has been around for a very long time, and is a monitoring solution that many Linux admins and open-source enthusiasts will be familiar with. Cacti is a front-end tool for the legendary RRDTool, and it stores all of the needed data to create graphs and populate them via a MySQL database.
Key Features:
- Customizable data visualization
- Large, dedicated community
- Simple, user-friendly interface
- Ideal for data-focused research
Why do we recommend it?
Cacti is recommended for its strong focus on data visualization and customization, supported by a large community.
This data can then be queries via SQL commands. The Frontend relies on PHP, and can be made to create graphs, charts and data sources. In any event, Cacti handles all other data gathering. Cacti also supports SNMP so that people that are used to using MRTG.
Cacti is able to handle this massive data collection by using multiple paths, and can correlate with the data on the graph that it is creating. The graph creation is therefore unlimited, and the items that need to be tracked can be represented graphically.
Cacti can therefore be seen as more of a logging tool, but it is definitely still useful for troubleshooting. Cacti comes with several different templates that give ‘out of the box’, turnkey monitoring solutions. This also allows for specialized monitoring, although customizing these graphs can take a little bit of practice.
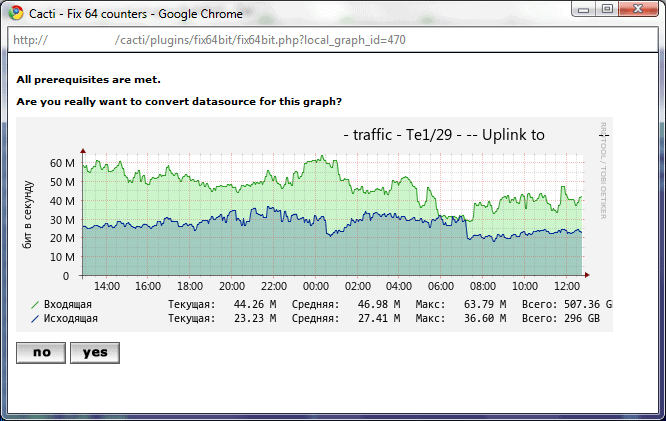
Overall, Cacti is still a valuable graphing and monitoring tool, especially down at a protocol level, where specific data is required to compile comprehensive reports. The fact that it is well supported by a large community, runs on Linux, and it is free and open source, makes it a worthy tool to look into for system admins.
Who is it recommended for?
This tool is particularly suited for researchers and administrators who need a flexible platform for detailed data collection and visualization.
Pros:
- Highly customizable monitor with a focus on data visualization
- Large dedicated community of over 20,000 members
- Simple interface
- Ideal for researchers looking for more flexibility in their data collection
Cons:
- Has a steeper learning curve than competing product
Cacti can be downloaded from here.
Price: Free and open source.
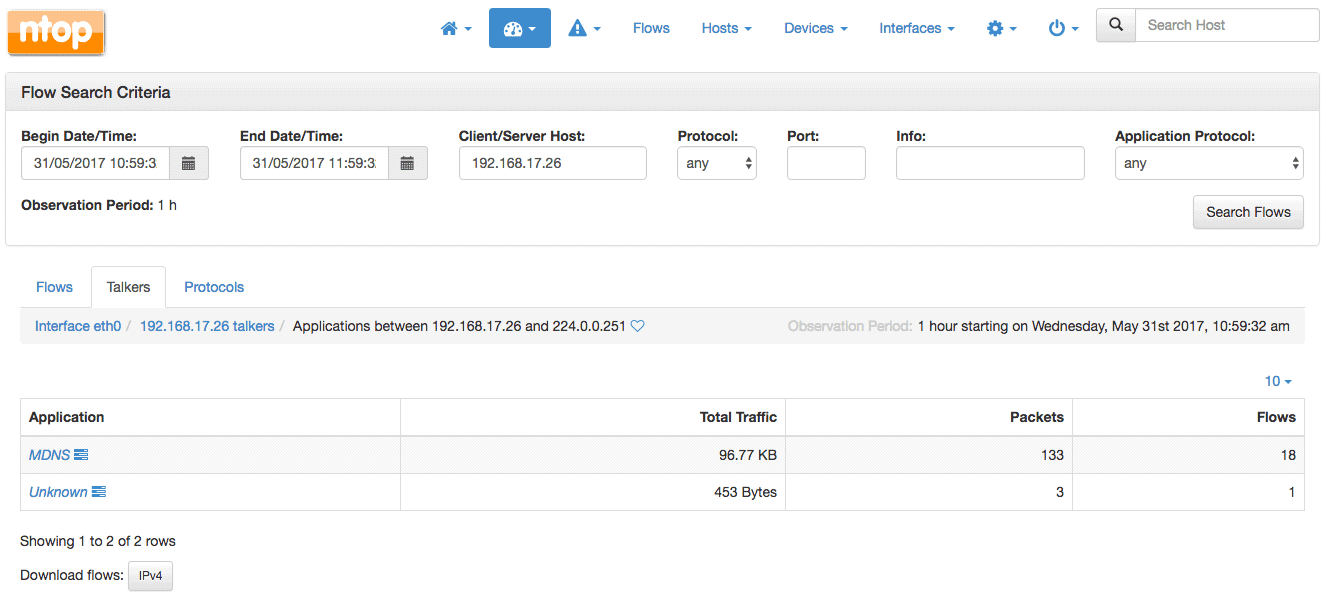
9. nTopng
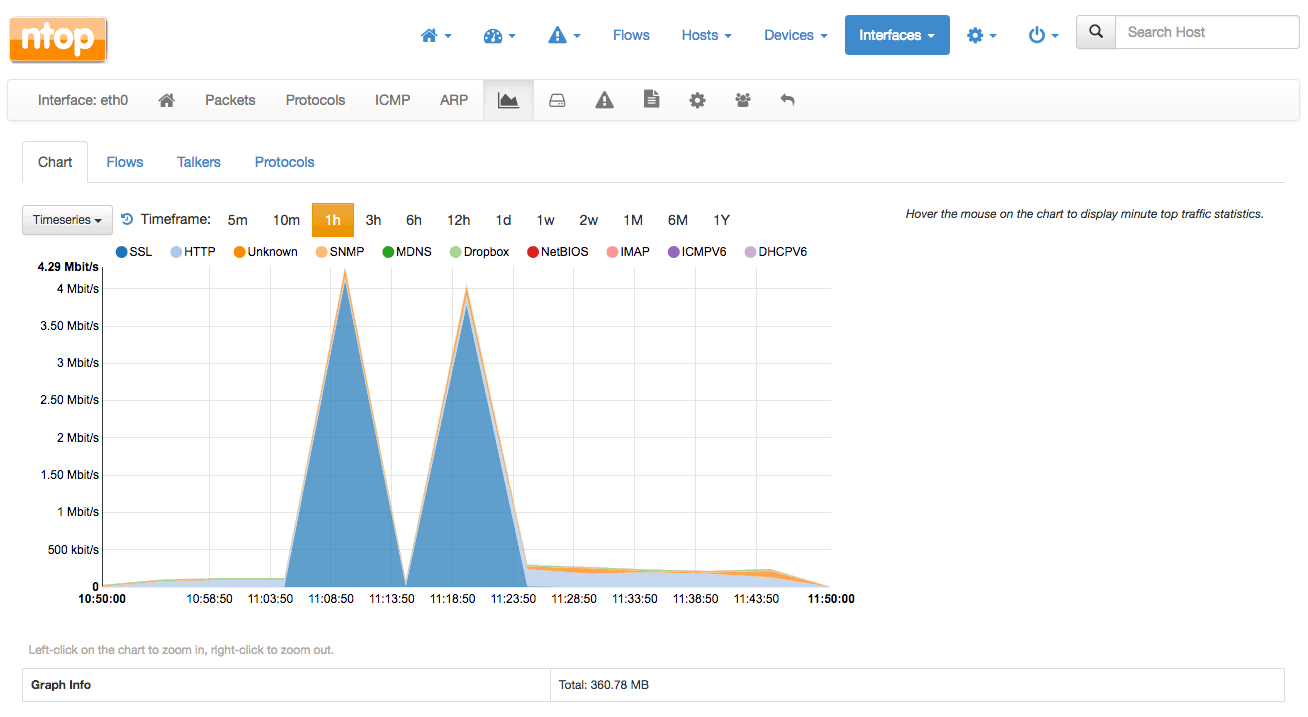
ntopng is a high-speed, web-based traffic analysis that assists with the collection of data and traffic flows. It is a derivative of ntop, which is a network traffic probe that monitors any and all network traffic.
Key Features:
- Open-source, transparent tool
- High-speed, web-based analysis
- Supports a variety of data criteria
- User-friendly, clean interface
Why do we recommend it?
nTopng is recommended for its high-speed traffic analysis capabilities and user-friendly interface, making network monitoring efficient and accessible.
Ntopng has been created with a basis in libpcap, which is portable, making this a tool that can run on a system without requiring compilation or installing. Its main features are related to network traffic sorting, and criteria can be chosen and viewed from here.
IP addresses, ports, L8 protocol, throughput, autonomous systems and more can be viewed from within this platform. This assists with generating network traffic in real time, which gives your IT team a detailed view of the current network environment at a glance.
The user interface is clean and easy to navigate, and it generates clean graphics that are clear and detailed. SNMP support is also on hand, which allows your Linux Server that is hosting NtopPNG to pull important information.
NtoPNG runs on Unix, Linux, MacOS and Windows, and provides a highly usable web-GUI for users to connect to. The web pages are HTML-5, and supports SSL and HTTPS, giving your network data an additional layer of security.
Who is it recommended for?
Ideal for organizations seeking a web-based, open-source solution for detailed network traffic analysis across a variety of criteria.
Pros:
- Open-source project with full transparency
- Free version available alongside the enterprise version
- Special licensing options for nonprofits and educational institutions
Cons:
- User interface is easy to use, but could be improved upon
Those wishing to download NtoPNG can get it from here.
Pricing: Free and Open Source
10. SolarWinds Netflow Traffic Analyzer
SolarWinds is a name that is well known in IT infrastructure circles, and with good reason. They have been designing products for years, and making a huge difference in the way that network monitoring, server monitoring, application monitoring, and almost every other computer related metric is monitored.
Key Features:
- Supports multiple protocols like NetFlow
- Easy-to-use, intuitive interface
- Scales well for large networks
- Granular traffic analysis capability
Why do we recommend it?
SolarWinds Netflow Traffic Analyzer is highly recommended for its robust support for multiple protocols and its user-friendly interface, which makes monitoring large-scale networks efficient and effective.
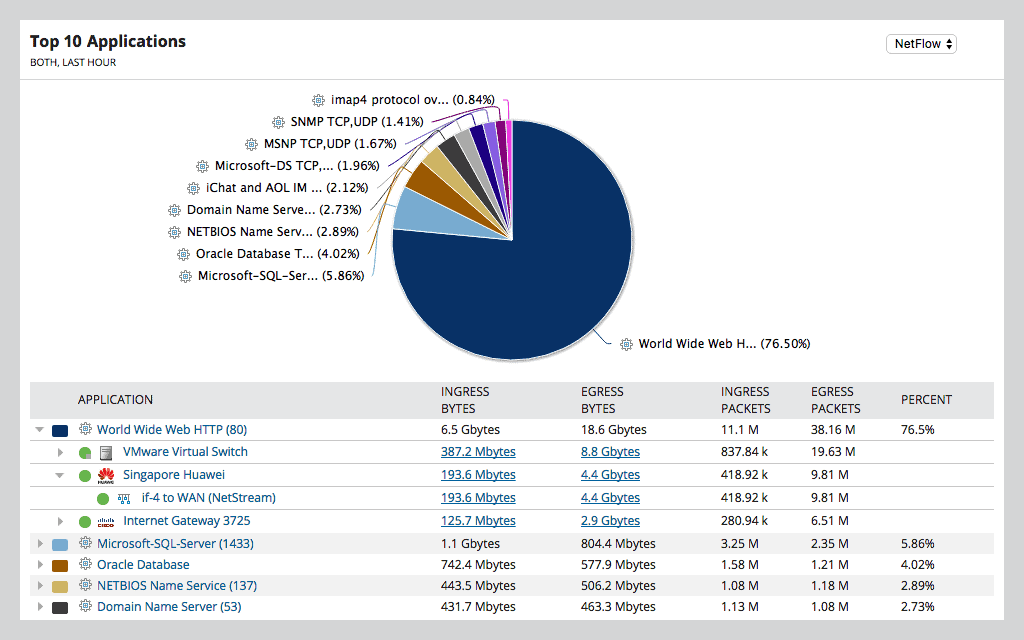
Netflow Traffic Analyzer is both a traffic analyzer, as well as a bandwidth monitoring tool. This means that Network Traffic Analyzer (NTA) provides users with clear visibility with network monitoring activities, and allows for easy network traffic pattern discovery and trends.
It is fast and relatively light weight, which has the potential to lead to faster troubleshooting, increased efficiency, greater visibility and a better understanding of the current state of your network. Any strange network flows and patterns can be picked up quickly and easily, allowing your support staff to begin corrective actions as soon as problems are detected.
NTA also offers full integration with other proprietary platforms, such as Orion Platform products, as well as Network Performance Monitor and Network Configuration Manager. NTA is able to offer all of this functionality and robust application usefulness because of the way that it has been designed and built.
By designing in conjunction with network and systems engineers, NTA is able to provide all of the features and functionality that system administrators require. Bandwidth Monitoring is able to check and monitor Cisco Netflow, Juniper J-Flow, sFlow, Huawei NetStream, as well as IPFIX flow information.
This is allows your team to quickly identify which apps, protocols and services are consuming the most bandwidth in real time. This can be tricky in a Linux environment normally, but NTA makes Linux monitoring really easy to do.
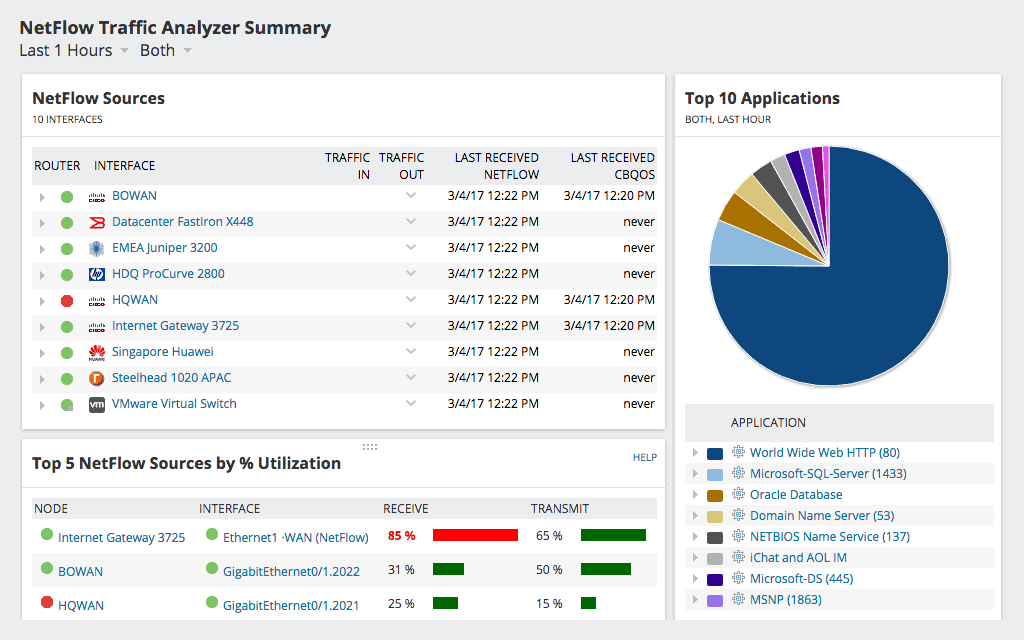
Network Traffic Analyzer collects a lot of data and then correlates it against specific criteria, giving you a comprehensive, web-based presentation of what activity is taking place on your network.
Who is it recommended for?
This tool is ideal for large enterprises that require detailed network traffic analysis and bandwidth monitoring, especially those using Cisco equipment.
Pros:
- Supports multiple protocols like NetFlow, great for monitoring Cisco equipment
- Both tools work well alongside each other to help view traffic patterns and bandwidth usage
- Easy-to-use interface automatically highlights bandwidth hogs and other network traffic outliers
- Scales well, designed for large enterprise networks
- Can view traffic on a per-hop basis, allowing for granular traffic analysis
Cons:
- Built for enterprise use, not designed for small home networks
NTA also offers a Performance Analysis Dashboard, CBQoS policy optimization, malicious and malformed traffic flow identification, customizable network traffic reports, NBAR2 advanced application recognition, WLC traffic monitoring, Integration with SolarWinds user Device Tracker, and much, much more.
You can try it out on a 3o-day free trial here.
Smaller Apps
Not all monitoring applications need to be an entire suite of applications. Some of the older monitoring solutions that were used in Linux environments from many years ago are still being maintained and updated by the developers.
These can be downloaded and used where more modern monitoring systems are not feasible. We have a list of some of these that you can look at for your own network, depending on your requirements.
11. Htop
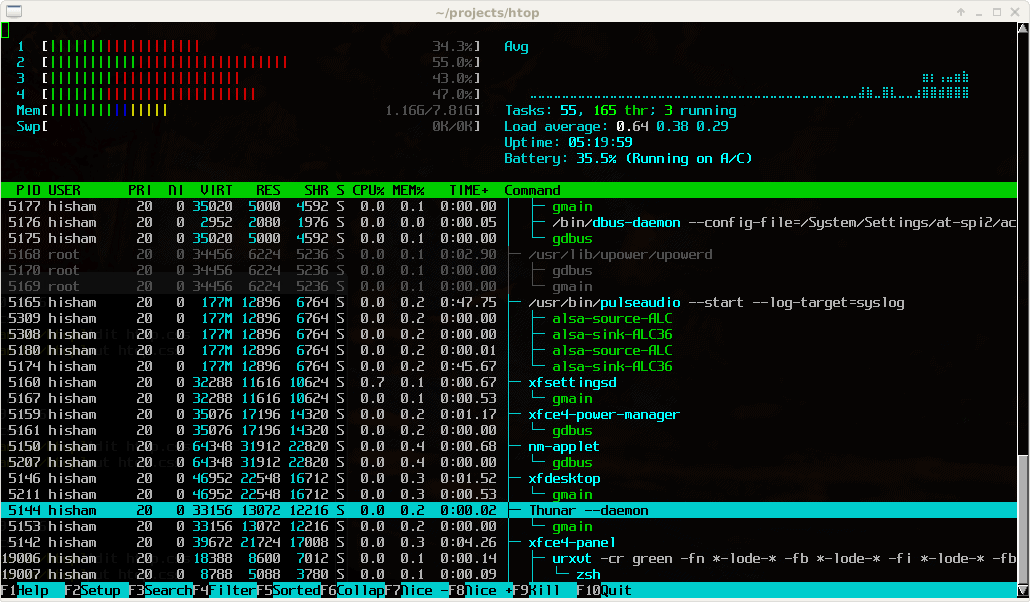
Htop is another version of the famous process viewer for Unix systems, top. This particular version is a text-mode application that runs on Linux and Unix systems with console or X terminal. It is able to do this by using ncurses, which is text based. The overall aesthetic of this application is that of an old school terminal, so is not as visually informative as a graphical interface might be at a glance, but for some people, it could be quite useful.
Key Features:
- Lightweight, text-mode application
- Color-coded insights
- Free and open-source
- Suitable for Unix systems
Why do we recommend it?
Htop is recommended for its lightweight nature and color-coded text insights, making it a practical choice for Unix system monitoring in a non-graphical environment.
Who is it recommended for?
This tool is particularly suitable for administrators who prefer a straightforward, text-based process viewer for Unix systems.
Pros:
- Lightweight installation
- Uses color to highlight key text-based insights
- Completely free
Cons:
- Lacks data visualization
For those that are looking to download Htop, they can find the link to the download packages here.
Pricing: Free to download and use
12. Ibmonitor
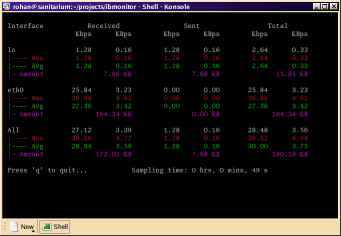
Ibmonitor is another interactive Linux console that can show valuable information about your network. Its main features allow users to view received, transmitted, and total bandwidth usage for specific interfaces, it can calculate and display the combined values of all interfaces. Users can display the total data transferred per interface.
Key Features:
- Simple, interactive console
- Bandwidth usage monitoring
- Customizable data display
- Open-source software
Why do we recommend it?
Ibmonitor is favored for its simplicity and effectiveness in monitoring bandwidth usage with customizable display options in a console interface.
Values can be displayed different size ranges, so you can customize the range to accommodate your particular needs.
While this application can be seen as more of a legacy-styled monitoring tool, there are some older environments that run hardware that could benefit from terminal-based applications.
Who is it recommended for?
Ideal for smaller Linux environments or setups where a straightforward, text-based bandwidth monitoring solution is sufficient.
Pros:
- Simple application – easy to install and use
- Open-source and transparent software
- Better suited for smaller Linux environments
Cons:
- Text-only interface can be difficult to sort through in larger environments
Users that are looking to download ibmonitor can download it from here.
Pricing: Free and open source.
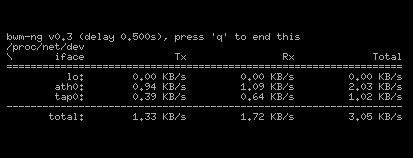
13. BMW-NG
BMW-NG is a bandwidth monitoring solution that is currently in its beta phase. It is able to monitor network and hard disk activity, and keep track of this information in a lightweight, compact application.
Key Features:
- Monitors network and disk activity
- Lightweight and compact
- Runs on various *nix systems
- Outputs data in multiple formats
Why do we recommend it?
BMW-NG is recommended for its compactness and versatility in monitoring both network and disk activity across various Unix-like systems.
It can run on Linux, BSD, Solaris, MacOS X, and other Linux based operating systems. All of this data can be output into plain console, CSV or HTML.
This is a very straightforward and simple logging tool, and while it is certainly useful, its usefulness will depend entirely on what you are trying to monitor, and for how many targets. Its beta status might also be a detracting factor for some people, especially for those that are in a production environment.
Who is it recommended for?
Best suited for environments requiring a straightforward monitoring tool with flexibility in data output, particularly in non-production or testing scenarios.
Pros:
- Available for free from GitHub
- Runs on all *nix variants
- Doesn’t use much memory
Cons:
- Latest release is more than two years old
Pricing: Free and open source
14. Dstat
Dstat is a versatile and lightweight replacement application for vmstat, iostat, netstat and ifstat. Dstat is able to surpass many of the limiting functionalities that these older applications were faced with by adding modern features, such as more counters, and greater flexibility.
Key Features:
- Replaces multiple older tools
- Real-time system resource view
- Color-highlighted text insights
- Wide range of monitoring options
Why do we recommend it?
Dstat is recommended for its ability to replace several older monitoring tools while offering a comprehensive, real-time view of system resources.
Dstat is able to give users a view of system resources in real time, which is a great tool for system administrators.
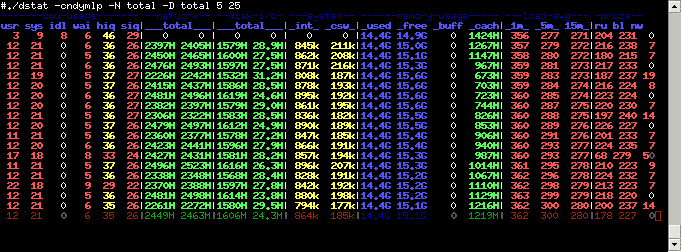
This is a useful tool for system admins that need to visualize their information from wihin a non-graphical command line. There is a wealth of information available for system admins to gain a better understanding of what is running on the network.
Who is it recommended for?
This tool is ideal for system administrators who need a versatile and detailed command-line monitoring tool that consolidates multiple functions.
Pros:
- Uses color to highlight key text-based insights
- Offers a wide range of monitoring options and integrations
- Supports real-time monitoring
Cons:
- Lack graphical reporting
A download link can be found here.
Pricing: Free and open source
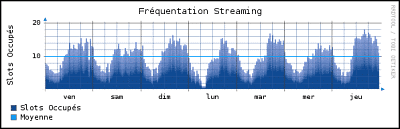
15. Monitorix
Monitorix is a free, open source, lightweight system monitoring software that has been created to monitor multiple services and system resources on a single Linux machine, normally a server. It is able to do all of this by accessing valuable system logs and records within the Linux operating system, compiling them all in a graphical format that can be viewed from another PC or device that supports HTML.
Key Features:
- Excellent graphical interface
- Monitors a wide range of services
- Supports both local and remote monitoring
- Free, open-source software
Why do we recommend it?
Monitorix stands out for its excellent graphical interface and the ability to monitor a diverse range of services and system resources.
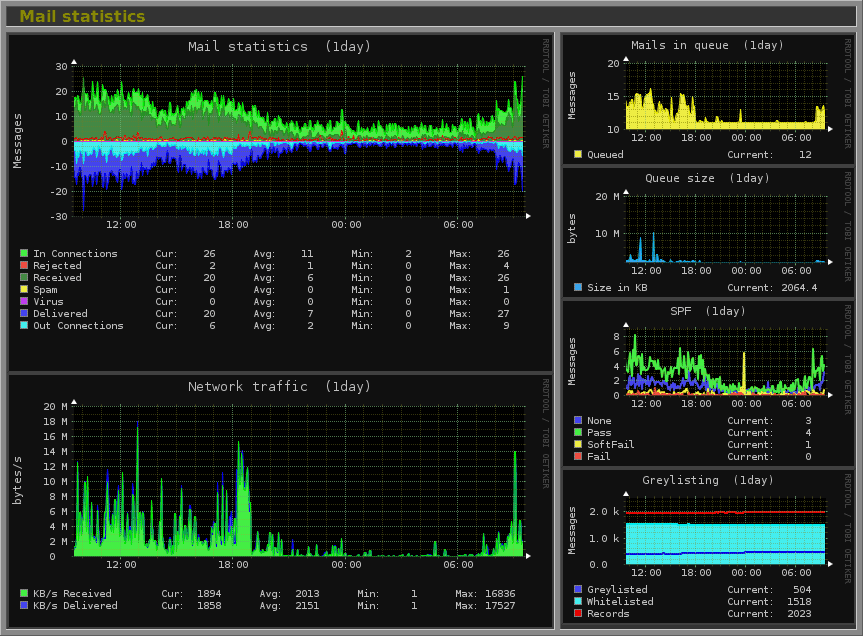
Some examples of features that Monitorix can keep you informed about are: system load, active processes, memory allocation, system entropy, system uptime, and other local performance indicators. It can also monitor network performance, mail queues, and other performance-related issues.
Who is it recommended for?
Recommended for server administrators who prefer a graphical monitoring solution that is both comprehensive and open-source.
Pros:
- Excellent GUI interface
- Supports a wide range of Linux services
- Supports local and remote monitoring
- Free open-source software
Cons:
- Can take time to configure to your liking
Download: https://www.monitorix.org/downloads.html
Pricing: Free and open source
16. Iptraf
IPTraf is a legacy app that is somewhat dormant these days, as the last update that was launched was back in September of 2005. It is a non-graphical application, that uses command-based information and statistics to keep you informed about what you specific system is currently busy with. This allows you to keep updated with what your system is busy with.
Key Features:
- Lightweight, command-based
- Live service monitoring
- Free and open-source
- Suitable for legacy systems
Why do we recommend it?
Iptraf is recommended for its minimal resource usage and ability to provide live service monitoring through a command-based interface, especially on older systems.
This is a valuable piece of software on older systems that are still active, but cannot run in a graphical mode. There are great features for the time that it was released, such as sorting through traffic types such as TCP information.
Who is it recommended for?
Ideal for environments where legacy systems are still in use and a lightweight, text-based monitoring solution is needed.
Pros:
- Lightweight installation
- Support live service monitoring
- Completely free and open-source software
Cons:
- The interface could use improvement
- Is considered a legacy software
IPTraf can be downloaded from here.
Pricing: Free and open source
17. Vnstat
vnStat is a console-based network traffic monitor for Linux and BSD systems, which keeps a log of important system data such as traffic and interface data. This means that all network interfaces can log their incoming and outgoing traffic flows, and will give you an overall indication of what is happening on your network. Where this application differs from many similar products, is that it does not sniff data directly from the interface, but rather, it looks at kernel data and creates its logs from there. This means that it will use much less in the way of system resources.
Key Features:
- Console-based network monitoring
- Lightweight and resource-efficient
- Logs traffic for all network interfaces
- Free and open-source
Why do we recommend it?
Vnstat is favored for its efficiency in logging network traffic across all interfaces, providing essential data without burdening system resources.
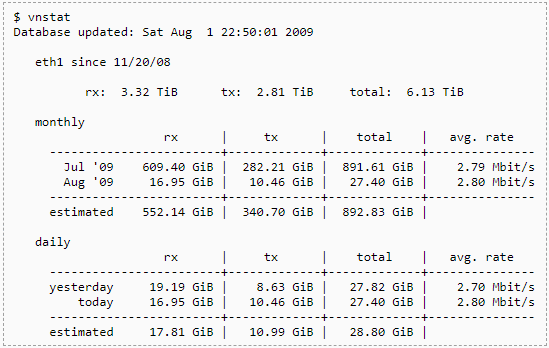
This is a quick and simple application to get running, and can gather persistent information, meaning that you can keep your data even after reboots. Multiple interfaces can also be monitored simultaneously, giving a good indicator of how the network is being interacted with via the server that vnstat is installed on.
Who is it recommended for?
Best suited for users who require a simple, efficient tool to monitor network traffic on Linux servers, particularly in environments with limited resources.
Pros:
- Lightweight console-based application
- Can display all inbound and outbound flows
- Uses very little system resources
Cons:
- The interface could use improvement
- Lack customization options
It can be downloaded from here if you would like to try it for yourself on your Linux server.
Pricing: Free and open source
18. Iftop
Iftop is very similar to how top is used to monitor CPU usage, giving you a great monitoring application that is able to give you real time interface data about the network. This means that any performance issues that you may be experiencing can be picked up quickly.
Key Features:
- Real-time interface data monitoring
- Minimal system resource usage
- Simple deployment
- Effective for smaller networks
Why do we recommend it?
Iftop is recommended for its ability to provide real-time network interface data with minimal impact on system resources, making it a practical tool for ongoing monitoring.
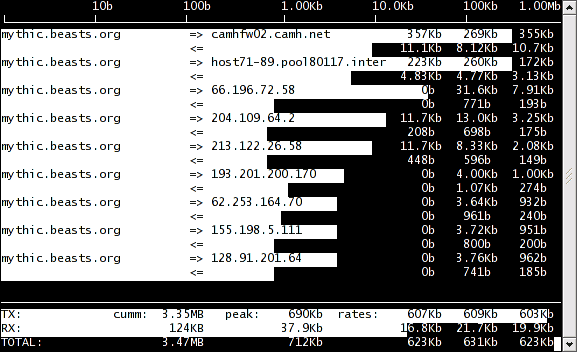
This allows for multiple connections to be viewed at the same time, and from the same lightweight application instance. This is especially useful for Linux admins that do the majority of their work from within the command line.
Who is it recommended for?
This tool is particularly suited for smaller networks or environments where a lightweight, real-time monitoring solution is needed.
Pros:
- Provides a total of all services and their usage metrics
- Uses very few system resources
- Simple and easy to deploy
Cons:
- Better suited for smaller networks
Downloads can be found here.
Pricing: Free and open source
19. EtherApe
Etherape is a graphical network monitor that can be used in Unix-based environments and has been modeled after the well-known, legacy application called etherman. It can operate in the link layer, IP and TCP modes, it can display network activity and show the graphical results of all of the valuable information that you are after on your network.
Key Features:
- Graphical network monitoring
- Supports various network devices
- Continuous updates
- Free and open-source
Why do we recommend it?
EtherApe is recommended for its graphical approach to network monitoring, supporting a wide range of network devices and continuous updates.
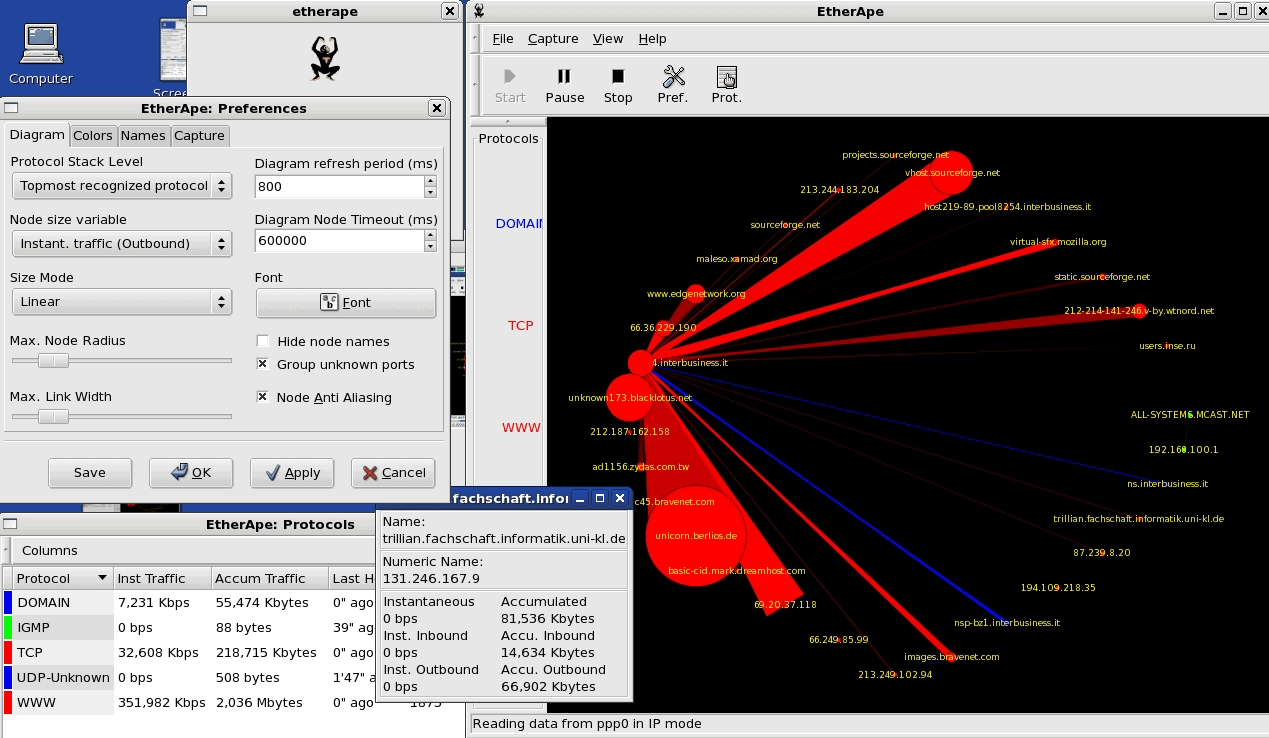
Etherape supports ehternet, FDDI, Token Ring, ISDN, PPP, SLIP and WLAN devices. This makes it a great application for viewing network data in real-time and in a graphical format.
Who is it recommended for?
Ideal for users who prefer a visual representation of network activity and require support for a variety of network devices.
Pros:
- Complete free
- Continuously updated
- Leverages simple but powerful data visualization to display information natively
- An open-source project
Cons:
- Can take time to full configure and explore
Binary packages can be downloaded from here.
Pricing: Free and open source
20. rrdtool
RRDtool is an open source industry standard, high performance data logging solution that also acts as a graphing tool. This gives system administrators the ability to track and log valuable system information that relates to network traffic and other important system metrics. It installs and runs as a local instance, which will give your IT team a lot of information that they can delve into when there are any system issues.
Key Features:
- High performance data logging
- Simple native graphing capabilities
- Supports various Linux distributions
- Open-source project
Why do we recommend it?
RRDtool is valued for its high-performance data logging and graphing capabilities, making it a useful tool for tracking and visualizing network traffic and system metrics.
It can be integrated into your favourite scripting languages, and can be installed on Linux and Unix systems.
Who is it recommended for?
Recommended for system administrators who need a robust, open-source tool for data logging and graphing on various Linux distributions.
Pros:
- Supports simple native graphing
- Supports a wide range of Linux distributions
- An open-source project
Cons:
- Not ideal for larger Linux networks
A download can be found here, and different distributions are also catered for.
Conclusion
As we have shown today, there are a great many different logging and monitoring solutions available for Linux system administrators, both old and new. Some of the newer applications and programs that we have been looking at are incredibly advanced, especially when comparing them to the older, legacy products that have been used in live production environments for decades.
The trade off that you will need to balance is that of performance and pricing. Many of these application re free and open source, which often means that there is a lack of support , and in some cases, the only support is in the form of community intervention.
The skills required to maintain such systems will need to be catered for, or learned in some cases. We hope that this has been a helpful product round up, and hopefully you can now make the right choice for your requirements within your own network!
Linux Network Monitor Tools FAQs
What are some common Linux network monitors?
Common Linux network monitors include tools such as Nagios, Zabbix, Cacti, and Netdata.
What types of network traffic can be monitored using a Linux network monitor?
Using a Linux network monitor, administrators can monitor network traffic such as bandwidth usage, network errors, and network latency.
What types of performance metrics can be monitored using a Linux network monitor?
Performance metrics that can be monitored using a Linux network monitor include CPU usage, memory usage, disk usage, and network throughput.
How does a Linux network monitor work?
A Linux network monitor works by collecting data from network devices and systems, analyzing the data, and presenting the results in a user-friendly format.


