
If you are a part of the network management team within your organization then you know how important it is to maintain visibility of the network and all of the devices that are connected to it.
Here's our list of the top network monitoring tools:
- Auvik – EDITOR'S CHOICE This cloud-based network management and monitoring system creates network documentation with an inventory and a map, which are derived from a discovery process. The tool provides both SNMP-based network device status monitoring and traffic tracking with flow protocols. Get a 14-day free trial.
- Paessler PRTG – EDITOR'S CHOICE A collection of monitors from network, servers, and applications that includes alerts for status problems. Installs on Windows Server. Use up to 100 sensors for free. Download a 30-day free trial.
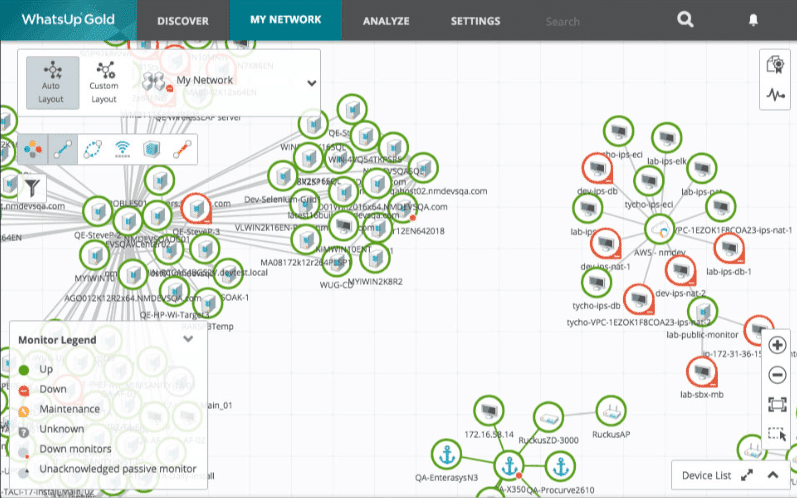
- Progress WhatsUp Gold – FREE TRIAL A network performance monitor that is based on SNMP and include device discovery and network topology mapping. Runs on Windows Server. Start a 30-day free trial.
- AdRem NetCrunch – FREE TRIAL A full-stack network monitoring tool that provides visibility into every aspect of your network, including events, logs, protocols, services, and devices. Request a demo or start a 30-day free trial.
- ManageEngine OpManager – FREE TRIAL A network monitoring and management package that includes a continuous autodiscovery function and draws up network topology maps in a range of formats. Available for Windows Server and Linux. Download a 30-day free trial.
- Site24x7 Network Monitoring – FREE TRIAL This server monitoring system can be expanded to add on network monitoring. This is a cloud-based service.
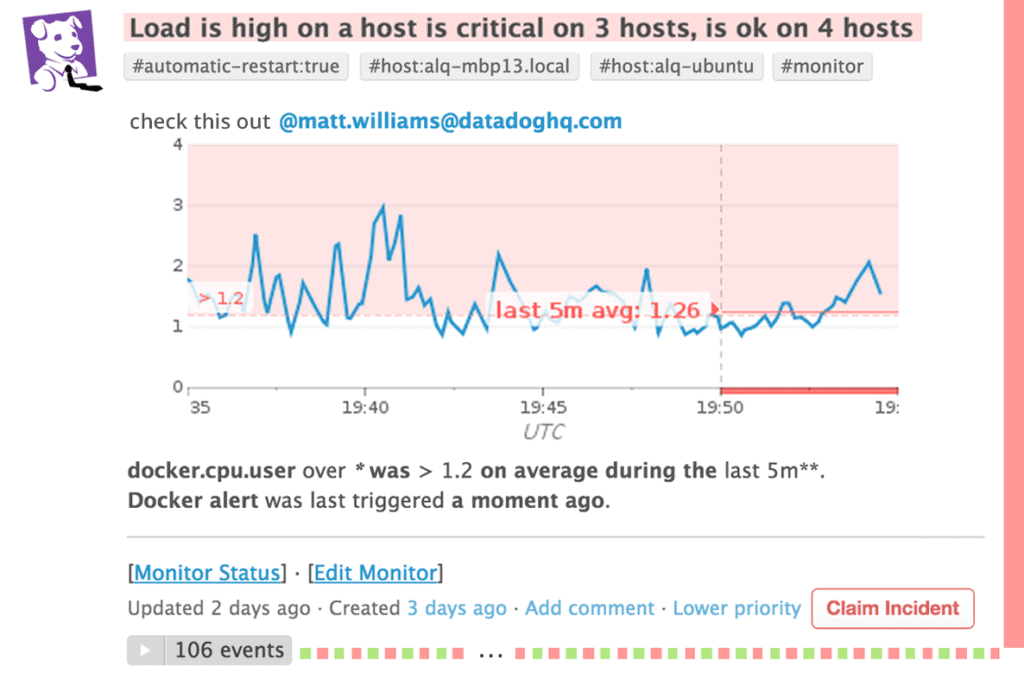
- Datadog Network Monitoring Network traffic and network device monitoring offered as subscription services from this cloud platform.
- Nagios XI An infrastructure monitor that is based on the free Nagios Core and can be extended by free plugin functions. Available for Linux.
- Obkio A unified network performance monitoring tool that converts raw data gathered from your network’s components into real-time insights that can be used for decision-making, capacity planning, troubleshooting, and more.
- SolarWinds Network Performance Monitor This monitor is based on the Simple Network Management Protocol and it polls all network devices for status reports.
- CloudRadar An alert-based monitoring tool for networks, servers, and applications. This is a cloud-based subscription service.
- Noction An internet route improver that also includes a network traffic analyzer. Installs on Linux
- Zabbix A free infrastructure monitoring package that supervises networks, servers, and applications. Available for Linux, macOS, and Unix.
There are many different applications out there that can certainly help you to maintain visibility with the different nodes and segments of your network, but which of them are able to do the exact things that you want them to do?
This guide seeks to answer your questions about the importance of network monitoring in 2026, and how it can be made easier with the right applications and tools. We will try to answer as many of the important questions as we can.
Network Monitoring Features to Look For
Anyone that works with networking knows that protocol support is important. 
Each monitoring application has its preferred methods of scanning computers, appliances and applications for information.
Testing network uptime is also important, as is continuously checking the uptime of servers and networking equipment.
Some important capabilities that you will need in your next network monitoring software application include:
- SNMP: Simple Network Management Protocol is a protocol that operates on the application layer of the OSI model. SNMP is used to manage and monitor network devices, as well as their functions and capabilities.
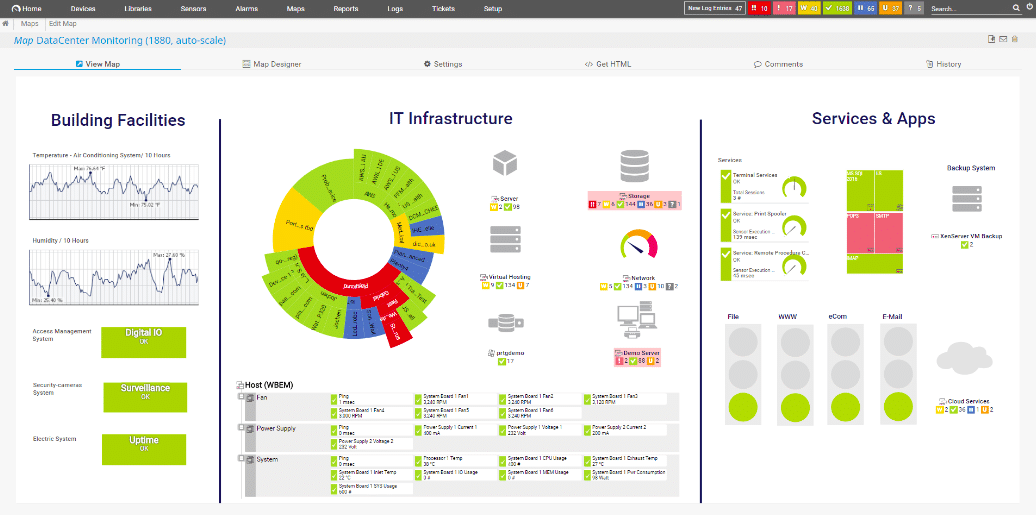
- WMI: Windows Management Instrumentation is the way that Microsoft implemented its own version of Web-Based Enterprise Management, also known as WBEM. This is an initiative driven by industry to develop one standard that allows access and management for servers and computers in an enterprise environment.
- PING: Ping programs provide a simple method of determining if a computer or network connected device is up and running and responding to requests. It does this by sending ICMP (Internet Control Message Protocol) echo requests to the target destination and then waits for a response. This is the most commonly used network troubleshooting command as it can tell you the state of a target on your network in less than a few seconds.
- Tracert: Tracert, or Traceroute, is a command that shows you the path that your packets are currently taking when looking at a specific destination such as a target host or website. It shows you which path it is taking, and the latency for each hop. This is a good way to see where your packets are being slowed down, held up or even dropped.
- Uptime of Servers: The ability to check how long a server has been online is very handy, especially when troubleshooting. If you suspect a reboot or unscheduled shutdown has occurred, then checking the unit’s uptime is a clear indicator of how long it has been powered up for.
- Exchange Servers: Diagnostic tools for Microsoft Exchange are important if your environment houses an exchange server. Being able to quickly repair issues as they come up is vital if you are going to keep the flow of email at an acceptable rate within your enterprise. Email is the lifeblood of any organization that operates presently, so keeping these systems healthy is very important.
- Database Servers: Database servers keep the wheels turning in the background for companies that use complicated software. Databases are the storage component of your enterprise, and they keep the transactional side of your systems operating efficiently. If a database that your applications are reliant upon crashes, then you will find that operations will grind to a halt as services that rely upon the database start to fail. Diagnosing faults in the database before they become a problem is a good way to avoid disaster when monitoring databases.
- Netflow/Sflow/IPFix: Network traffic analysis comes in many flavors, and these are just 3 of the main methods of traffic analysis that you could employ on your own network. Many of these software packages have built-in Netflow analysis and collectors for many of the most popular Flow Protocols.
Related Post: The Best Network Troubleshooting Tools
The Best Network Monitoring Tools
Our methodology for selecting network monitoring tool:
We've broken down our analysis for you based on these key criteria:
- Compatibility with diverse network protocols and standards, ensuring broad applicability across different network environments
- The tool's ability to perform continuous monitoring, essential for maintaining network health and performance.
- Support for diagnostic and troubleshooting features like Tracert and Ping, vital for identifying and resolving network issues
- Capabilities for visual representation of network health and performance, aiding in easier interpretation and decision-making
- The presence of advanced features like real-time alerts and auto-discovery, enhancing operational efficiency and responsiveness
It isn’t easy trying to find the perfect network monitoring solution for your organization, as there are plenty of different elements that need to be catered for, and not many applications have everything that you need for your specific requirements.
Have a look at the list below and look for the Best Application and software suite that matches all your needs and download a trial and get it installed to see how it works in your environment.
1. Auvik – FREE TRIAL
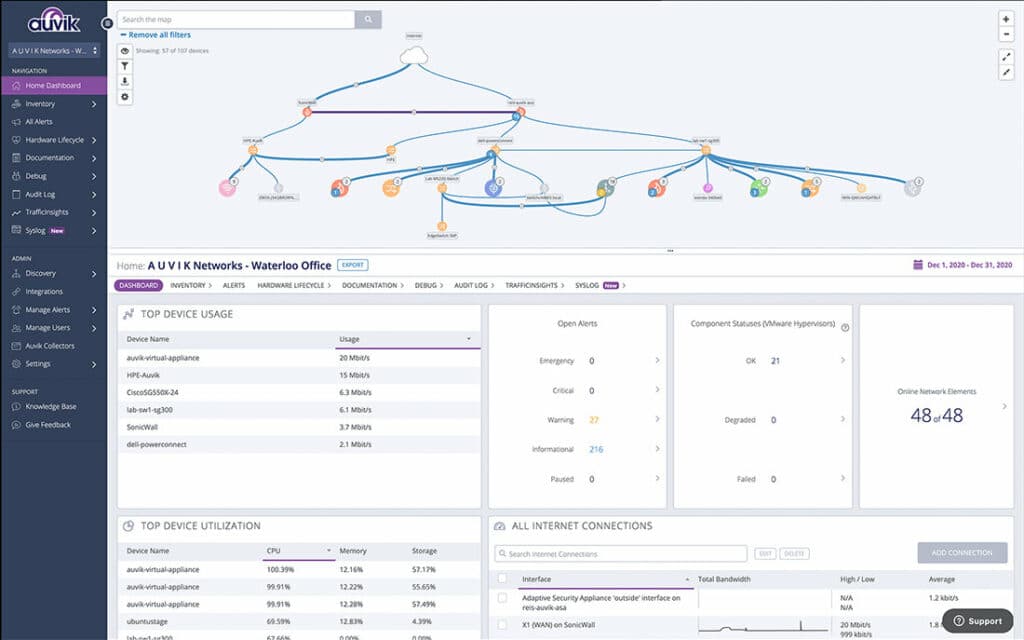
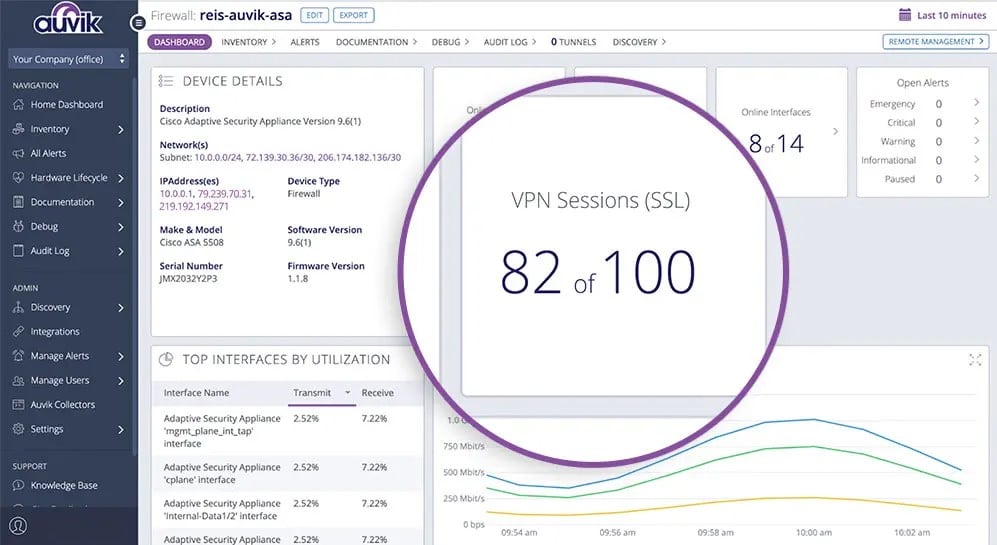
Auvik is a network monitoring tool that is based in the cloud. The package installs an agent on one of the servers on your site. This unit acts as an SNMP agent and it broadcasts SNMP requests to provoke responses from device agents. All of the data that the agent gathers is sent up to the Auvik server where it is assembled into a network inventory. The package displays a network map, based on the data in the inventory.
Key Features:
- Cloud-Based SaaS: Auvik operates entirely in the cloud, ensuring easy deployment and management without on-site infrastructure.
- Automated Network Mapping: Continuously updates network maps and inventory with each SNMP polling cycle for accurate real-time visibility.
- Real-Time Traffic Analysis: Utilizes protocols like NetFlow and sFlow to monitor bandwidth usage and identify potential bottlenecks.
- Configuration Management: Tracks and stores device configurations, alerting you to any unauthorized changes and enabling quick rollbacks.
Why do we recommend it?
Auvik is recommended for its comprehensive network monitoring capabilities, which include automated network mapping, real-time traffic analysis, and robust configuration management. Its cloud-based nature ensures quick deployment without the need for on-premises infrastructure, making it an excellent choice for organizations looking to streamline network management.
The inventory and map get automatically updated with every SNMP polling cycle. Responses supply status information, which is displayed in the Auvik dashboard. SNMP Traps, warning of problems are interpreted into alerts. These are shown in the dashboard and also sent out as notifications. Auvik can channel alerts into Service Desk systems as tickets
The Auvik package extracts traffic data from network devices, using the NetFlow, IPFIX, sFlow, and J-Flow. This gives you the full potential capacity of each link and its current bandwidth utilization.
Another important component in the package is its Configuration Manager. This takes an image of the configuration of each network device and stores it. Auvik then checks each device every 60 minutes and compares its existing settings to the stored image. If the configuration has changed, the tool raises an alert, giving the administrator the option of wiping out those changes by reapplying the stored image.
Who is it recommended for?
Auvik is ideal for IT professionals and network administrators who need a powerful yet easy-to-deploy network monitoring solution. It is particularly suited for businesses that require detailed visibility into network performance, efficient configuration management, and automated alerts for proactive troubleshooting.
Pros:
- Cloud-based SaaS package
- Network discovery that renews network documentation periodically
- Network inventory and map
- Traffic analysis with flow protocols
- Network configuration management
Cons:
- No price list
Auvik doesn’t publish a price list, so you need to contact the company to request a quote. You can examine the Auvik package by accessing a 14-day free trial.
EDITOR'S CHOICE
Auvik is our top pick for a network monitoring tool because it offers both network device monitoring and traffic analysis in one package. The service is based in the cloud but it works through an on-premises agent to scan the network and document all devices. The package repeats its network scan and keeps system information in the dashboard up to date. The package analyzes traffic with the IPFIX, NetFlow, sFlow, and J-Flow protocols. Another feature of this system is its Network Configuration Management unit. This stores an image of the configuration of each device. It then checks the configuration of each device every 60 minutes. If the settings have changed, the tool gives the administrator the option to restore the stored configuration.
Download: Get a 14-day FREE Trial
Official Site: https://www.auvik.com/features/#trial
OS: Cloud-based
2. Paessler PRTG Network Monitor – FREE TRIAL
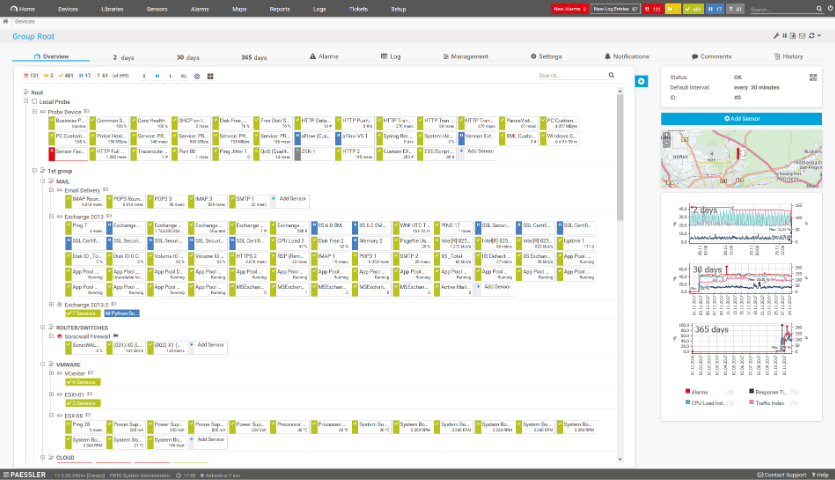
Paessler PRTG Network Monitor has been designed from the ground up with monitoring services in mind. You are able to check on all systems, devices and traffic whenever you need to, as well as applications and the IT infrastructure that you are supporting. PRTG bills itself as a single solution, meaning that you don’t have download any other tools or utilities. PRTG is a multipurpose tool that monitors all of your IT infrastructure.
Key Features:
- Comprehensive IT infrastructure monitoring
- Customizable dashboards
- Wide range of alert mediums
- Freeware version available
Why do we recommend it?
PRTG stands out for its all-in-one monitoring capabilities, offering a broad range of monitoring options and an easy-to-use customizable interface, suitable for diverse IT environments.
It can help you with traffic, packets, applications, bandwidth, cloud services, databases, virtual environments, uptime, ports, IPs, hardware, security, web services, disk usage, and many other elements of your network.
Simplifying your daily tasks is the name of the game here, where network discovery doesn’t need to be a chore. PRTG can scan your network segment by segment, as well as use ping tools to establish what targets are online.
This makes PRTG especially useful when you use the predefined device templates that it ships with. Saving yourself configuration time is also one of the benefits that PRTG offers its users, so you can spend more time monitoring and less time configuring your setup.
Who is it recommended for?
This tool is ideal for IT teams looking for a versatile, comprehensive monitoring solution that covers all aspects of their IT infrastructure, from network to applications.
Pros:
- Uses a combination of packet sniffing, WMI, and SNMP to report network performance data
- Fully customizable dashboard is great for both lone administrators as well as NOC teams
- Drag and drop editor makes it easy to build custom views and reports
- Supports a wide range of alert mediums such as SMS, email, and third-party integrations into platforms like Slack
- Each sensor is specifically designed to monitor each application, for example, there are prebuilt sensors whose specific purpose is to capture and monitor VoIP activity
- Supports a freeware version
Cons:
- Is a very comprehensive platform with many features and moving parts that require time to learn
Starts at $1,600 for 500 sensors. Download and Monitor up to 100 sensors for free and then gain access to a 30-day free trial.
3. Progress WhatsUp Gold – FREE TRIAL
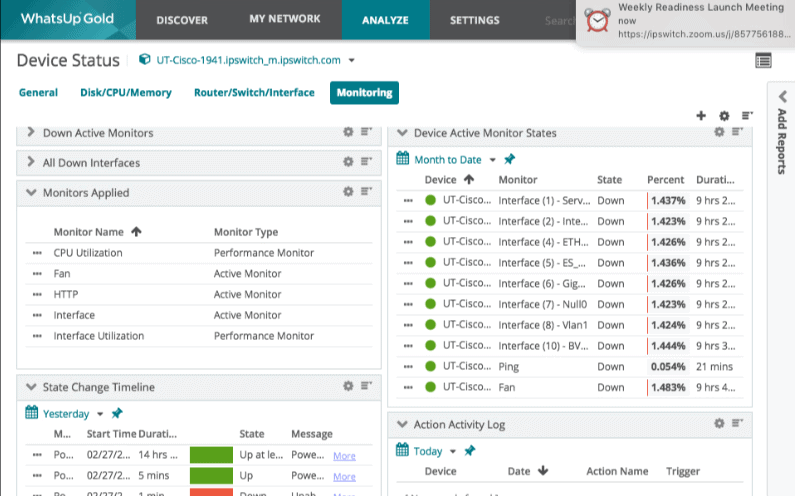
Progress WhatsUp Gold is a basic system checker that lets you quickly see what is up and what is down on your network. This helps you to control the systems that are communicating with your core infrastructure and gives you a good idea about what is working and what is not working.
Key Features:
- Simple visualization tools
- Modular pricing options
- Comprehensive monitoring of LANs and WANs
- Customizable dashboards
Why do we recommend it?
WhatsUp Gold is notable for its straightforward and effective monitoring capabilities, offering an intuitive user experience with its modular approach, suitable for small to medium-sized businesses.
This gives you much needed visibility regarding the status of your environment, and the many components that it has to support.
WhatsUp Gold has a quality versus quantity approach, so they have some great filtering features that ensure that you only get the most important alerts without being spammed by unnecessary messages. Mapping and visual tools also help you to see what path your data is taking, as well as how the devices that need to be online are being handled.
Map discovery is done automatically thanks to the SNMP discovery implementation. This means that network devices, servers, computers, virtual machines, wireless devices, and even cloud-based devices. Clicking on an icon in the map layout gives you instant access to more information regarding that device. This makes report generation very easy to accomplish.
If you have frequent information requirements from the same data sources then WhatsUp Gold lets you create customizable dashboards. This makes the information much easier to find, and will give you the data that you need right at your fingertips. WhatsUp Gold has been around for a long time, and it has grown with each release.
Who is it recommended for?
Recommended for SMBs and IT teams who need a straightforward, customizable monitoring solution that offers essential network insights without overwhelming complexity.
Pros:
- Uses simple visualizations to help provide at-a-glance insights
- Supports modular pricing, allowing companies to pay only for features they intend to use
- Ideal for SMB environments
- Excellent dashboard and reporting visuals
- Can monitor LANs, WANs, and cloud-based applications such as container environments
Cons:
- Modular upgrades might not be a good fit if you intend on utilizing all aspects of a networking monitor
You can download a 30-day free trial.
4. AdRem NetCrunch – FREE TRIAL

AdRem NetCrunch is an agentless tool that automatically discovers devices, collects data from them, and analyzes this data to provide the insights you need about your network. It goes beyond devices and includes protocols, events, services, and other components in your network.
Key Features:
- Lyer 2 visualization.
- Customizable dashboards.
- Traffic flow analyzer.
- Configuration monitoring.
Why do we recommend it?
NetCrunch is recommended because it comes with many features that provide complete control and visibility into your networks. It supports 70+ built-in monitors, 200+ monitoring packs, 8700+ MIB modules, and 680 targets, touching every aspect of your network and its operations. It is well-suited for IoT and industrial environments, as you can customize it to monitor specific hardware devices.
It uses SNMP traps and network flows to gather data from devices without having to install agents. This data is further analyzed through the lens of custom policies and rules to identify deviations. Accodingly, it sends alerts and notifications, enabling you to take proactive measures to improve the health and performance of your networks.

Who is it recommended for?
NetCrunch is a good choice for IT engineers and network administrators who want comprehensive visibility into their networks through a single pane of glass. Given its customization options, NetCrunch works well for organizations of all sizes and industries, including those in regulated industries, and using mixed environments.
Pros:
- Highly scalable, and can cover more component types.
- Intuitive dashboards and presentations to help make sense of the data.
- Integrates using REST APIs, ensuring smooth data flows.
- Sends alerts and notifications based on automation rules.
Cons:
- Would like to see a dedicated mobile app.
NetCrunch offers three plans based on your specific monitoring needs. The System Monitoring starts at €2,625, Bandwidth and Network Monitoring at €2,325, and Large-scale Mixed Environments at €16,250, respectively. You can request a demo. You can also start a 30-day free trial.
5. ManageEngine OpManager – FREE TRIAL
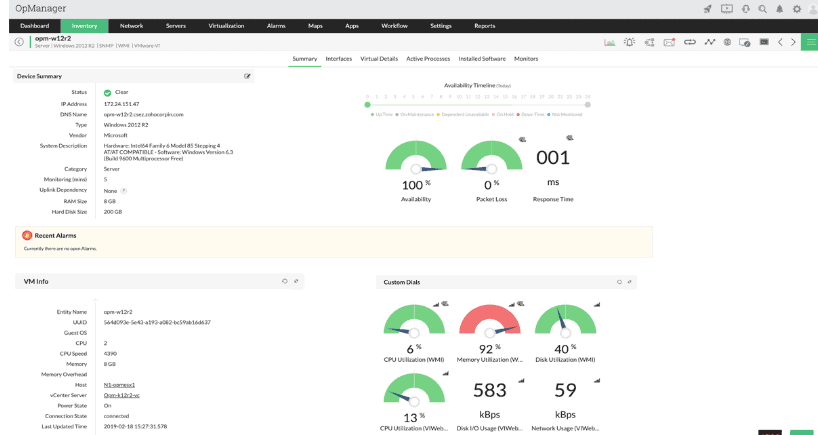
ManageEngine OpManager is a network monitoring platform that gives you real-time vision of your environment. There is physical and virtual server monitoring components to OpManager that allow you to see exactly what is happening in all of your environments.
Key Features:
- Physical and virtual server monitoring
- Multiple troubleshooting tools
- Graphical server representations
- Advanced alerting options
Why do we recommend it?
OpManager provides a versatile monitoring solution, effectively combining physical and virtual server monitoring with robust troubleshooting tools and intelligent alerting.
The main selling point of ManageEngine is the fact that it is a single tool that gives you multiple ways to perform troubleshooting and repairs on your network. When you detect issues such as bad configurations or machines that are offline, you can take action from the main console page of OpManager, instead of needing to open up multiple tools to see where the fault has been detected.
The different OpManager offerings all have their own specific functions that they are able to perform. The free version of OpManager gives you basic monitoring for Windows, Linux, SQL, AD and MySQL, EventLog and Trap. There is also SNMP for network discovery and scanning.
The main limitation is that the software only caters for up to 10 devices on the network to be scanned. It does support VMWare and Hyper-V, as well as Xen servers.
Visualise your physical installations with graphical representations of your servers and networking equipment, giving you real world information about where faults are occurring on your network. Essential and Enterprise versions of OpManager have all of the same features as the free version, with the addition of WAN, VoIP monitoring and Automatic Network Mapping being present on both.
The only feature that the Enterprise version has that the other 2 are lacking is the failover support.
Who is it recommended for?
Ideal for IT administrators who need a unified tool for both physical and virtual server monitoring, with a focus on real-time insights and proactive issue resolution.
Pros:
- Designed to work right away, features over 200 customizable widgets to build unique dashboards and reports
- Features traffic management options alongside DPI tools
- Uses intelligent alerting to reduce false positives and eliminate alert fatigue across larger networks
- Supports email, SMS, and webhook for numerous alerting channels
- Can set up SLAs based on network, application, or process
Cons:
- Is a feature-rich tool that will require a time investment to properly learn
You can start by downloading a 30-day free trial.
6. Site24x7 Network Monitoring – FREE TRIAL
Site24x7 is a cloud-based system monitoring platform. Site24x7 Infrastructure is its server and Network monitoring module. The base version of Infrastructure only includes the server and application monitoring. The Network Monitor is a paid add-on to the module.
Key Features:
- Holistic monitoring platform
- Real-time device discovery
- User-friendly interface
- Freeware version available
Why do we recommend it?
Site24x7 offers an all-encompassing monitoring tool, adept at providing real-time updates and a user-friendly experience, making it a comprehensive choice for varied monitoring needs.
All the processing for Site24x7 Infrastructure is performed on cloud servers. However, an agent needs to be resident on a server connected to the network that is being monitored. This agent can run on Windows Server and Linux and its purpose is to gather statistics. The agent uploads those statistics over an encrypted connection to the Site24x7 server for processing.
The dashboard for the monitoring service is also resident in the cloud and each of the screens can be customized by working with a drag-and-drop widget method. The console for Site24x7 can be accessed by technicians through any standard web browser from anywhere.
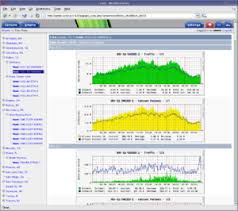
The Network Monitoring add-on includes an autodiscovery service. This probes the network and records the presence of every device that is connected to it. The network monitor is able to monitor switches, routers, load balancers, firewalls, VPNs, and wireless network APs. The inventory that the service compiles is updated regularly, so any changes to the network’s layout and equipment are instantly noted. The inventory shows the device type, make, model, CPU, and memory capacity and utilization plus a range of other statistics.
The Network Monitor creates a network topology map from the information stored in the network inventory. Whenever the inventory gets updated, so does the topology map. The map shows device statuses and live traffic volumes on each link.
The Network Monitor uses the Simple Network Management Protocol to request status reports from device agents. This supplies all of the data needed for device monitoring. Traffic statistics are gleaned by using bandwidth analysis protocols, such a NetFlow.
Site24x7 Infrastructure has an alerting system. This is central to network and server monitoring automation because it lets technicians assume that everything is working properly. Therefore, the monitor takes care of the network until a problem arises. The monitor then draws staff back to the system dashboard through notifications sent by SMS message or email.
Who is it recommended for?
Ideal for organizations seeking a unified platform for monitoring networks, infrastructure, and real user interactions, emphasizing ease of use and detailed reporting.
Pros:
- One of the most holistic monitoring tools available, supporting networks, infrastructure, and real user monitoring in a single platform
- Uses real-time data to discover devices and build charts, network maps, and inventory reports
- Is one of the most user-friendly network monitoring tools available
- User monitoring can help bridge the gap between technical issues, user behavior, and business metrics
- Supports a freeware version for testing
Cons:
- Is a very detailed platform that will require time to fully learn all of its features and options
The Site24x7 Network Monitoring system is available in the All-in-one plan as well as part of Site24x7 Infrastructure. The All-in-one package includes all of the Site24x7 stable of system monitoring tools. Site24x7 Infrastructure is charged for by a subscription of $9 per month when paid annually. The price for the Network Monitoring add-on is:
- 100 network interfaces: $50 per month
- 250 network interfaces: $75 per month
- 1,000 network interfaces: $200 per month
You can access a 30-day free trial of Site24x7.
7. Datadog Network Monitoring
Datadog is a multi-platform monitoring solution that allows you to monitor infrastructure and apps, in any environment.
Key Features:
- Customizable dashboards
- Cloud-based SaaS platform
- Auto-discovery for network topology
- Scalable alerting options
Why do we recommend it?
Datadog excels in offering customizable and scalable network monitoring solutions, especially with its cloud-based approach and real-time network topology mapping.
Using Datadog allows you to quickly setup dashboards, monitor infrastructure, collaborate with stakeholders and colleagues, monitor alerts, integrate systems with the API, engage in Machine Learning services and much more. Setting up dashboards is intuitive and easy to do, and you can add as many different metrics to monitor as you want.
Getting alerts on critical issues is another great feature that Datadog offers.
The scalability of these alerts ranges from single systems to multiple clusters of devices. You can determine the metrics for yourself, so if you want alerts on basic system resource consumption such as memory and CPU usage, then the ability to set up custom alerts is there.
If you have specific application monitoring requirements, then that is also a metric that can be configured.
Who is it recommended for?
Best suited for businesses needing a flexible, cloud-based network monitoring solution that can scale with their infrastructure, offering comprehensive insights across various environments.
Pros:
- Easy-to-use customizable dashboards
- Cloud-based SaaS product allows monitoring with no server deployments or onboarding costs
- Can monitor both internally and externally giving network admins a holistic view of network performance and accessibility
- Supports auto-discovery that builds network topology maps on the fly
- Changes made to the network are reflected in near real-time
- Allows businesses to scale their monitoring efforts reliably through flexible pricing options
Cons:
- Would like to see a longer trial period for testing
Datadog offers excellent API support, and lets you integrate with its code so that you can create customizable and flexible monitoring solutions for your own custom environment. Starts at $15 per host per month paid annually, but there are many different pricing structures and tiers that you can look at. A 14-day free trial is available.
8. Nagios XI
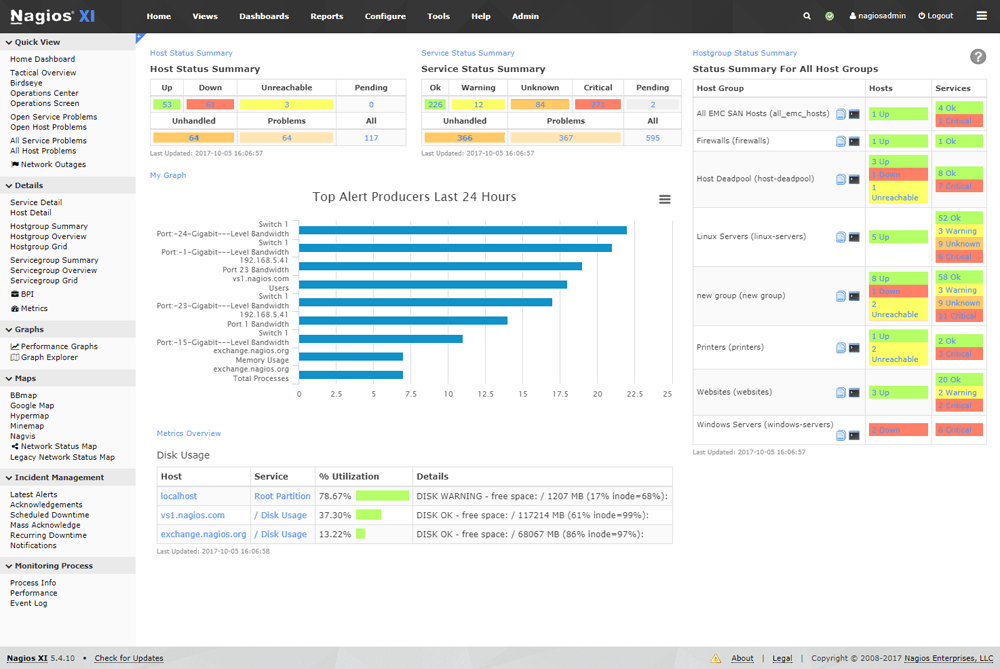
Nagios XI provides clients with a monitoring application that watches mission critical systems such as infrastructure components and applications. Other elements that it is able to monitor include services Operating Systems, network protocols, system metrics and network equipment and infrastructure.
Key Features:
- Extensive open-source monitoring
- Autodiscovery for device management
- Customizable dashboard
- Supports numerous extensions
Why do we recommend it?
Nagios XI provides a robust, open-source solution with extensive monitoring capabilities and a highly customizable interface, making it an excellent choice for adaptable network monitoring.
Other applications from third party providers are also supported. Nagios XI has been built around Nagios Core 4 which is a monitoring engine that provides users with the best performance without causing system degradation of the host system that it is installed on. This makes this solution especially scalable over bigger environments. Visibility is achievable thanks to the central view that is provided for your IT operations.
Excellent dashboard functionality is also a feature, so you can create useful views for your systems.
There is also an integrated web-based configuration tool that allows you and your team to hand out control of managing the monitoring configuration, system settings and other features. This means that you can delegate control out to the relevant users if you need to, which frees up your technical team.
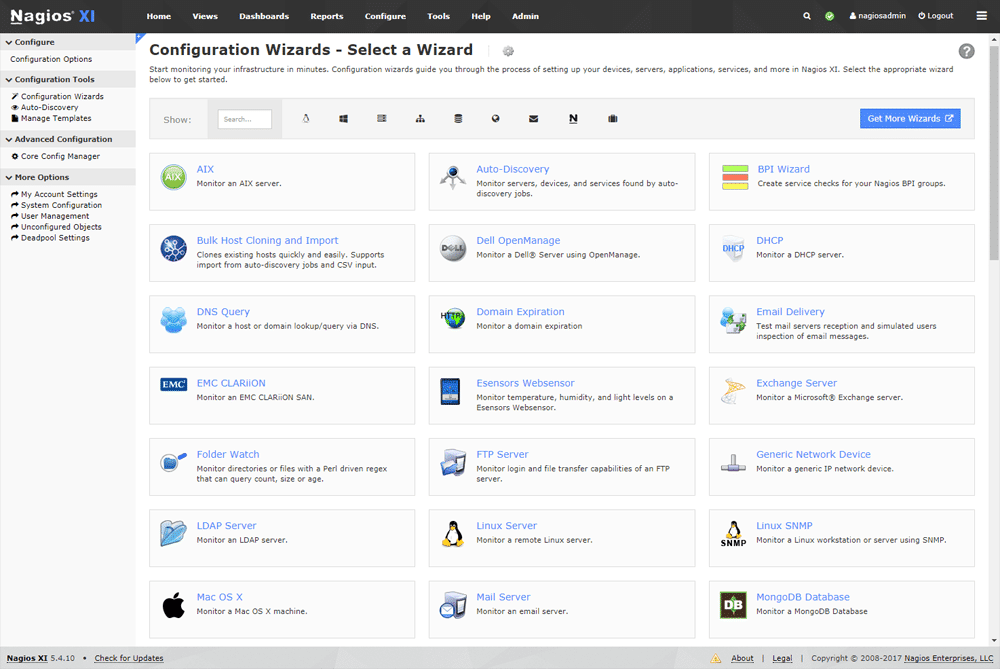
The configuration wizard makes it very easy for you to add new devices and applications to be monitored, so you don’t have to understand advanced monitoring concepts to get started.
Who is it recommended for?
Ideal for IT professionals who prefer open-source solutions with the flexibility to tailor the monitoring experience and integrate various extensions as needed.
Pros:
- Is open-source and completely free, with a paid option for enterprises
- Supports autodiscovery for easy device management
- Highly customizable and detailed dashboard (9 extensions for Fortinet)
Cons:
- Offers many features that can take time to explore
Nagios XI provides multiple APIs that make integrating your systems very simple. Community developed application plugins are also available, so if you have specific applications or metrics that you need to monitor then the chances are good that somebody out there has already written a plugin that will help you.
Download a Nagios Trial from here. Standard Edition pricing starts at $1,995
9. Obkio

Obkio is one of the top network monitoring platforms that offer unified visibility into your network by collating and analyzing data from different network aspects. It presents this analyzed data in intuitive dashboards, making it highly useful and relevant for different audiences.
Key Features:
- Monitors all network segments.
- Sends proactive alerts.
- Generates performance reports.
- Identifies the root cause of problems.
Why do we recommend it?
Obkio is a unique tool as it combines extensive network coverage with versatility and simplicity. It gathers a wide range of metrics from all your network’s components, including its hardware and software. After collecting this data, it combines and analyzes them to help identify the root cause of issues.
Based on the severity of issues, it sends alerts and displays the contextual information in an intuitive format for easy understanding. All this information can support your network engineers to troubleshoot issues proactively and improve the performance of your network.

Who is it recommended for?
It is recommended for organizations of all sizes and types, including those that have a distributed architecture. Its applicability across a wide range of use cases makes it a good choice for organizations across all industries.
Pros:
- Simple visualizations for easy understanding.
- Comprehensive coverage of all network components.
- Transparent pricing.
- Easy to use.
- Good customer support and documentation.
Cons:
- Fewer advanced features in the starting plans.
Obkio is priced at $224 per month in the basic plan. Start a 14-day free trial.
10. SolarWinds NPM
SolarWinds Network Performance Monitor is a firm favorite among IT professionals as it gives plenty of features and abilities that you need. It has multi-vendor support for different network equipment providers, a network insights feature that gives deeper visibility and understanding of the environment.
Key Features:
- Multi-vendor support
- Network insights for visibility
- Intelligent mapping
- Advanced alerting features
Why do we recommend it?
SolarWinds NPM stands out for its comprehensive coverage across multiple vendors and its deep network insights. Its intelligent mapping and advanced alerting features make network management more efficient and effective.
From all of this information, intelligent maps can be generated, providing even more knowledge and technical understanding of the environment. Features such as NetPath and PerfStack are two other features that help you to maintain larger environments, and there is a whole range of advanced alerting features for you to take advantage of.
NPM also offers PerfStack cross-stack network data correlation, which helps you to accelerate and identify the root causes of your issues. It has an intuitive user interface that is easy to use and lets you drag and drop network performance metrics on a timeline that is common to the rest of your networked components.
Visual representations also help you to make sense of the current state of your network, especially relating to health and performance stats of your critical network equipment such as routers and switcher.
Who is it recommended for?
This tool is ideal for IT professionals and network administrators in environments with diverse network equipment. It's especially beneficial for those needing detailed visibility and proactive monitoring in complex networks.
Pros:
- Supports auto-discovery that builds network topology maps and inventory lists in real-time based on devices that enter the network
- Has some of the best alerting features that balance effectiveness with ease of use
- Tons of preconfigured templates, reports, and dashboard views
Cons:
- This is a feature-rich enterprise tool designed for sysadmin, non-technical users may some features overwhelming
Choosing this product as your main network monitoring solution makes a lot of sense. It has enterprise features with a user-friendly interface that doesn’t take very long to install.
The initial setup and configuration may take a while, especially if you have multiple complicated network setup elements such as multiple subnets and different domains, but the end result is that you end up with a comprehensive system that gives you greater visibility over your installed network components. Download a 30-day free trial.
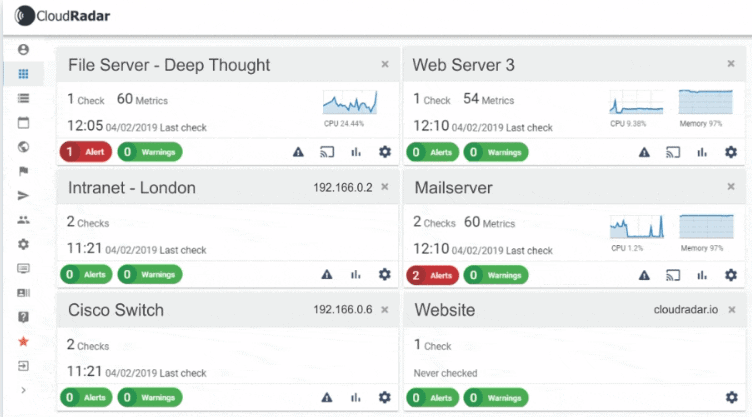
11. CloudRadar
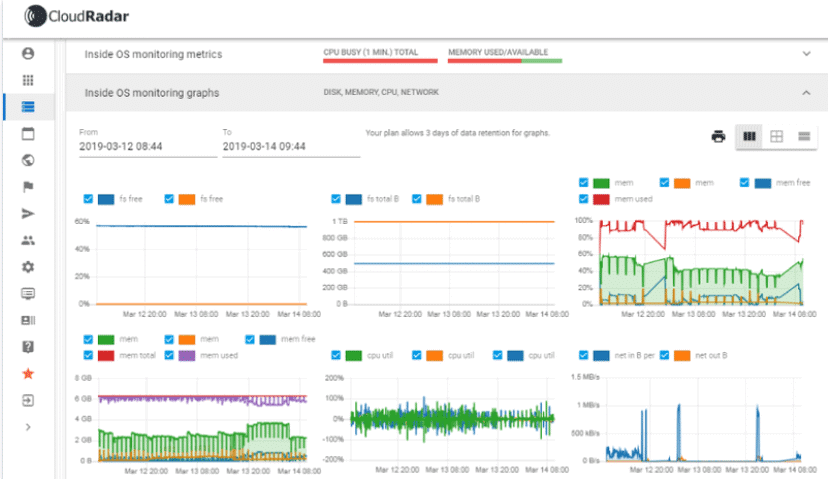
CloudRadar is a reliable and affordable monitoring solution that is easy to use and setup. It allows you to keep an ever watchful eye on servers, networks and various web-based assets such as websites and other hosted platforms on the internet.
Key Features:
- Customizable interface for NOC teams
- Variety of alerting options
- Comprehensive network and infrastructure monitoring
- Suited for helpdesk integration
Why do we recommend it?
CloudRadar excels with its highly customizable interface and diverse alerting options, making it an excellent choice for NOC teams needing a comprehensive view of their network and infrastructure.
The system is customizable, so if you want to monitor hard drive space, memory utilization and CPU load, then you can set up the appropriate alarms where ever you need them. These alerts are triggered and sent via email or other channels such as Slack, so you have options.
Server monitoring capabilities include availability, uptime, CPU load, Memory Consumption, Disk Fill Levels, Network Bandwidth, Process Run Status, and more. Network monitoring options include servers, websites, routers, switches, printers and IP cameras. Web monitoring of websites and availability, website content and mail server availability.
The application has support for multiple operating system types, so Windows and Linux are both covered. In-depth server monitoring functions are available, such as detailed reports and full insight, giving you all of the information that you need to keep your systems running smoothly.
Who is it recommended for?
Best suited for larger IT departments and helpdesk teams looking for a tool that offers detailed insights into network performance and the ability to integrate with helpdesk systems.
Pros:
- Great interface – highly customizable ideal for NOC teams
- Features a variety of alerting options
- Can great alerts and forward to helpdesk systems
- Monitors a variety of networks and infrastructure metrics
Cons:
- Better suited for helpdesk teams
Critical alerts and thresholds are also available in your full insight reviews, giving you a detailed, full picture of what is happening within your environment.
Try out the free trial version here. Pricing varies from plan to plan, and you can have as few monitors active as a single monitor, or multiple monitors for many devices. You can find the pricing information right here.
121. Noction
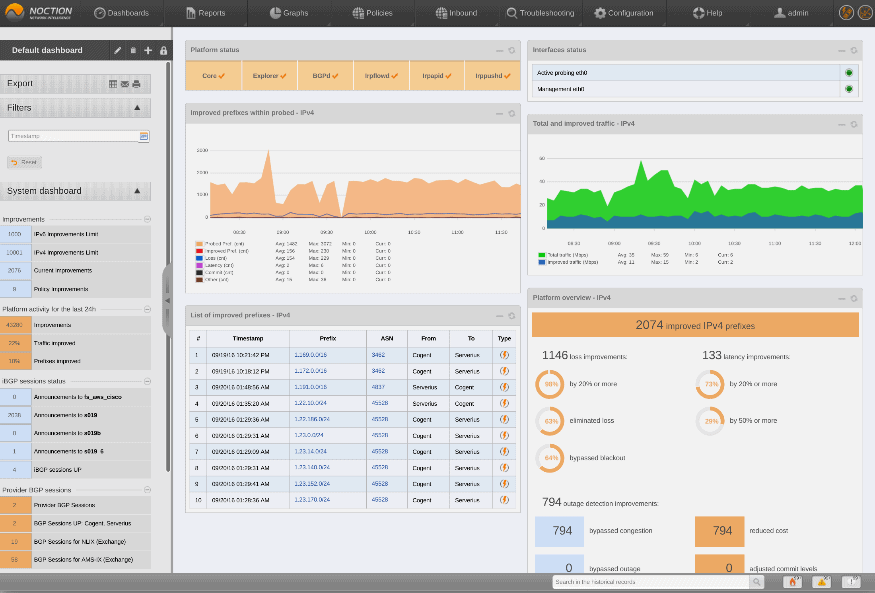
Noction’s Intelligent Routing Platform is more than just an infrastructure and network monitor. It has been designed as a way to improve the performance of your network bring down the costs of a multi-homed BGP network.
Key Features:
- Network performance optimization
- Insights from network data
- Best suited for Linux environments
- Specific Juniper templates
Why do we recommend it?
Noction is distinct in its focus on optimizing network performance, providing detailed insights from network data, and its compatibility with Linux environments, making it a valuable tool for network efficiency.
It adds intelligence-based routing decisions that make internet transmissions more efficient. Noction IRP takes advantage of the existing internet connectivity that a company already has so that it can deliver much better network performance improvements.
Noction IRP constantly probes targets over the internet for things such as packet loss, high latency, overall throughput, how reliable a target has been historically, as well as the maximum peer capacity of the device or target.
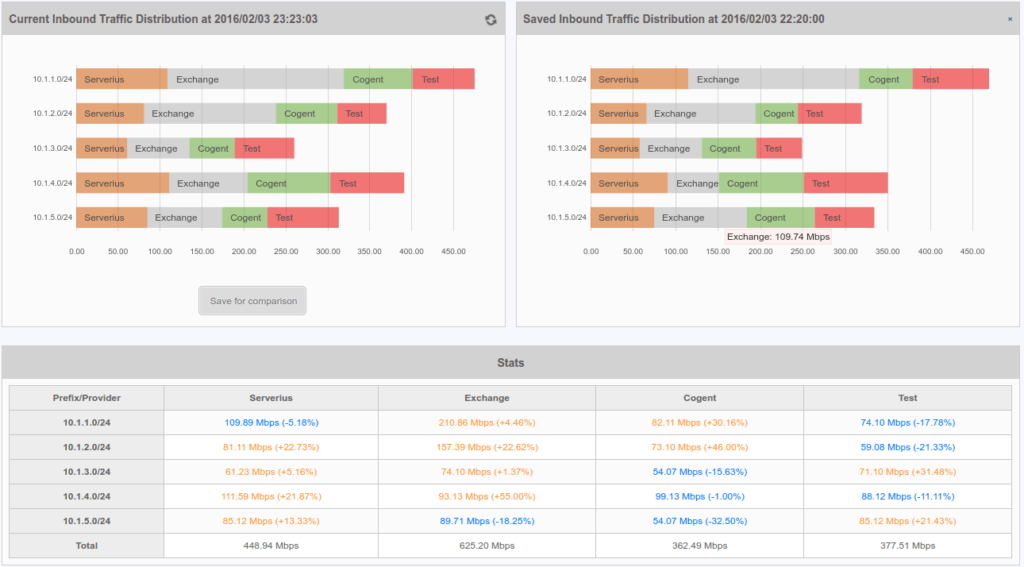
The information that is gathered through this mechanism produces a cost based route for your traffic, and then gives you the option of re-routing your traffic through a normal BGP session.
Who is it recommended for?
This tool is particularly recommended for organizations with Linux environments seeking to optimize their network performance and improve overall internet transmissions.
Pros:
- Does an excellent job at creating insights and statistics from network information gathered
- Best suited for Linux environments
- Offers Juniper-specific templates
Cons:
- Site24x7 is a feature dense platform that can take time to fully learn all of its features and customization options
This is a tool that is really good at optimizing your connections and can save you money in the long run if you find that your current BGP network solution is not operating at its best.
You can request a free demo from here. Contact Noction via sales@noction.com for pricing.
13. Zabbix
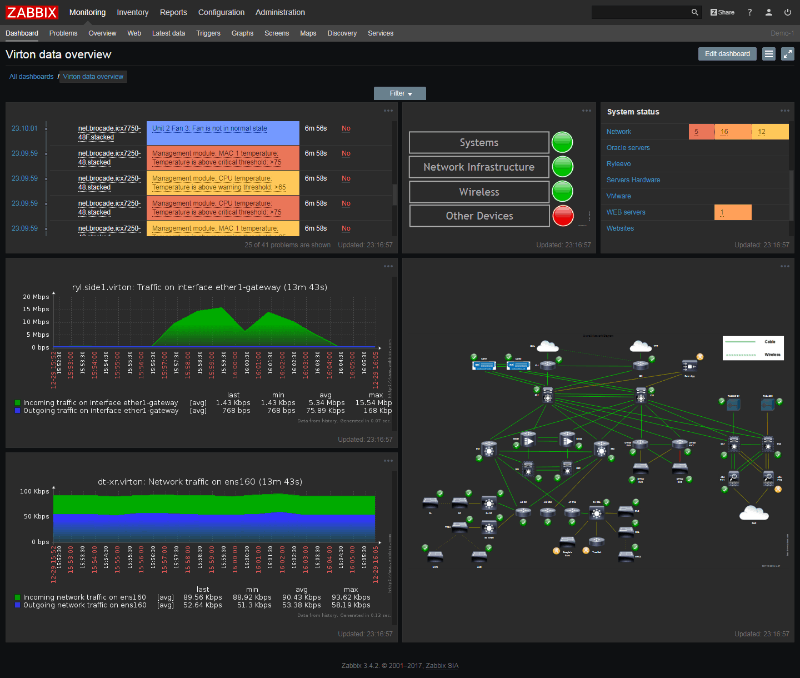
Zabbix offers a monitoring platform that is scalable and robust. It is always running, looking for changes in the network so that it can monitor and relay any changes and alerts to you. Reporting and data collection are also available, giving you a lot of information when you need to analyze faults and compile reports.
Key Features:
- Open-source network monitoring
- Immediate device and configuration detection
- Comprehensive notification system
- Fortinet monitoring template
Why do we recommend it?
Zabbix offers a robust, open-source solution for network monitoring, capable of immediate detection of devices and changes, coupled with a versatile notification system.
Zabbix has massive device support, and can continuously scan your network for thousands of devices. It runs on multiple platforms and has support for Windows and Linux agents. The agents themselves run on a combination of SNMP and IPMI technologies, which gives you the best of both worlds in the monitoring space.
The agents consume very little system resources, so you will not notice a drop in system performance once it has been installed and loaded in your environment.
Zabbix is not limited to local infrastructure monitoring. It offers support for cloud service monitoring, containers, virtual machines, software applications, services, and specific hardware. There is even database monitoring support that can assist with checking on database performance and locks.
Who is it recommended for?
Ideal for network administrators looking for a flexible, open-source monitoring tool that provides comprehensive insights and is adaptable to a wide range of network environments.
Pros:
- Open-source transparent tool
- Includes Fortinet monitoring template
- Can detect new devices and configuration changes immediately
- Robust notification system supports SMS, email, custom script, and webhook
Cons:
- Not available for Windows
If you have developers at your disposal then you can have them work on integrating the API with the system.
You can download a trial from here. Free and Opensource
14. Icinga
Icinga offers monitoring and visibility on the network, all wrapped up in an attractive UI that is lightweight and easy to use. Icinga monitors the availability and performance of your networked systems, and gives you an idea about what is happening on your network at a glance.
Key Features:
- Open-source flexibility
- Configurable via GUI or CLI
- Built-in visual reporting
- Supports Linux and Windows
Why do we recommend it?
Icinga excels with its open-source flexibility, offering a user-friendly GUI along with CLI configurability, and built-in visual reporting, making it a versatile monitoring solution.
There are customizable alerts and alarms that you can set up, giving you up to date information about what is happening on your network at any time.
The monitoring engine is the star of the show, as it runs effectively and efficiently during the course of its operation. You can monitor devices across your entire infrastructure. This gives you the power to watch any computer or device on the network, as well as applications.
The monitoring engine is able to check data centers and cloud installations. These results are stored and collected to minimize system use and to maximize resources.
Who is it recommended for?
Recommended for technical administrators who appreciate CLI tools and require a customizable, robust monitoring solution for their network and IT infrastructure.
Pros:
- Transparent open-source tool
- Can be configured via GUI or DSL, making it a good choice for admins who enjoy CLI tools
- Supports built-in visual reporting
- Modules allow for different functionality, keeping the base installation sleek and lightweight
- Can run on Linux as well as Windows operating systems
Cons:
- Reliant upon the open-source community for support and updates
- Designed for more technical users, other options have better out-of-box features
The web GUI is easy to use and is appealing on the eye, and because it is web based it performs especially well. You can customize your viewing options and group all of your systems and devices in the order that you want. This makes the viewing area very efficient and easy to use.
You can download a trial from here. Contact Icinga for a quote here.
15. ConnectWise Automate
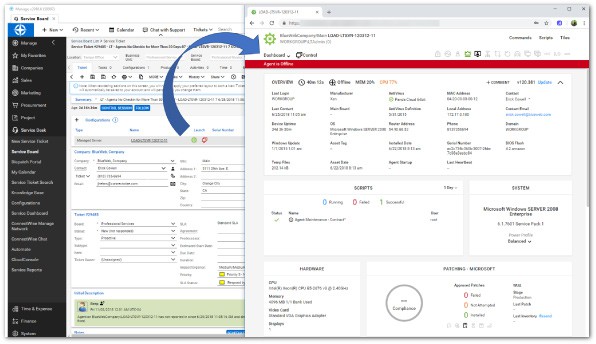
ConnectWise Automate offers a slightly different approach when looking at adding monitoring functionality to your environment. They emphasize the importance of automation in your daily tasks, especially in the administration and monitoring of your systems.
Key Features:
- Automation of repetitive tasks
- All-in-one RMM tool
- Effective for large networks
- Integrates with ConnectWise ecosystem
Why do we recommend it?
ConnectWise Automate stands out for its ability to automate routine tasks effectively, offering an all-in-one tool for remote monitoring and management, ideal for large network environments.
By using this king of methodology you can boost effectiveness and help to improve your team’s flexibility by allowing them to remotely monitor and manage key infrastructure systems. By relying on the power of automation you can speed up problem resolution and simplify the way that you can fix these issues at the same time.
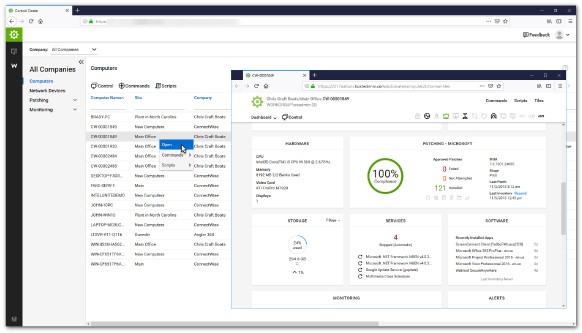
The main focus on automating tasks is so that your support staff and technicians can become more flexible and agile when trying to access device information from a simple web interface.
This means that if your team has a smart device that is web enabled then they will be able to connect to the network and have visibility about what the current state of the environment is. This is invaluable when time is of the essence, and faults need to be diagnosed and fixed quickly.
Who is it recommended for?
Best suited for larger IT departments or service providers seeking a comprehensive tool that automates network monitoring and integrates seamlessly with other ConnectWise solutions.
Pros:
- Can help NOC teams automate repetitive tasks
- Integrates well into the ConnectWise ecosystem with tools such as ConnectWise Control
- Can be used as an all-in-one tool for RMM, inventory management, and PSA
Cons:
- Designed for larger networks and multi-tenant use – not the best option for small networks
Monitor devices and network infrastructure all from a single source, and give yourself and your team a tool that will help them to stay informed about the current state of your network.
If you want to sign up for a free demo then be sure to check out the link provided here. Contact ConnectWise directly for a quote, the link can be found right here.
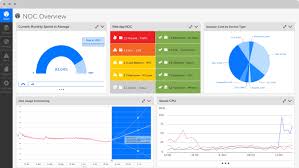
16. Logic Monitor
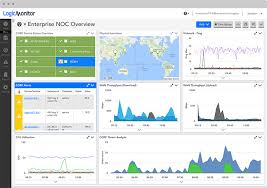
Logic Monitor is a SaaS based offering that provides monitoring services with cloud and on-prem monitoring. There are no limits to the amount af metrics that you can monitor, or to the number of users that you can set up to use the system.
Key Features:
- Cloud-based application monitoring
- Hybrid environment compatibility
- Customizable dashboards
- Suited for enterprises and MSPs
Why do we recommend it?
Logic Monitor offers a sophisticated cloud-based monitoring solution, supporting hybrid environments and featuring customizable dashboards, ideal for enterprise-level monitoring.
You even get expert help when setting up the system to start your monitoring journey. It features automated hybrid infrastructure monitoring and analytics that allow you to deploy faster, monitor more and giver your ops team far greater visibility.
LogicMonitor has achieved AWS competency certification, which means that they have shown proficiency in proven customer success in specialized solutions areas.
In this case, it relates to LogicMonitor’s monitoring and alerting offering that systems and operations members need to get their work completed with tight deadlines and SLAs.
Who is it recommended for?
Recommended for enterprises and managed service providers (MSPs) needing a powerful, scalable monitoring solution that can handle complex, hybrid IT environments.
Pros:
- Monitors application performance via the cloud
- Can monitor assets in hybrid cloud environments
- The dashboard can be customized and saved, great for different NOC teams or individual users
- Better suited for enterprises and MSPs
Cons:
- The trial is only 14 days, would like to see a longer testing period
Deployment of LogicMonitor is very easy and is installed via the Collector service application within your environment. From there, you can immediately start monitoring specific assets on your network, so that you can get a much better picture of what is happening both on your network, and in the cloud.
If you would like to see how this product performs then you can try it for free from this link over here. Find the right pricing structure here for your own specific requirements.
17. PingPlotter
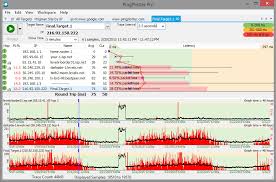
PingPlotter is an application that is used for monitoring latency and connectivity issues, and is able to show you and your team visually what is happening both on your network and on the internet.
Key Features:
- Latency and connectivity monitoring
- Visual network analysis
- Historical data collection
- Lightweight and versatile
Why do we recommend it?
PingPlotter is a unique tool that specializes in monitoring latency and connectivity, offering visual network analysis and the ability to collect historical data for comprehensive insights.
Remote sites are actively monitored by the application, and show alerts are generated when any issues are detected, such as lag and dropped packets. This is more than just a basic ping tool, as it also adds tracert capabilities and visual graphs to the offering.
This gives you a visualization tool that not only gives you good visuals on the current state of the network, but also gives alerts when anything is running out of the contextual band.
PingPlotter adds additional value by allowing you to collect historical data over long periods of time. This can help you to establish patterns in behavior, especially if you find that certain faults are occurring at specific times of the day or night, or if there is prolonged periods of outages.
Who is it recommended for?
Ideal for network technicians and end-users who need a straightforward, user-friendly tool for diagnosing connectivity and latency issues across networks.
Pros:
- Three options including a freeware version
- Offers lightweight visualization into latency across devices
- Good for both one-off tests as well as continuous testing
Cons:
- Could benefit from a longer trial period
- TCP and UDP tests are not included in the free version
PingPlotter is a good tool for both technical staff and end users, it is easy to use and easy to set up, and also provides access through it’s web API, which means that all you need is a browser in order to see it work.
Try it for free for 14 days from here. The Standard License starts at $39,99 while the Pro License starts at $349. More pricing info can be found here.
18. Cacti
Cacti has been around for a very long time. It is a complete network graphing tool that was designed to use RRDTools’s data storage and graphing capabilities. Cacti uses a fast polling solution and advanced graph templating. It uses multiple data acquisition methods as well, so you are not stuck with a single source of data input for your metric s and historical data. Cacti is written in PHP, so the front end is really stable and responsive.
Key Features:
- Advanced data visualization
- Large community support
- User management tools
- Ideal for data researchers
Why do we recommend it?
Cacti excels in data visualization for network monitoring, supported by a large community. Its user management tools and flexibility make it a strong choice for in-depth network analysis.
If you need to create traffic graphs with MRTG then there is also SNMP support on hand.
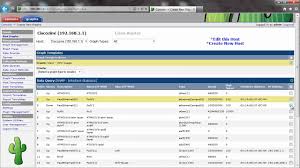
Cacti has a built-in user management tool so you can make sure that only the right people have access to certain information. You can delegate administrative tasks such a suser creation to other users, or you can restrict specific functions within the application. This makes it a good tool for using throughout a department or company if multiple users need to use it to view different data points and sources.
Who is it recommended for?
Recommended for IT professionals and researchers who require detailed network data visualization and prefer a tool supported by a large, active community.
Pros:
- Highly customizable monitor with a focus on data visualization
- Large dedicated community of over 20,000 members
- Simple interface
- Ideal for researchers looking for more flexibility in their data collection
Cons:
- Has a steeper learning curve than competing product
Cacti also offer good templating functionality so you can save your specific setup, saving you time in the long run in you ever have to recreate your setup in a different area of the business without having to start from scratch. Cacti is Linux based and can be downloaded from the link below.
Download here. Free and open source
19. GFI LanGuard
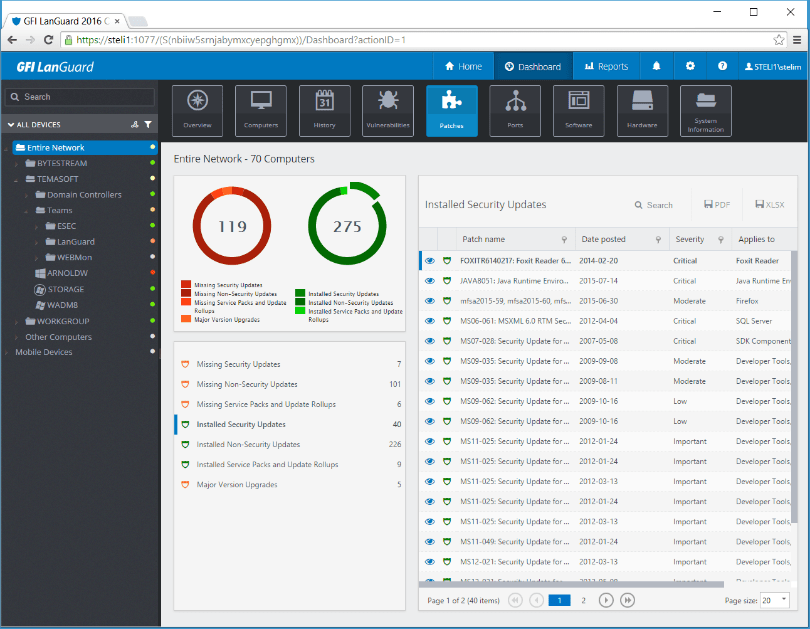
GFI LanGuard acts a virtual security consultant offering. It allows users to take advantage of network and software auditing, as well as vulnerability scanning for both mobile devices and computers.
Key Features:
- Multi-platform patch management
- Vulnerability scanning
- Network and software auditing
- Simple interface
Why do we recommend it?
GFI LanGuard offers a focused approach on network security, excelling in patch management and vulnerability scanning across multiple platforms, providing a secure monitoring environment.
Patch management is also available for Windows, Mac OS and Linux. This monitoring tool is a little limited in its scope as it focuses on the patch state of the computers on your network, but this is a critical issue to monitor if you have larger environments with many computers, servers and laptops to look after.
Software issues are easily managed from GFI LanGuard, allowing you to quickly fix problems as they come up. This frees up your support staff and lets them get on with other important tasks around the organization as issues are quickly detected and fixed via the main console of GFI LanGuard.
Who is it recommended for?
Ideal for IT security teams in larger environments who need a robust tool for monitoring network security, particularly in managing and auditing software patches and vulnerabilities.
Pros:
- Multi-platform support for Microsoft, Linux, and Mac
- Includes support for patching other popular third-party applications like Adobe, Java, and Runtime
- Simple, yet effective interface
- Built-in vulnerabilities assessment uses patch information to help gauge risk for security teams
Cons:
- Would like to see more features for scheduling patches
The combination of software, vulnerability and network scanning that this application does makes it a specialized tool that you might find useful in your environment.
Download the free LanGuard trial from here. Find a reseller in your region from here.
20. OpenNMS
OpenNMS was designed from the ground up as a carrier grade, highly integrated opensource platform that is used for building network monitoring solutions within companies. There are two distinct flavors of OpenNMS:
- Meridian and
- Horizon
Meridian is seen largely as the enterprise or business solution, which encourages larger deployments with more targets to communicate with. There is also long term support included with the package.
Key Features:
- Open-source, carrier-grade solution
- Customizable alert notifications
- Two versions: Meridian and Horizon
- Extensive monitoring options
Why do we recommend it?
OpenNMS provides a high-grade, open-source monitoring solution with extensive customization capabilities, including two distinct versions for enterprise (Meridian) and innovative (Horizon) applications.
Horizon versions of OpenNMS are where a lot of innovation happens quickly, with test features and experimental builds available for testing purposes. You can receive email notifications, slack and Matter most teams via outbound web-hook integration.
Jabber and XMPP are also direct messenger clients that you can receive notifications through. External scripts are also executable through the platform.
Who is it recommended for?
Recommended for large-scale organizations and carriers seeking a flexible, open-source platform that can be tailored to complex monitoring needs and rapid innovation.
Pros:
- Open source projects, lots of room for customization, and personalized add-ons
- Has a large amount of documentation available
- Features two versions, a stable version and a beta test version for new features
- Offers a wide range of monitoring options and flexible alert notifications
Cons:
- Users rely on help documents and forums for support, which isn’t always the quickest way to resolve issues
You can integrate ticketing and tracker integration, BMC Remedy Integration, OTRS integration, IBM Tivoli Service Request Manager and more. There is also alarm forwarding for critical alerts, as well as southbound integration.
Live demos are available here. This is an opensource product with enterprise support as an option.
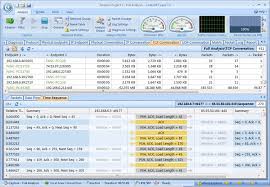
21. Capsa Free
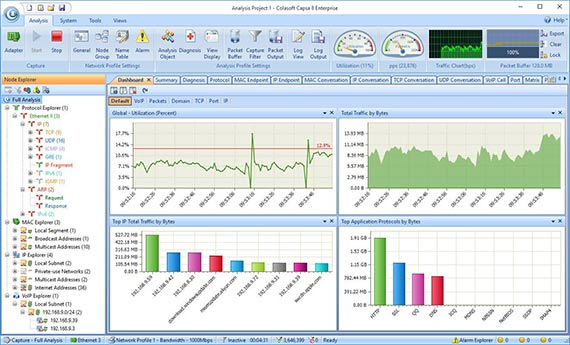
Capsa is a portable network analyzer that is also freeware. It is primarily used over the LAN and is great for diagnosing and troubleshooting local faults on the network.
Key Features:
- Portable network analysis
- Ethernet monitoring focus
- Extensive protocol support
- VoIP performance analysis
Why do we recommend it?
Capsa Free offers a convenient and portable solution for network analysis, particularly focused on ethernet monitoring, making it effective for troubleshooting and analyzing network performance.
Ethernet is the primary monitoring that you can expect to perform with this application, so you can expect quite a bit of network information to become available once you start using the application.
Features include: Adapter monitors and manual save files. The Standard and Enterprise versions of the application include WiFi connections, IP address monitoring, session timeout lengths, online auto updaters, multiple project execution, network TAP, printing, data export, and much more.
Who is it recommended for?
Best suited for network technicians and administrators who need a portable, detailed tool for diagnosing and analyzing local network issues, especially in ethernet environments.
Pros:
- Supports over 1800 protocols for monitoring
- Offers analysis for VoIP performance problems
- Insights automatically highlight potential attacks and abnormalities
Cons:
- The interface can feel cluttered, especially when monitoring larger networks
If you want to sample this application then you can download the free version from here. Standard and Enterprise versions can be downloaded from here and here respectively. The free version is a stripped down version and therefore does not cost anything, however the Standard license is $295 and the Enterprise license is $995.
22. Pandora FMS
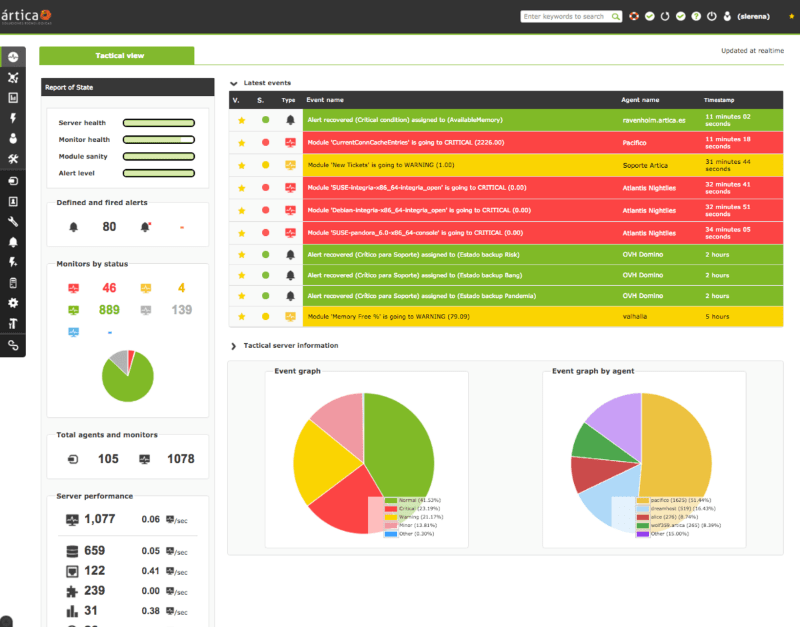
Pandora FMS is another Opensource monitoring solution that is available in both free and enterprise versions. Monitoring capabilities are aimed primarily at IT infrastructure management as it is geared towards the enterprise environment.
Key Features:
- IT infrastructure management
- Extensive SNMP support
- Network discovery and mapping
- Open-source with a paid version
Why do we recommend it?
Pandora FMS is a versatile tool for IT infrastructure management, offering extensive support for SNMP, network discovery, and mapping, suitable for diverse enterprise monitoring needs.
It is able to monitor network equipment, Windows computers and servers, Unix servers, virtual machines and a whole range of applications that you can specify during the installation process.
As with most enterprise products you will find that there are certain features that you use, and some that you don’t.
Due to the flexible nature of PandoraFMS, you will not find many applications and services that it is not compatible with, so the chances of installing this monitoring suite successfully is quite good.
PandoraFMS lets you measure performance and availability with events, graphs, SLAs, full reports and more.
On the networking end of things there is also SNMP v3 support, SNMP trap monitoring, WMI support, Remote Plugin Execution and Network discovery. If you want to create network maps then this app will let you do that as well.
Who is it recommended for?
Recommended for enterprise IT teams needing a comprehensive, open-source monitoring solution that can manage a wide range of network equipment and applications.
Pros:
- Works alongside Pandora NMS for additional address management functionality
- Supports patch management, making it a more complete tool than other managers
- Can group LANs with other non-VPN WANs into a single group for easier management
- Open-source with paid version
Cons:
- Outdated interface, visualizations are lacking and nested menus can be overwhelming at scale
You can download the open-source version here, and the enterprise version from here. €3,750 or $4200 USD for the Enterprise Version per Year!
Conclusion
As we have seen, there are many different monitoring solutions out there.
Whatever your requirements are, there is an application out there that has been designed to meet your requirements. There are plenty of things to consider when selecting your next network monitoring solution.
Everyone has their own favorite solution that they deem to be the best solution for their own network and enterprise, so the decision will ultimately rest with you if you are looking to install something similar to what we have looked at today.
Network Monitoring Software FAQs
What types of devices can be monitored with a network monitoring tool?
A network monitoring tool can be used to monitor a variety of devices, including servers, switches, routers, firewalls, and other network devices.
What types of information can be collected by a network monitoring tool?
A network monitoring tool can collect information about network traffic, device performance, network latency, packet loss, and other metrics related to network performance.
How can a network monitoring tool help me optimize network performance?
A network monitoring tool can help you optimize network performance by identifying areas of congestion, recommending optimal network configurations, and providing insights into network traffic patterns.
Can network monitoring be automated?
Yes, network monitoring can be automated using tools that automate monitoring and alerting processes.
What are some best practices for network monitoring?
Best practices for network monitoring include establishing a monitoring plan, using a centralized monitoring platform, setting up alerts and notifications, performing regular maintenance and updates, and analyzing data to identify trends and potential issues.
What are some common network monitoring tools?
Common network monitoring tools include SolarWinds, Nagios, PRTG, Wireshark, and Zabbix.


