
Server Monitoring Software is an essential tool for system administrators, as it allows for automated reporting, scheduled checks and pre-emptive warnings about the health of your many servers within your operating environment.
Here is our list of the top server monitoring software:
- NinjaOne – FREE TRIAL – formerly NinjaRMM – a remote monitoring and management system that enables technicians to monitor the endpoints and other assets of client companies. This is a cloud-based platform.
- Site24x7 Server Monitoring – FREE TRIAL A cloud-based monitoring system that can track the statuses of Windows and Linux servers as part of a company’s infrastructure.
- ManageEngine OpManager – FREE TRIAL A package of network and server monitors that tracks the performance of system hardware. Available for Windows Server and Linux.
- ManageEngine Applications Manager – FREE TRIAL A server and applications monitoring system that includes extra capabilities such as VM monitoring. Runs on Windows Server and Linux.
- Atera – FREE TRIAL A remote monitoring and management system that includes server monitoring features. Ideal for managed service providers.
- Paessler PRTG – FREE TRIAL A package of monitors that includes a range of server status trackers. Installs on Windows Server.
- AppOptics A cloud-based server and applications monitoring system that will track the performance of Windows and Linux servers.
- SolarWinds Server & Application Monitor Tracks the statuses of key server components and also watches the performance of applications running on each server. The tool runs on Windows Server but can also monitor Linux servers across a network.
- Nagios XI A comprehensive infrastructure monitoring system that includes live server monitoring services. Installs on Linux.
- Opsview A system monitoring tool that includes sever monitoring and is billed as an alternative to Nagios XI. Runs on Linux.
- Zenoss A system monitoring tool that includes a server monitoring module and is also available in a free version. Installs on Linux.
- OP5 Monitor Server monitoring as part of a system-wide monitor tool that accepts Nagios plug-ins. Install on Linux.
- ManageEngine Free Windows Admin Tools A collection of 15 free tools that cover different aspects of server monitoring including disk space, software inventory, and user lists.
Server Monitoring Software is able to check everything about your system, such as:
- CPU usage
- RAM utilization
- Hard Disk Space
- System Temperatures
- Server Alerts (Hardware status warnings)
- RAID Array health checks
- Virtual Machine Alerts
You can also monitor user logins, suspicious activity on your server, and the status of your services and daemons.
There are multiple layers of technology at work inside these software suites, and some of the most common protocols that we will be mentioning today are:
- SNMP (Simple Network Monitoring Protocol)
- WMI (Windows Management Instrumentation)
- ICMP (Ping)
- PerfMon (Microsoft Windows Performance Monitor)
Depending on the software that you use, there could be any number of the aforementioned protocols within the monitoring application, depending on what the application monitors, and what environment it runs in.
The Best Server Monitoring Tools
We will now take a brief look at 13 of the most popular tools that are currently available, including free, paid, and open source tools and software.
Each has its own approach to solving the problem of trying to help monitor your system, and as such, some will be more suited to specific tasks than to others.
This can be a little confusing, so we will do our best to help you to understand which program could work best for your needs.
Our methodology for selecting the best server monitoring tools:
We've broken down our analysis for you based on these key criteria:
- Capability to monitor a wide range of server metrics such as CPU usage, RAM utilization, disk space, system temperatures, and server alerts.
- Effectiveness in providing preemptive warnings and scheduled checks for maintaining server health.
- Integration with common monitoring protocols like SNMP, WMI, ICMP, and PerfMon, ensuring comprehensive coverage.
- Ability to monitor specific aspects like RAID array health, virtual machine alerts, and user activity, including logins and suspicious activities.
- Suitability for different operating environments and adaptability to various server configurations and needs.
1. NinjaOne – FREE TRIAL
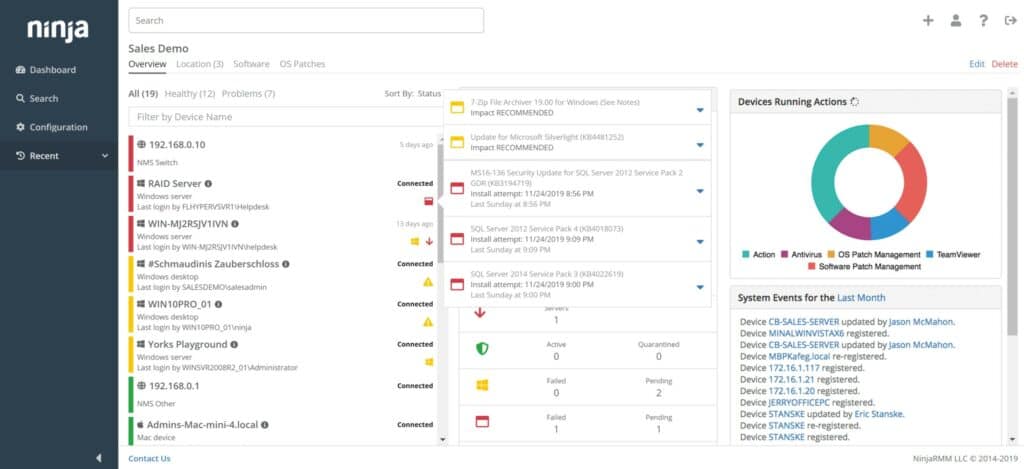
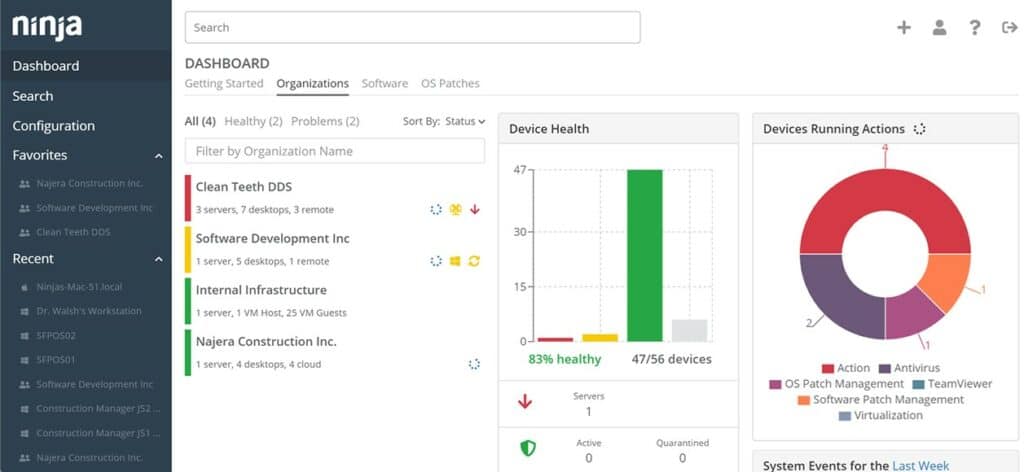
NinjaOne, formerly NinjaRMM, is a platform of tools that enable technicians to run the IT systems of companies. The system is useful for managed service provides (MSPs) and the IT operations departments of multi-site organizations. In terms of industry commendations, NinjaOne's unbroken streak on G2 stands out.
This is a cloud-based service and so there is no need to install any software in order to use the system. Technicians access the service’s dashboard through any standard Web browser. As an IT asset management package, this platform includes processes for maintaining and monitoring endpoints.
The monitoring service of the platform looks at the resource usage on endpoints and will raise an alert if one of those resources passes an acceptable level of usage. This threshold system buys technicians time to head off disaster before users notice performance problems.
Key Features:
- Discovery of all endpoints connected to a given network
- Constant scans of software inventories
- Device identifiers and service life tracking
- Endpoint activity logging
- Endpoint availability monitoring
Feature distinction
It comes with 100+ pre-built monitoring templates to quickly notify you when there are changes to a server's health or performance.
Why do we recommend it?
NinjaOne is commended for its integrated platform that offers extensive IT management capabilities, including server monitoring, asset management, and remote troubleshooting. Its customizable interface and support for over 120 integrations make it a versatile choice.
Management features in this package include a software inventory compilation system that is constantly updated. This also notes the operating system of each device and the version of all installed packages. This inventory links through to an automated patch manager.
The dashboard for the system allows one technician to monitor and manage several sites and/or clients simultaneously.
Who is it recommended for?
This platform is best suited for large enterprises and managed service providers who need a comprehensive tool to monitor and manage multiple clients and sites simultaneously.
Pros:
- Supports over 120 integrations making it a solid option for already-established organizations
- The interface can be customized to both monitor clients as well as manage device inventory
- Builtin remote access with remote commands allow technicians to troubleshoot without initiating a session
- Supports custom scripts that can be deployed to multiple clients
Cons:
- Offers many features for large enterprises and MSP – not the best fit for small networks
Contact the NinjaOne Sales Department to request a quote. Get a 14-day free trial.
2. Site24x7 – FREE TRIAL
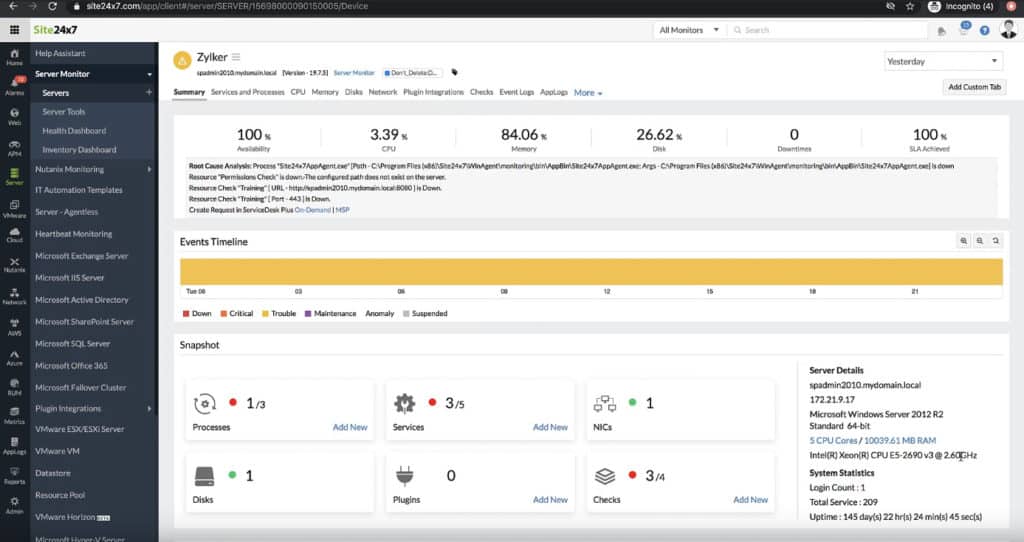
Site24x7 is a server monitoring tool that helps you stay on top of Downtime and get to the bottom of server issues and problems quickly and efficiently.
Key Features:
- Monitors multiple platforms
- Real-time device discovery
- User-friendly interface
- Bridges technical and business metrics
Feature distinction
It also comes with 100+ plugin integrations to suit multiple applications in your tech stack.
Why do we recommend it?
Site24x7 is recommended for its holistic approach to monitoring, supporting various platforms like Windows, Linux, AWS, Docker, and Azure. Its user-friendly interface and real-time data usage for device discovery and reporting are notable features.
Site24x7 gives you the flexibility of monitoring Windows, Linux, FreeBSD, OsX, Vmware, AWS, Docker, Google Cloud (GCP), Azure and many other cloud hosted platforms and applications.
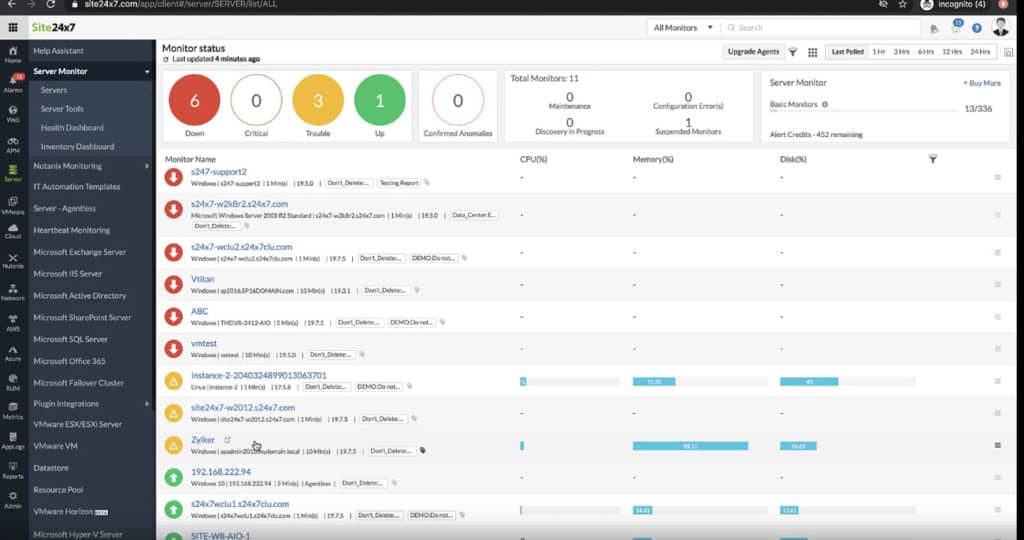
Site24x7 monitors and helps you manage your remote and local servers from a centralized location and gives you the ability to really understand whats happening in your networks and server farms.
Who is it recommended for?
This tool is ideal for organizations that require a comprehensive monitoring solution that is easy to use and supports a wide range of network, infrastructure, and user monitoring capabilities.
Pros:
- One of the most holistic monitoring tools available, supporting networks, infrastructure, and real user monitoring in a single platform
- Uses real-time data to discover devices and build charts, network maps, and inventory reports
- Is one of the most user-friendly network monitoring tools available
- User monitoring can help bridge the gap between technical issues, user behavior, and business metrics
- Supports a freeware version for testing
Cons:
- Is a very detailed platform that will require time to fully learn all of its features and options
Get Started with a 30-day free trial.
3. ManageEngine OpManager – FREE TRIAL
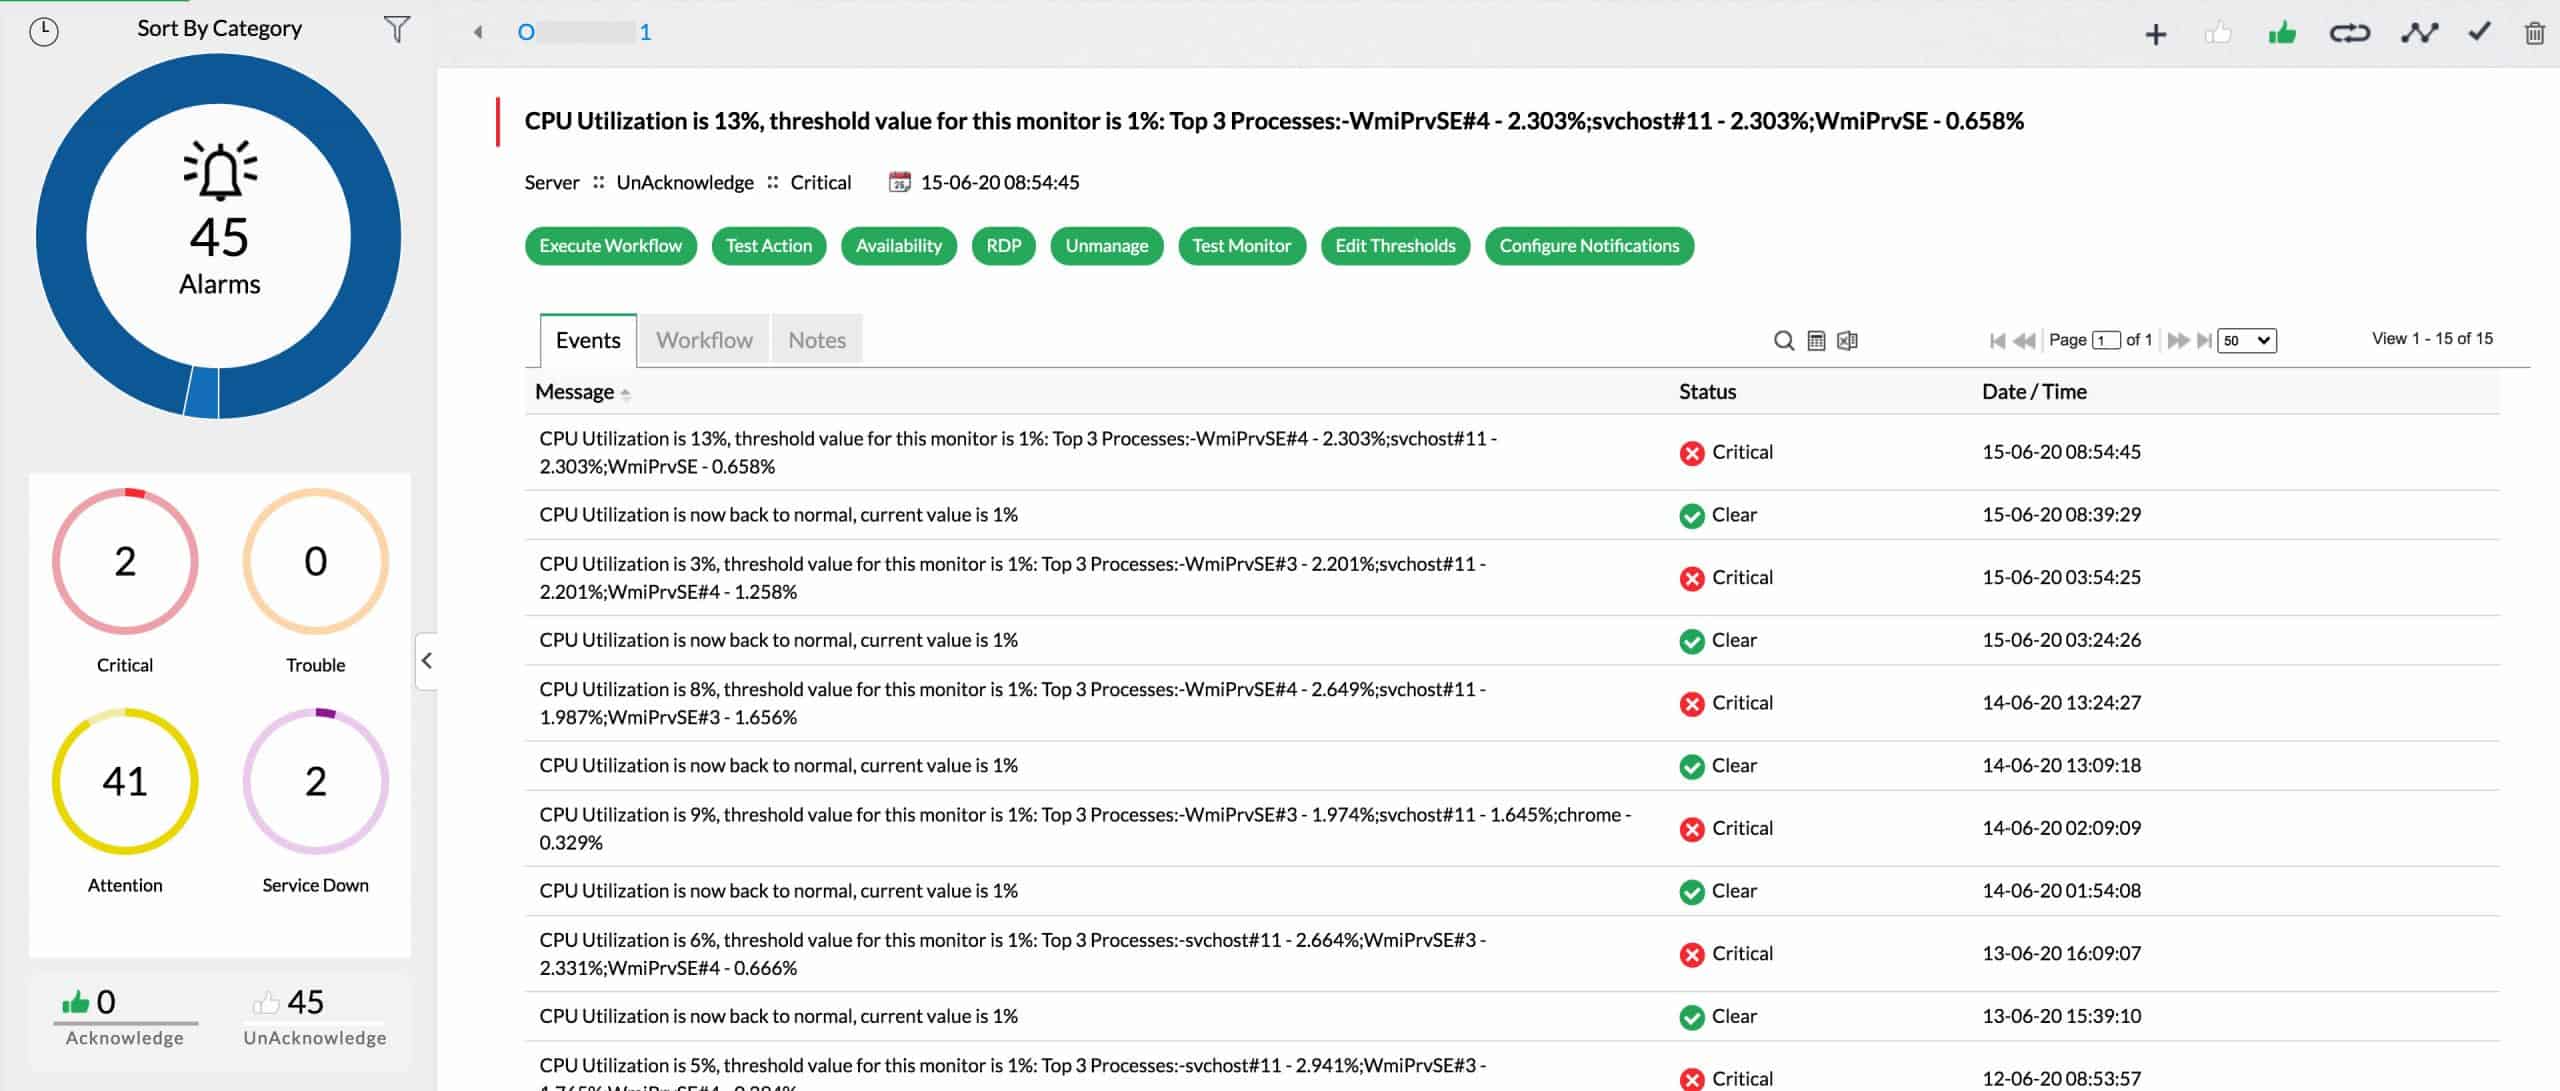
ManageEngine OpManager covers all of the major hardware on your system. It polls network devices for status reports and it also tracks the resource usage of servers.
These tools cover a lot of the tasks that IT operations staff need to perform in order to keep the system running smoothly. OpManager raises alerts of performance drops below an expected standard or if resources run low. These alerts can be forwarded as notifications by email or SMS. So, data center staff can leave the monitoring of regular operations to OpManager, knowing that they will be called in if problems arise.
The server monitor covers all of the major resources of a server, such as CPU, memory, and storage space. As well as watching those physical systems, the OpManager monitor will track the activities of virtual infrastructure.
Key Features:
- Server resource monitoring
- Network device performance tracking
- Virtual system management
- Resource shortage alerts
- Issue notification by email and SMS
- Log management
Feature distinction
When any server goes down, OpManager immediately notifies relevant users via text or email.
Why do we recommend it?
ManageEngine OpManager is recommended for its in-depth server resource monitoring, network device performance tracking, and virtual system management capabilities. Its automated alerting system and customizable widgets for dashboards and reports make it a versatile tool for IT operations.
OpManager is able to identify virtualizations and, given access credentials, it will identify each virtual server and map its infrastructure through to its dependent virtual machines. The monitor rescans the server periodically and updates its records if there are any changes in the virtual infrastructure. OpManager is able to monitor virtualizations from VMWare, Hyper-V, Citrix, and Nutanix.
Who is it recommended for?
OpManager is suitable for businesses requiring a tool that can instantly identify and monitor new devices, reduce false alerts, and integrate well with other ManageEngine products, especially beneficial for larger networks.
Pros:
- Designed to work right away, features over 200 customizable widgets to build unique dashboards and reports
- Leverages autodiscover to find, inventory, and map new devices
- Uses intelligent alerting to reduce false positives and eliminate alert fatigue across larger networks
- Supports email, SMS, and webhook for numerous alerting channels
- Integrates well in the ManageEngine ecosystem with their other products
Cons:
- Is a feature-rich tool that will require a time investment to properly learn
OpManager is packaged in four editions:
- Free for up to three devices — $0
- Standard starting at a price to monitor 10 devices — $245
- Professional starting at a price to monitor 10 devices — $345
- Enterprise starting at a price to monitor 250 devices — $11,545
ManageEngine OpManager installs on Windows Server and Linux. You can get the package on a 30-day free trial.
4. ManageEngine Applications Manager – FREE TRIAL
Server Monitoring Tool is an application that runs from a single source on your network, meaning that you don’t have to install an end point agent onto the servers that you wish to monitor.
This is great news if you monitor many different servers in your operating environment.
Key Features:
- Performance monitoring
- Database monitoring
- Synthetic Application Monitoring
- Customizable Dashboards and reporting
- KPI tracking and trends analysis
Feature distinction
Install, configure, and deploy within minutes so you can start monitoring right away.
Why do we recommend it?
Applications Manager is recommended for its comprehensive monitoring capabilities that include performance, database, and application monitoring. Its customizable dashboards and trend analysis tools provide a holistic view of network health, which is vital for proactive management.
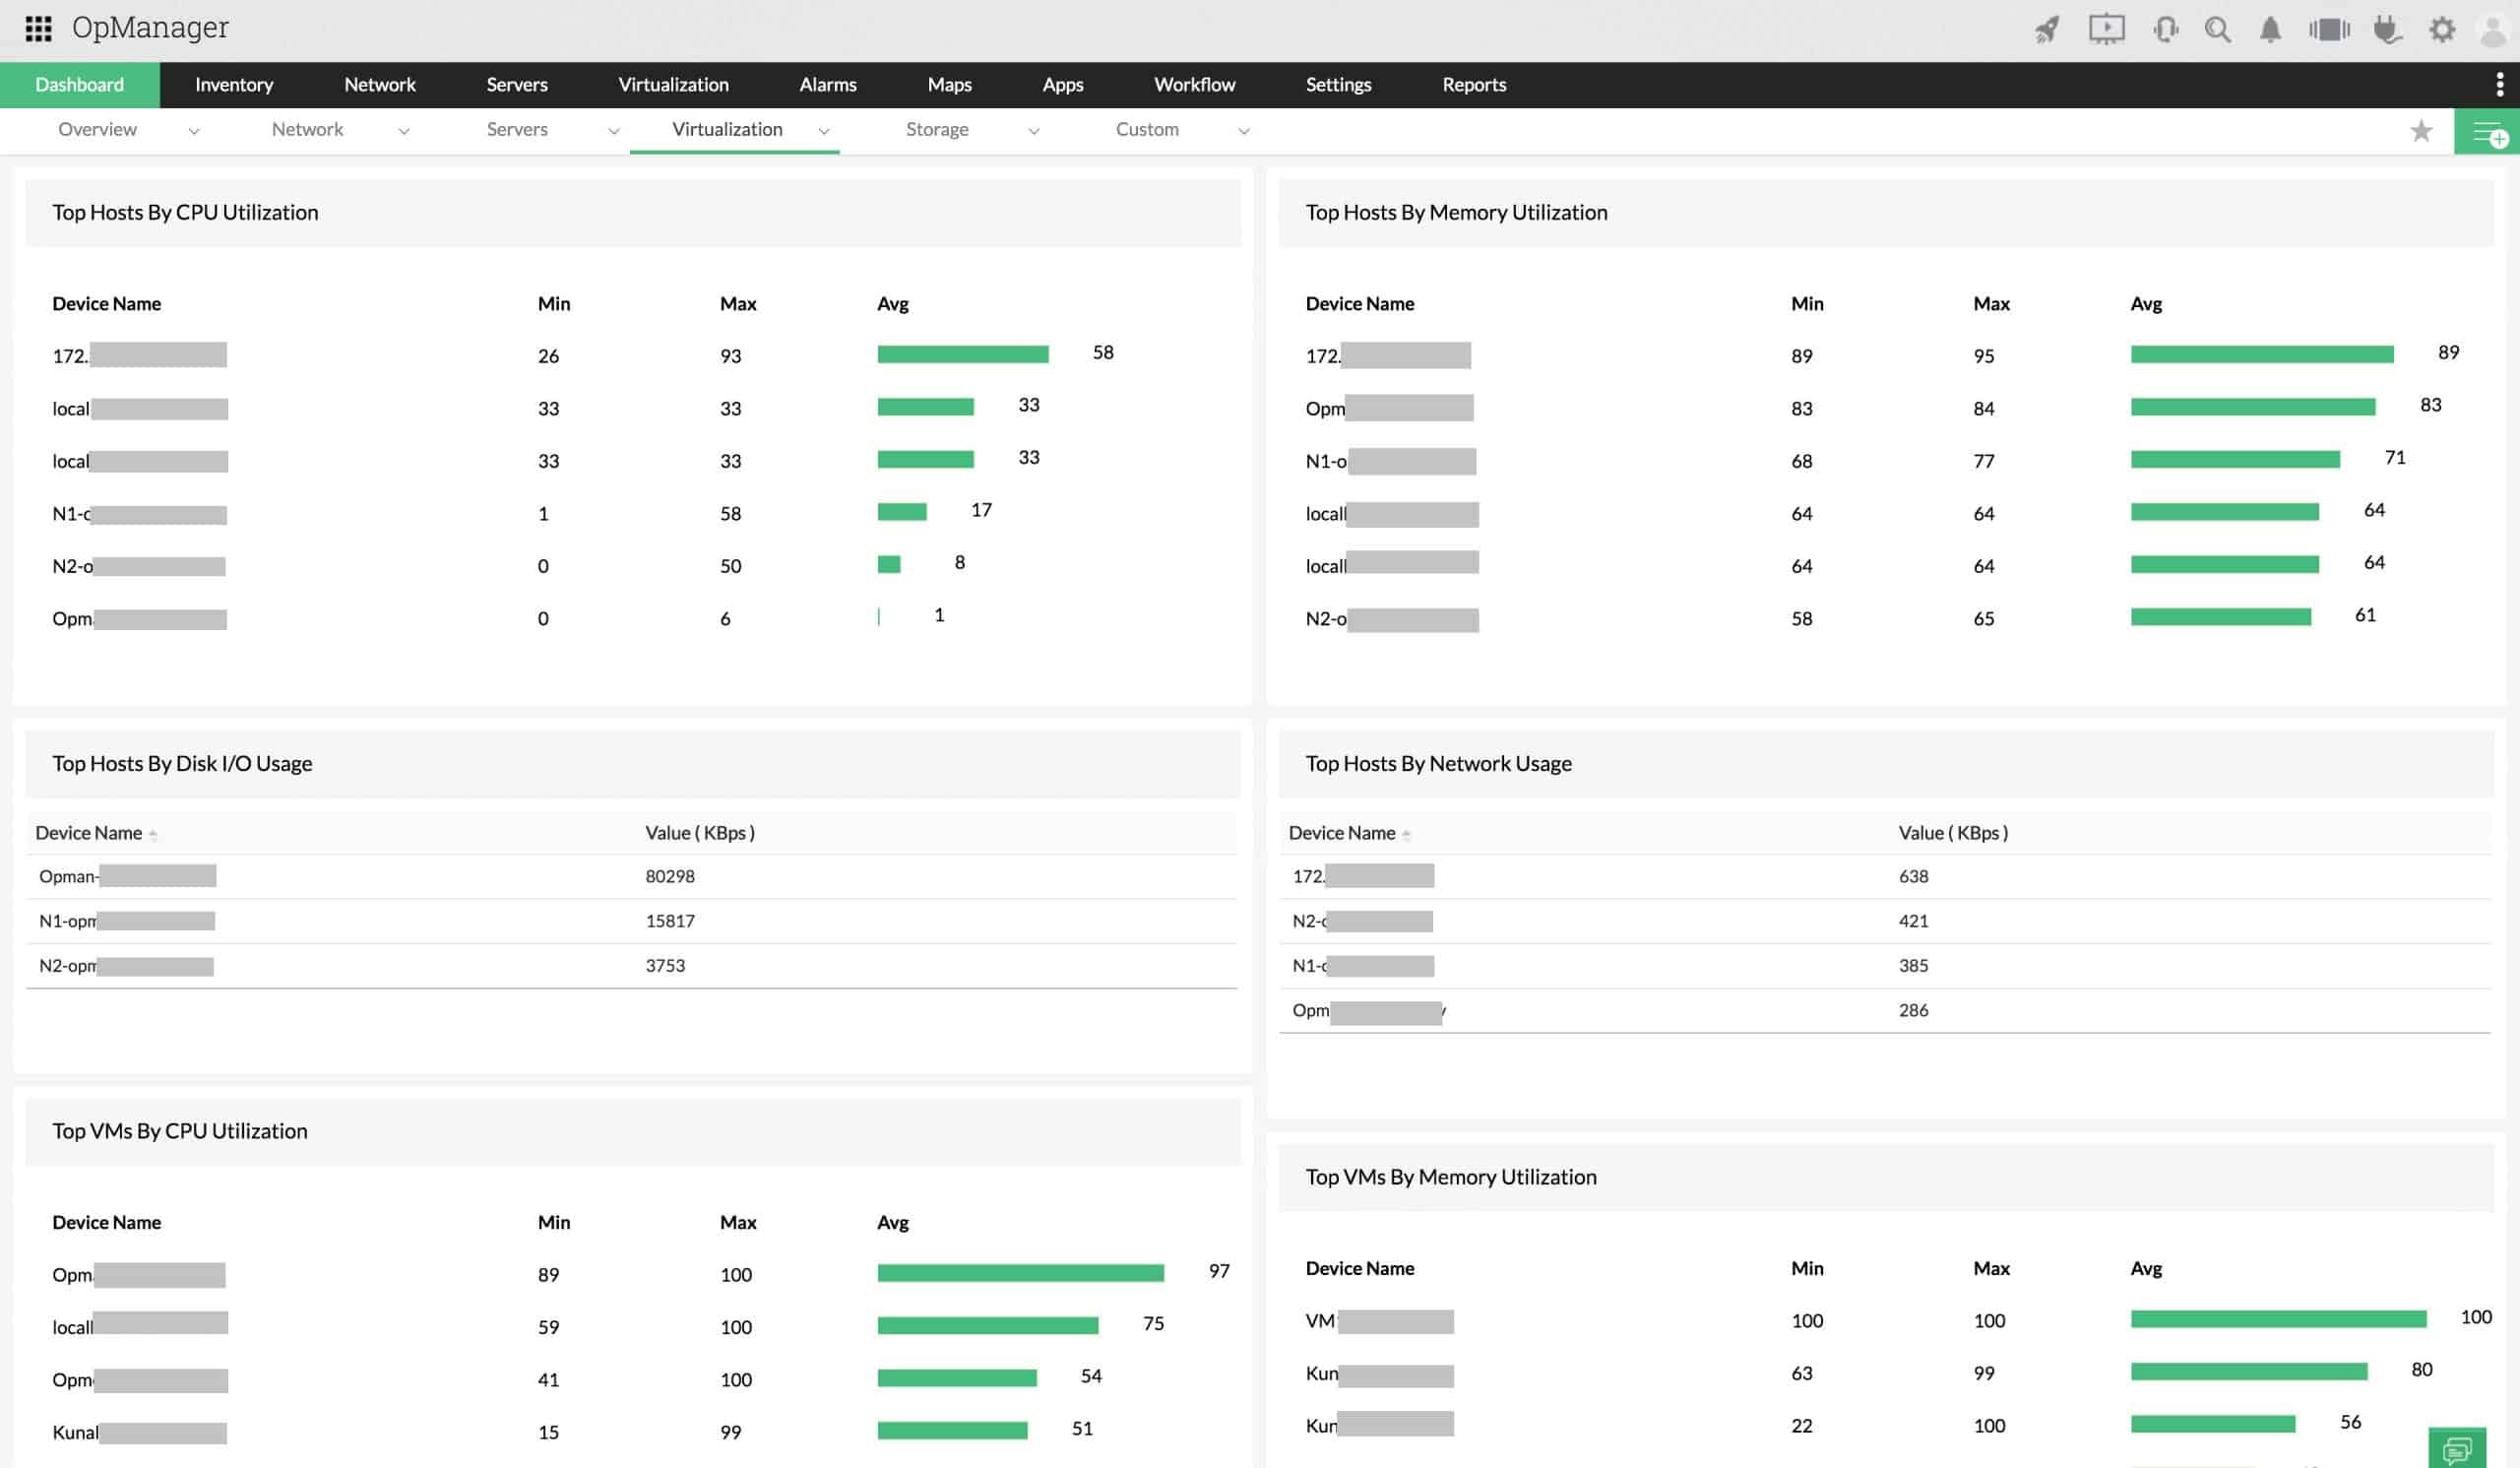
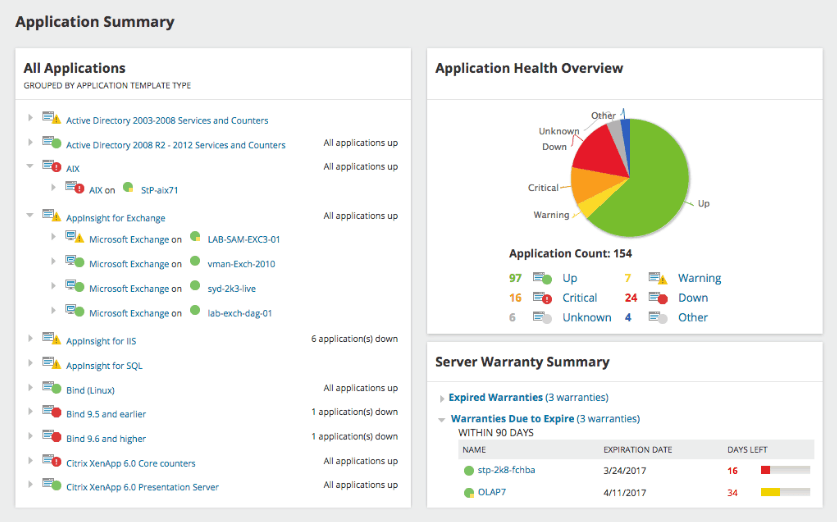
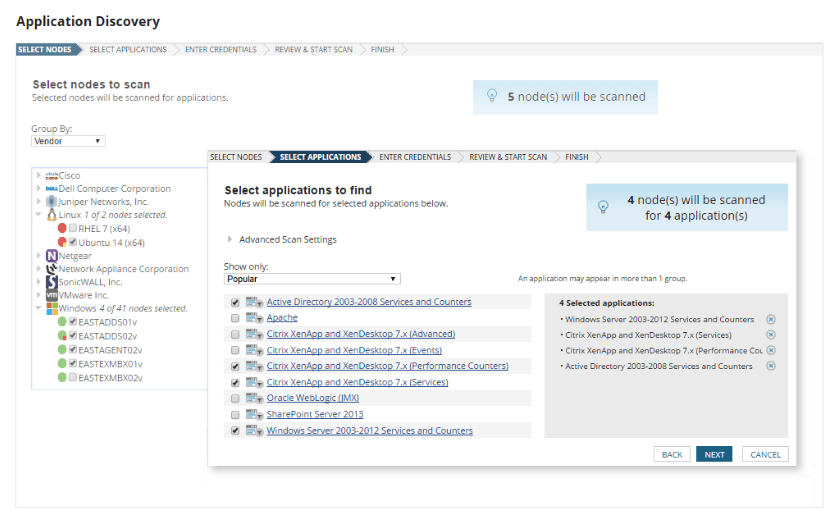
The Applications Manager enables system administrators to take a proactive approach to monitoring physical, virtual, and cloud environments, all from a single point. From this single location, users are able to check uptime reports, system availability, and much more. Applications can be monitored individually, or entire servers.
This is especially useful for web servers and other high availability machines that cannot afford any downtime. Automated notifications can be setup to inform your IT team of any problems that arise.
This is an excellent application and web-server monitoring tool, and will allow your team to quickly identify any issues that come up within your environment. For large environments, the trending and graph services are a great help and will increase issue visibility on your network.
Who is it recommended for?
This tool is ideal for large enterprises looking for an on-premise or cloud deployment option that offers insights into application interdependencies and real-time asset management.
Pros:
- Offers on-premise and cloud deployment options, giving companies more choices for install
- Can highlight interdependencies between applications to map out how performance issues can impact businesses operations
- Offers log monitoring to track metrics like memory usage, disk IO, and cache status, providing a holistic view into your network health
- Can automatically detect databases, server hardware, and devices for real-time asset management
Cons:
- Can take time to fully explore all features and options available
Contact for pricing and a 30-day free trial for either Windows or Linux.
5. Atera – FREE TRIAL

Atera is a SaaS package that is aimed at managed service providers (MSPs) but could also be used by central IT departments that manage multiple remote sites. The remote monitoring and management (RMM) software in the bundle includes full system monitoring capabilities that cover networks, servers, and applications. The monitoring system includes an autodiscovery feature, so it will track down all of your servers and show how they are connected to your network.
Server details covered by the monitor include resource utilization, logged-in users, Active Directory accounts and permissions, OS versions, software inventory, application activity, and virtualization configurations.
Feature distinction
It converts the entire troubleshooting process from a reactive to a proactive one.
Key Features:
- Server hardware monitoring
- Application monitoring
- Device discovery
- All-in-one solution
- Remote management utilities
Why do we recommend it?
Atera is recommended for its all-in-one monitoring solution that combines server hardware and application monitoring with device discovery and remote management utilities. Its performance alert strategy is particularly effective for managing multiple servers.
The Atera system monitoring service works on a performance alert strategy. This allows technicians to manage several servers at once because they will be notified if acceptable performance thresholds get breached on a server.
Atera is charged on a monthly subscription. The software package offers all of the tools that an MSP would need, including the professional services automation (PSA) tools that the MSP needs in order to run the business and manage technicians and clients. The rate for the service is set per technician, and it is effprtless to add on and remove seats.
Who is it recommended for?
This tool is best suited for managed service providers (MSPs) and central IT departments managing multiple remote sites, offering a comprehensive set of tools including RMM and PSA.
Pros:
- Lightweight cloud-based tool
- Built with MSPs in mind, and includes RMM and PSA tools built-in
- Can carry out automation as a service for clients (multi-tenant)
- Comes with a library of scripts making it easy to get started right away
Cons:
- Smaller organizations may not use multi-tenant features
Pro: $129 per month, Growth: $179 per month, Power: $209 per month
Start a 30-day free trial.
6. Paessler PRTG – FREE TRIAL
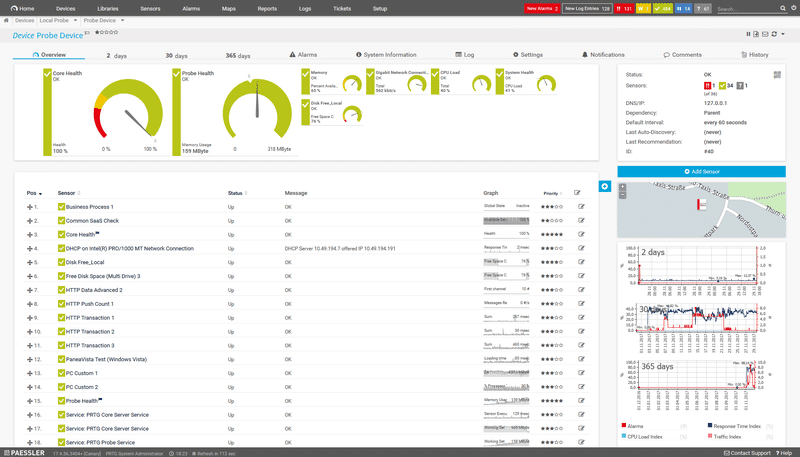
Paessler PRTG is an integrated solution that is suitable for small environments, right up to large data centers and server farms.
Key Features:
- Flexible Alert methods
- Multiple user interfaces to choose from
- Fail-over Tolerant Monitoring
- Customizable maps and dashboards
- Distributed monitoring
Feature distinction
A highlight of this tool is its flexibility, as you can easily add more monitors to oversee specific parameters of servers.
Why do we recommend it?
Paessler PRTG is recommended for its dynamic and integrated monitoring capabilities suitable for various sizes of environments. Its ability to monitor all IT-related resources and customizable alerting system makes it a robust choice for comprehensive IT monitoring.
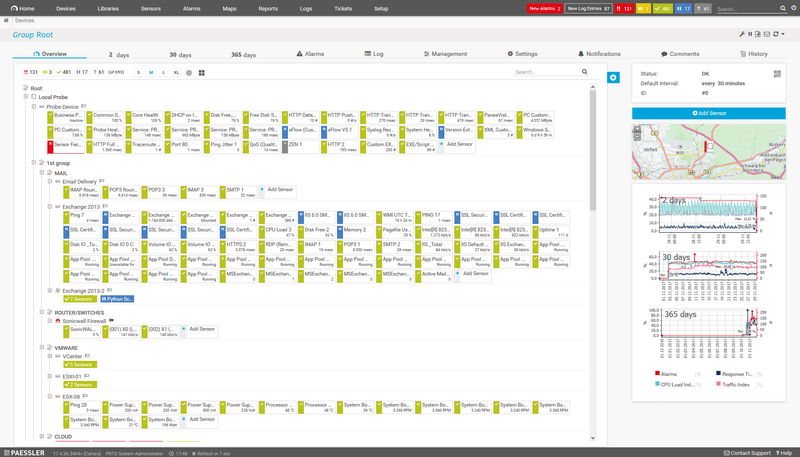
The installation footprint is dynamic, meaning that your monitoring capabilities can grow or shrink with the business requirements of your organization. PRTG does more than just Windows server monitoring, as it can monitor any IT related resource that connects to your network.
On the server front, PRTG is able to send out email and SMS alerts, based on your own customized threshold levels. This means that you can adjust the sensitivity of specific servers, allowing for more frequent warnings to come from critical servers, instead of all of them.
The application is able to monitor everything that you need to know about your server such as: CPU load, Hard Disk Capacity and performance, RAM utilization, and much more.
Administrators are able to view the entire server environment at a glance, thanks to customizable dashboards and reports, which means that specific graphs and analytics can be generated for specific needs. There are predefined vendor templates for big names in the server and enterprise space, such as HP, Dell, Cisco and IBM.
Who is it recommended for?
This tool is ideal for organizations ranging from small setups to large data centers, looking for a solution that can scale with their business needs and provide detailed insights into server performance and network health.
Pros:
- Uses a combination of packet sniffing, WMI, and SNMP to report network performance as well as discover new devices
- Drag and drop editor makes it easy to build custom views and reports
- Supports a wide range of alert mediums such as SMS, email, and third-party integration
Cons:
- Is a very comprehensive platform with many features and moving parts that require time to learn
Free version with 100 sensors is available and Pricing Available on their Site! You can start a 30-day free trial.
7. AppOptics
SolarWinds are well known for their monitoring products, and AppOptics is another fine example.
Key Features:
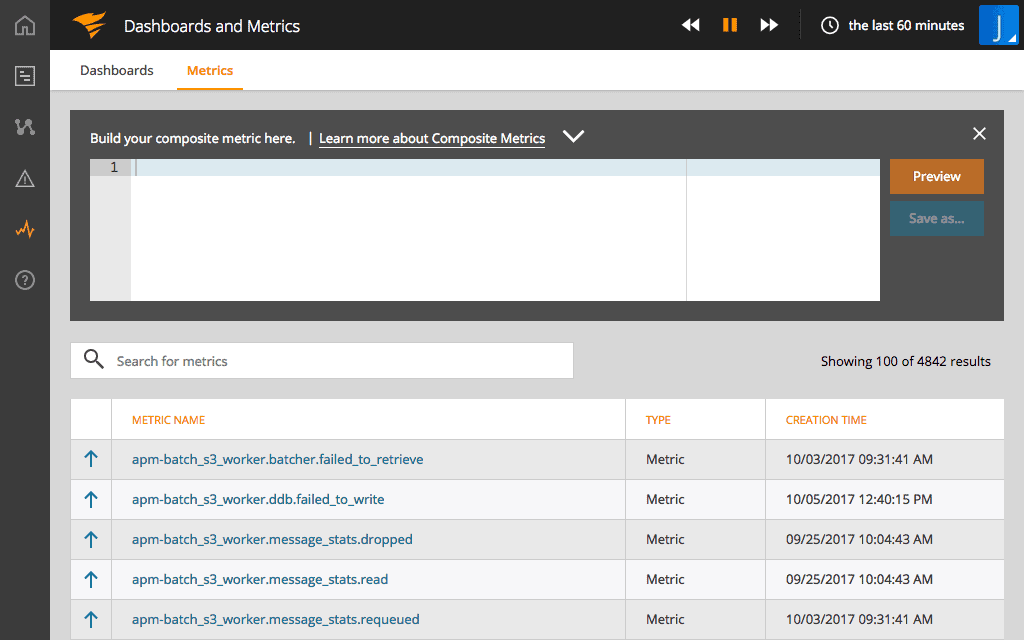
- Custom metrics
- Timescale comparisons
- Fine grained measurement capabilities
- Unified dashboard support
- Plugin customization options
Feature distinction
This tool brings together application and infrastructure monitoring through a streamlined dashboard. As a result, you get a holistic view of your infrastructure.
Why do we recommend it?
AppOptics is recommended for its detailed server and infrastructure monitoring capabilities, with a focus on custom metrics and timescale comparisons. Its support for multiple platforms like Docker, Azure, and Hyper-V offers flexibility in monitoring.
The application is focused primarily on server and infrastructure monitoring, but also has application performance management and custom metrics and analytics features. This creates an all-round monitoring solution for your servers, and will give you an excellent indication as to what exactly is happening within your environment at any given time.
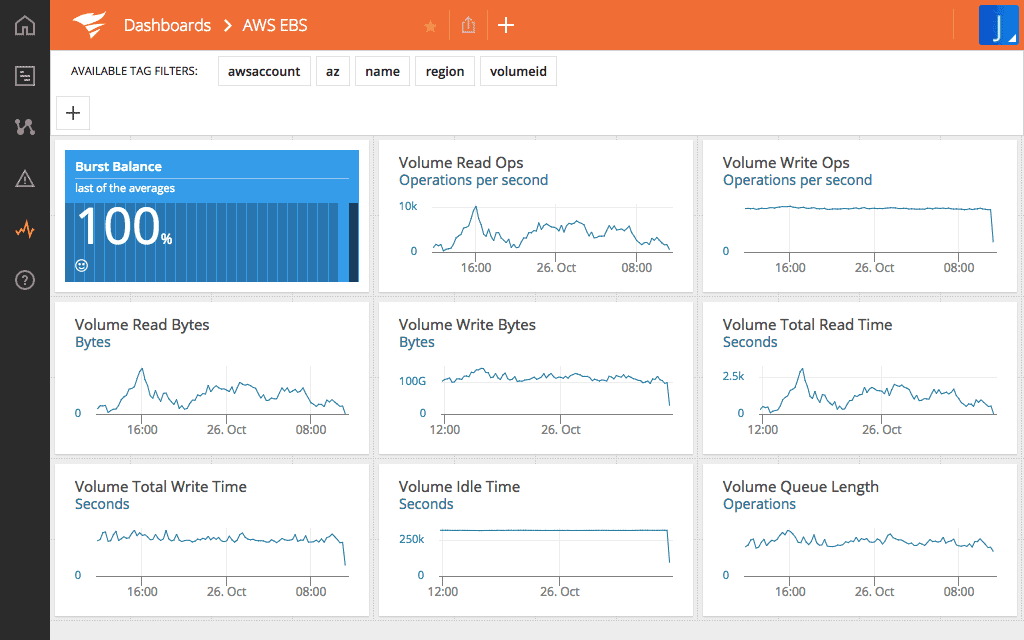
This information can then be extrapolated into usable graphs and dashboards, allowing you to see a visual representation of your server performance. Appoptics also provides many different application integrations for all of the most popular platforms, such as AWS, Apache, docker, and more.
AppOptics is fully customizable, which means that you can monitor web traffic for your web servers, load times on your database servers, and pretty much anything that you would need to look at.
Dates can be customized so that specific time-frames can be mapped out and captured, giving you an operational view of your server environment on your network.
Who is it recommended for?
AppOptics is suitable for organizations that need scalable cloud service monitoring with a focus on detailed health metrics and resource consumption across various platforms.
Pros:
- Offers great visualizations reflecting live and historical health metrics and resource consumption
- Is easily scalable cloud service
- Tracks all major resources focusing on over 180 different metrics
- Can monitor Docker, Azure, and Hyper-V platforms, offering more flexibility than competing options
Cons:
- Would like to see a longer trial period
Contact for pricing or register and get started with a 30-day free trial.
8. SolarWinds SAM
SolarWinds SAM (Server & Application Monitor) is a fully functional server monitoring application that is just as at home on your local area network as it is in the cloud.
Key Features:
- Easy setup and quick installation
- Monitor AWS and Azure servers
- 1200+ application templates for easy monitoring
- Root cause analysis
- Storage performance and health monitoring
Why do we recommend it?
SolarWinds SAM is highly recommended for its comprehensive server monitoring capabilities, both on local networks and in the cloud. It offers easy setup, extensive application monitoring templates, and efficient root cause analysis. The ability to monitor AWS and Azure servers, coupled with its proactive approach to issue resolution, makes it an indispensable tool for system administrators.
The application allows system admins to monitor key services and applications that run on both Windows and Linux Servers, so that issues such as hard disk space, memory utilization and other key performance indicators can be monitored in real time.
SolarWind usual Microsoft application support is there, and also gives users the power to monitor Hyper-Visor stats, cloud and SaaS products too. Azure and AWS are supported, and can also be monitored remotely, allowing your admins to give proper reports with all of the necessary information.
Unified dashboards provide a wealth of information for staff that need to monitor critical cloud resource allocations.
The name of the game here is being Pro-Active. Preemptively fixing issues on your network and servers is a far better solution than repairing faults when they become a problem.
SolarWinds provides all of the tools and notification facilities to help manage your server resources in real-time.
Who is it recommended for?
SolarWinds SAM is ideal for organizations looking for a versatile server monitoring solution that can handle both Windows and Linux servers. It's particularly suitable for environments where proactive monitoring and real-time insights into system performance are crucial.
Pros:
- Οffers “done for you” dashboards, monitors, and templates designed for your environment
- Provides live monitoring through its agentless architecture
- Supports auto-discovery that builds network topology maps and inventory lists in real-time based on devices that enter the network
- Can map applications, networks, and infrastructure as well as highlight bottlenecks and dependencies
- Uses drag and drop widgets to customize the look and feel of the dashboard
Cons:
- SolarWinds SAM is a feature-rich enterprise tool that can take time to fully explore
Start a 30-day free trial.
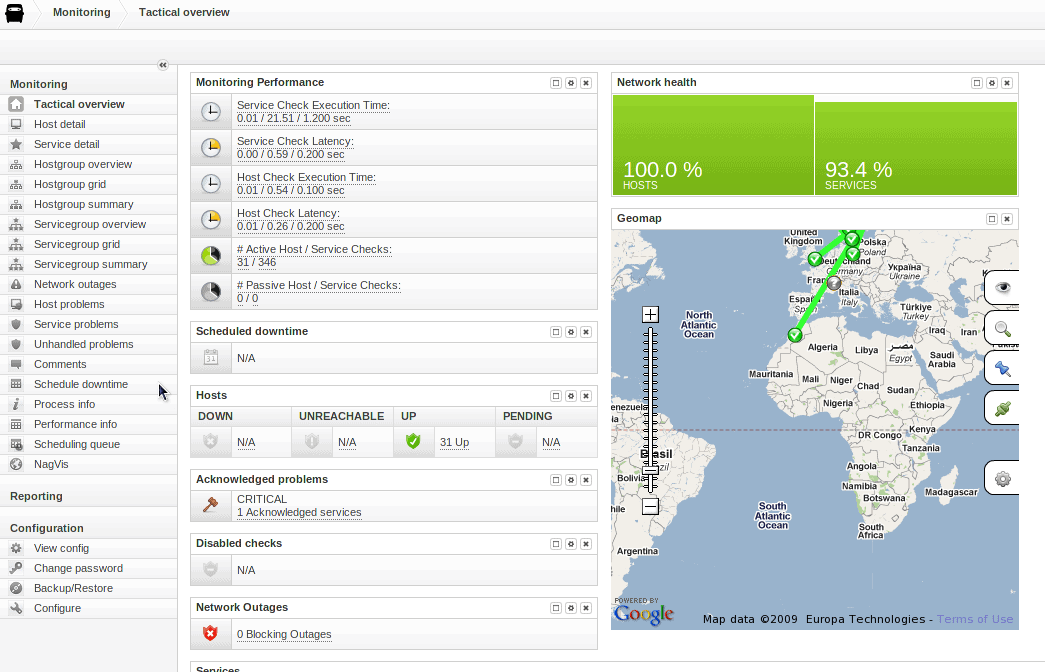
9. Nagios XI
Nagios XI is a comprehensive IT infrastructure monitoring application that provides information about all mission critical aspects of your environment. This includes: servers, networking components, services, networking appliances and protocols, and much more.
Key Features:
- Easy Configuration Wizards
- GUI Config
- Advanced Reporting
- Dashboard Customization
- Custom Actions
Why do we recommend it?
Nagios XI is recommended for its comprehensive IT infrastructure monitoring capabilities, providing detailed insights into servers, network components, and services. Its scalability and customizable interface make it a reliable solution for diverse IT environments.
There are hundreds of third-party plugins that add extra functionality to the solution, making it easy to get setup and monitoring the equipment within your environment in no time.
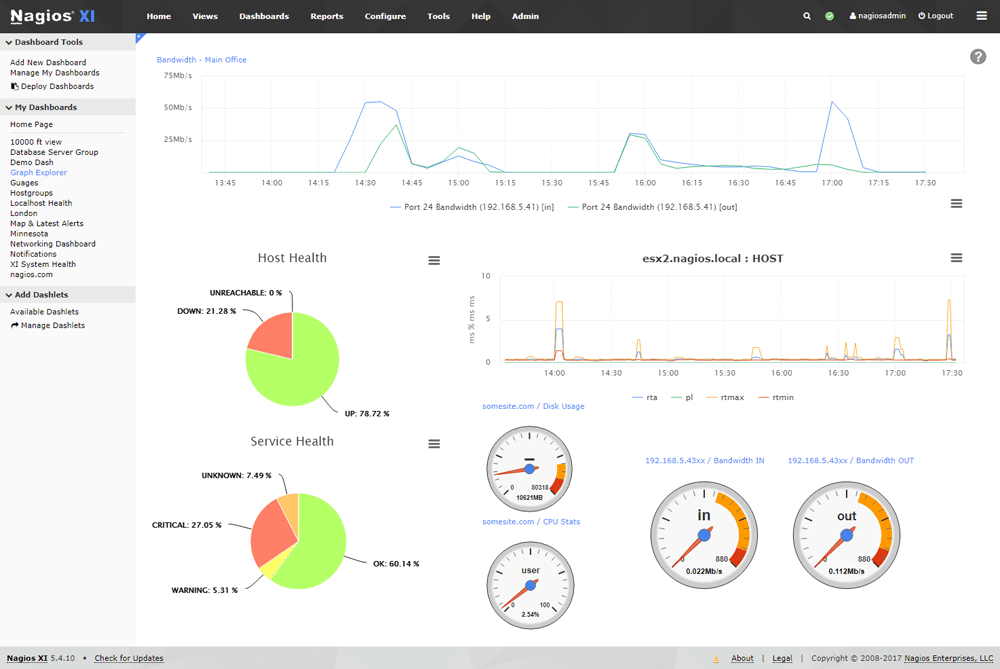
Nagios Core 4 provides the backbone of this application, and offers high performance with lower system resource overheads.
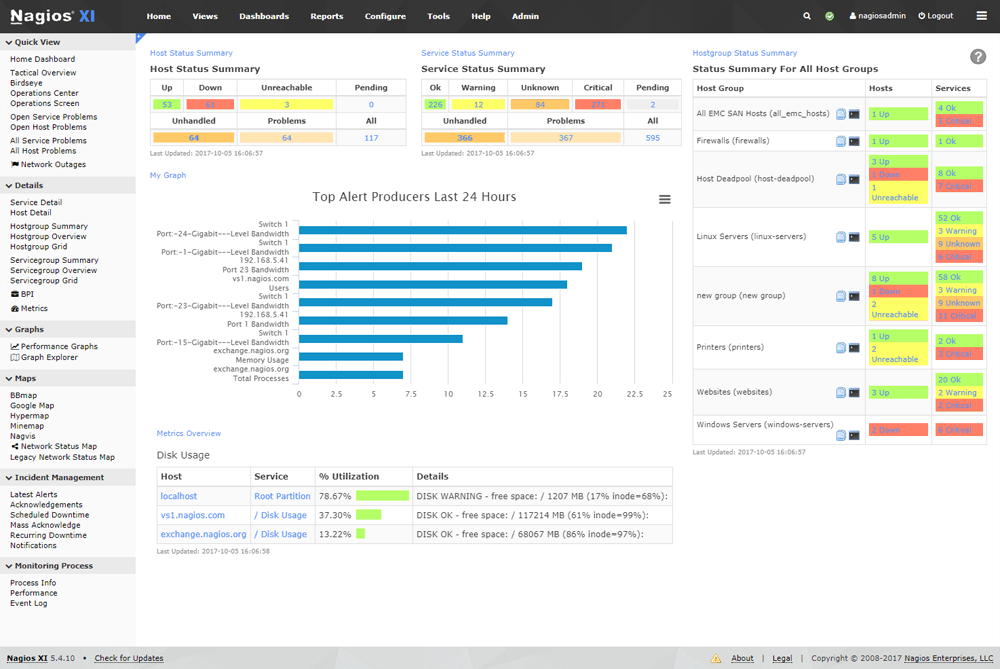
The web interface is easy to setup and to use, and the solution is scalable across all network sizes, from small to large. Individual server components can also be monitored, allowing your system admins to keep all of your most critical servers up and running with no problems.
Nagios is able to monitor everything on your network, from hardware components, to software and application issues, on both physical and virtual servers. It is customizable and can be tweaked to suit your particular requirements.
Who is it recommended for?
Nagios XI is ideal for organizations seeking a robust monitoring solution that can adapt to both small and large network environments, offering detailed server component monitoring and flexible alerting options.
Pros:
- Simple, yet informative interface
- Flexible alerting options support SMS and email
- A wide range of community-designed plugins are available for free
Cons:
- The open-source version lacks the support found in paid products
Starts at $ 1,995 USD
Related Post: Best Alternatives to Nagios
10. OpsView
Opsview is a multi-platform monitoring service that runs on Windows, Linux and Unix. It does this by combining virtualization, network, and enterprise application monitoring tools all in one unique monitoring package.
Key Features:
- Nagios Plugin Support
- Integration facilities for help-desk and ticketing systems
- Automated deployment with Chef, Puppet and Ansible
- Works on Physical, Bare Metal and Virtual machines
- Business Service Monitoring and SLA reporting
Why do we recommend it?
OpsView is recommended for its versatile monitoring capabilities across various platforms including Windows, Linux, and Unix. It offers unique features like Nagios Plugin Support, real-time analytics, and SLA reporting, making it highly effective for server monitoring.
Real-time analytics gives you the power to detect and mitigate any potential server failures, thanks to the abundance of system related information that Opsview is able to gather and sort.
Groups of servers can be managed according to business importance, so that if a particular system goes down, its overall business impact can be seen at a glance.
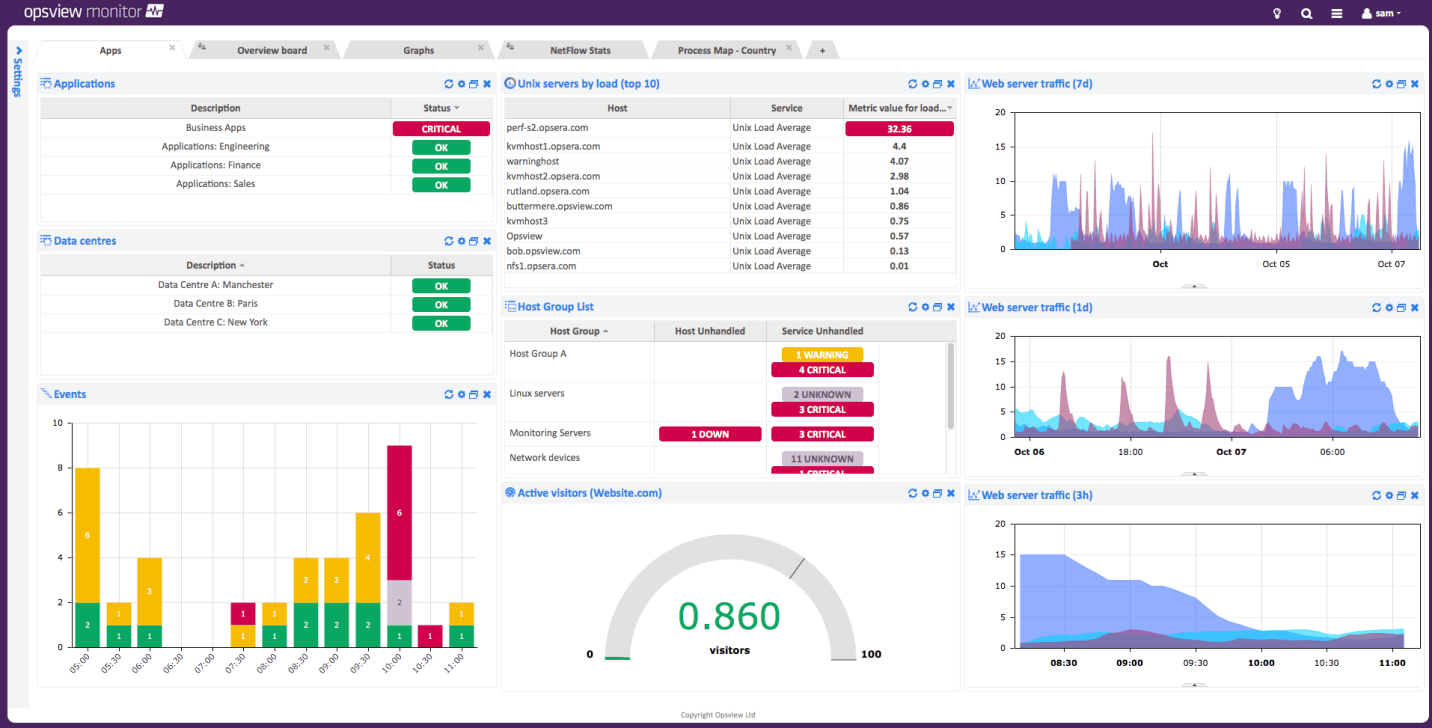
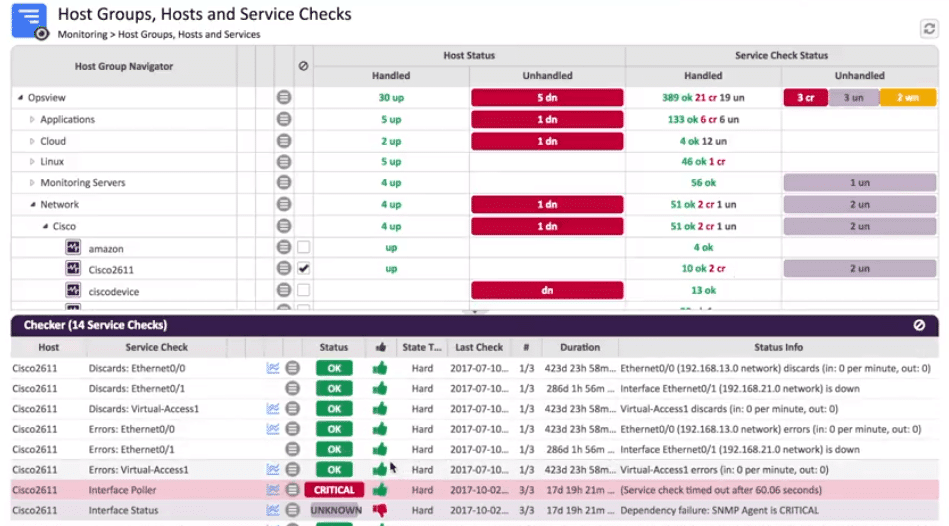
The main feature that makes Opsview so usable is the timeline customization that is possible with its historical graphs feature. If you have been having issues for a specific period of time, highlighting that time period will produce a clear information set that is full of vital information, which will help your team to find what the cause, and possible solutions to the issue could be.
Opsview offers a user-friendly interface that is easy to navigate and customize, and the new menu layout has made it even more intuitive. Monitoring server-specific issues is very easy, and there is also support for over 3500 Nagios plugins, making your monitoring setup that much more customizable.
This is an excellent solution for server monitoring, be they physical, virtual, or hosted in the cloud.
Who is it recommended for?
This solution is suitable for businesses that require detailed server monitoring along with integration capabilities for help-desk and ticketing systems, particularly beneficial for organizations managing groups of servers based on business importance.
Pros:
- Supports various sources including J-Flow, NetFlow, and sFlow monitoring
- Clean, easy-to-use interface
- Supports a free and paid version
- Highly customizable platform
Cons:
- Requires Opsview Monitor to monitor J-Flow, not a standalone tool
Starts at $ 2.00 USD per host per month.
11. Zenoss
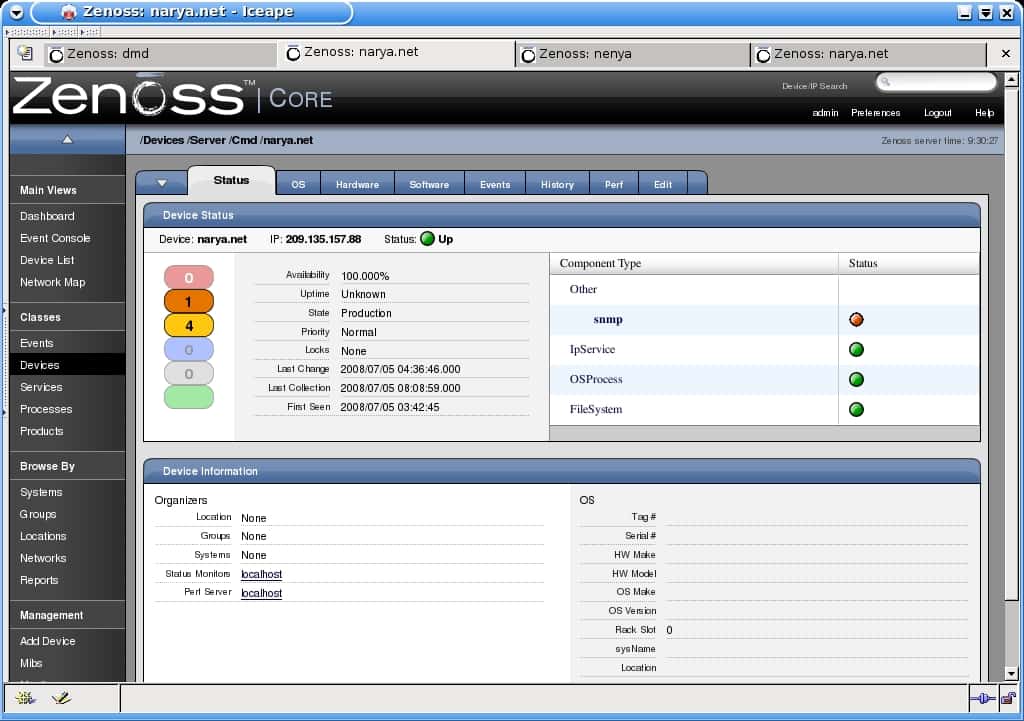
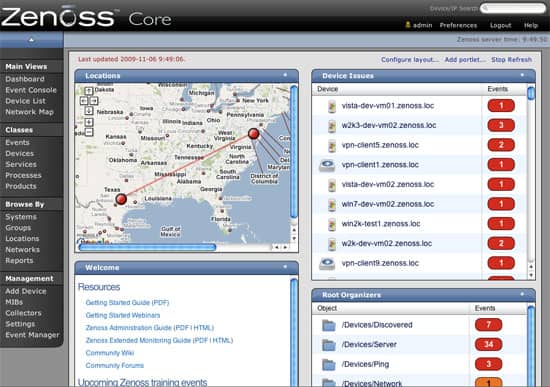
Zenoss seeks to reduce costs and IT complexity by creating a visual representation of your overall server performance and availability as part of an end-to-end IT service model. What this means is that Zenoss takes stats from all of your servers within your environment, and creates and overall, unified performance and utilization data source for analysis.
This gives you a clear understanding of what is happening across your network, and how your servers are performing. Physical, virtual and cloud servers can all be monitored from within the application’s GUI, providing a clear and widespread snapshot of what is happening on your network at all times.
Zenoss is available in different versions, from open source to enterprise, and each has their own specific features and limitations that may or may not work in your environment.
Key Features:
- Switch Network interface and Router monitoring
- Central processing unit (CPU) utilization information
- Hardware information, including memory, number of CPUs and model numbers
- Operating system (OS) information
- Software package information, e.g., installed software
Why do we recommend it?
Zenoss is commended for its comprehensive approach to IT monitoring, providing a unified view of server performance across physical, virtual, and cloud environments. Its capabilities in switch network interface, router monitoring, and utilization information make it a robust choice.
Zenoss is also able to make use of the Nagios plugin framework, which gives your system even more functionality. For environments that have WAN links and remote offices, there is even a visualization and mapping tool that lets you map out your communications links.
This is particularly useful for when a remote server fails, but you are unable to determine if the cause is network-related, or server related.
Who is it recommended for?
Zenoss is ideal for organizations seeking a monitoring solution that can support Fortinet, Cisco Layer 2-4 devices, and automate new device discovery, especially useful for environments with complex IT infrastructures.
Pros:
- Offers Fortinet monitoring through a simple plugin
- Uses network discovery to automatically pull in new devices that enter the network
- Supports Cisco Layer 2-4 devices
Cons:
- Support is only for paid tiers
Contact for pricing.
12. OP5
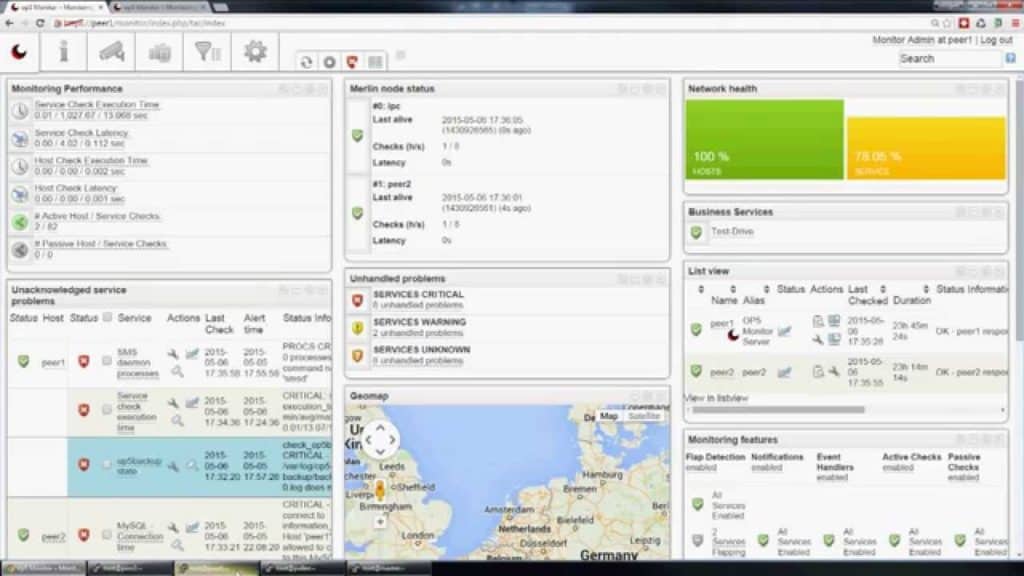
OP5 is a Swedish IT company with a global presence, and their monitoring software is built on top of an open source platform. Although OP5 is a great server monitoring tool, it also offers application and network monitoring as well.
All of this information is displayed on a customizable unified dashboard, giving you and your team all of the information that they could need, right at their fingertips. OP5 increases their overall appeal by providing Nagios plugin support for most open source plugins, which is great for specific requirements that you may have on your network.
The range of details that can be monitored are varied, and in some cases you might find that there is a wealth of information that your network is generating, ideal for monitoring and graphing!
You are able to monitor individual server components, right up to global communications links, giving you a micro and macro view of your IT environment from a single application.
Key Features:
- Customizable dashboards
- Scalable
- Automation capabilities
- Nagios plugin support
- Developer friendly API
Why do we recommend it?
OP5 is recognized for its scalability and automation capabilities, supported by a developer-friendly API and customizable dashboards. It stands out for its ability to provide detailed monitoring across both micro and macro IT environments.
OP5’s pricing structure is based on a ‘per device’ type of structure, so you will have to contact them to get an accurate quotation for your specific needs. Overall, this is another great server monitoring platform that does more than just look at individual servers.
Who is it recommended for?
This tool is particularly well-suited for large enterprises that require a comprehensive monitoring solution capable of handling vast amounts of data and offering features like geolocation and dependency mapping.
Pros:
- Focuses primarily on offering their services to large enterprises
- All features and interfaces are designed to scale and handle large amounts of data well
- Simple widget customizations can be added or removed
- Offers geolocation mapping, and dependency mapping to help visualize complicated network services
Cons:
- Must contact sales for accurate pricing information
- The interface could be made more user-friendly with fewer menu options
Contact for pricing
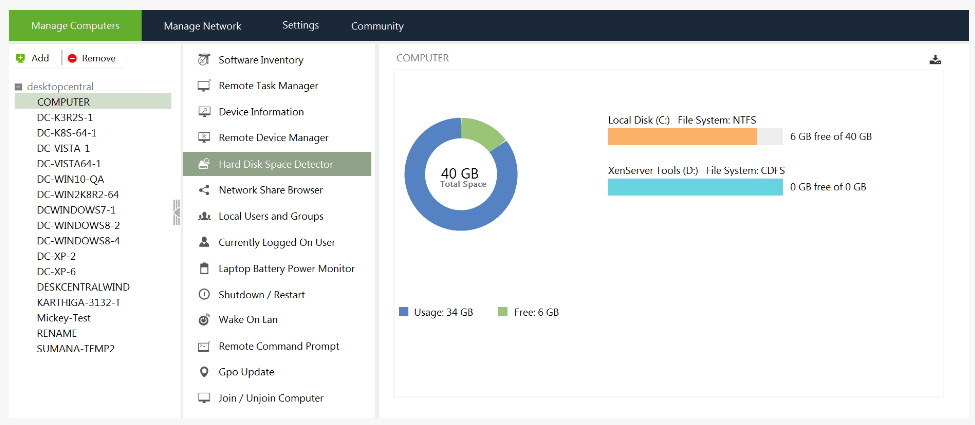
13. Free Windows Tools by ManageEngine
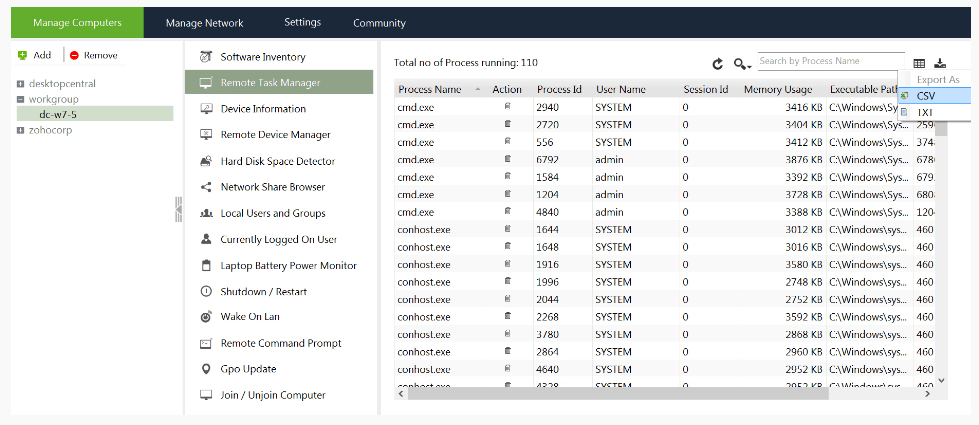
This is a free set of Windows tools for monitoring and remotely resolving issues with your servers.
Key Features:
- Freeware
- Hard disk space monitor
- Remote device manager
- Monitor currently logged on users
- Remote task manager
Why do we recommend it?
Free Windows Tools by ManageEngine are recommended for their versatility in monitoring and resolving issues remotely. These tools are ideal for basic monitoring needs like disk space usage, memory allocations, and remote applications management.
These tools are ideal for a smaller network where there are only a few local servers that need monitoring. Some basic monitoring can be performed on disk space usage, memory allocations, remote applications, and more. The tools have been made available by ManageEngine, and as such are well written and work really well.
These are great for system admins that need a few free tools to perform some niche operations like remote desktop support and process monitoring on remote servers.
There are many different monitoring options available, from basic server device information, to hard disk space, and a handy network share browser. All of these tools are useful to a system administrator that is looking after a small site, or multiple small sites.
For a free product, the overall functionality of this suite is really good. Hard disk space monitoring is really important on critical servers like file and storage servers. Even web and FTP servers need to be checked for storage space usage every once in a while, so this could be just the application for you if you have been looking for a freeware solution.
Who is it recommended for?
These tools are especially useful for system administrators managing small networks or multiple small sites, providing essential monitoring capabilities without cost.
Pros:
- Designed with large networks in mind
- Offers a suite of tools that provide WoL, IP address management, and physical switch port mapping
- Gathers hostname, device status, and MAC address alongside IP address scans
- Identifies new machines via autodiscovery, great for larger deployments
- Available for both Windows server as well as Linux
Cons:
- ManageEngine is a large monitoring platform that offers a host of tools and features that may take time to fully explore
Free package.
Conclusion
Server monitoring requirements are different for each different environment. Your needs may be different if you manage a server farm, as opposed to a small business cluster of a few virtual hosts in a small company. As such, the small selection that we have taken a look at should help you to find the right solution for your needs.
This list is no means exhaustive, and there are many other great products out there that offer similar functionality to some of the applications that we have looked at today. Reporting and monitoring is critical in business, especially when it comes to IT infrastructure such as network connectivity and server monitoring.
Being able to look back at historical trends and faults is especially useful when troubleshooting an issue on a critical server or service, so if you don’t already have a solution in place, then it might be time to seriously consider it.
Related Post: Best Bandwidth Monitoring Tools and Systems
Server Monitoring Tools FAQs
How does server monitoring software collect data?
Server monitoring software collects data through various methods including agents installed on servers, SNMP, WMI, and APIs. Data is typically collected at regular intervals and stored in a central database for analysis and reporting.
Can server monitoring software be used with cloud-based servers?
Yes, server monitoring software can be used with cloud-based servers such as those running on Amazon Web Services (AWS), Microsoft Azure, or Google Cloud Platform. However, monitoring requirements may differ depending on the specific cloud provider.
What types of alerts can be set up with server monitoring software?
Users can set up alerts to notify them when specific conditions are met such as CPU usage exceeding a certain threshold or a particular error occurring a certain number of times. Alerts can be sent via email, SMS, or other notification channels.
What are some popular server monitoring software tools?
Some popular server-monitoring software tools include SolarWinds Server & Application Monitor, Nagios, Zabbix, PRTG Network Monitor, Datadog, and Prometheus.
Can server monitoring software be used for application monitoring?
Yes, many server-monitoring software tools also include application monitoring capabilities. These tools can monitor the performance and availability of applications running on servers, as well as track application-specific metrics such as response time, database queries, and transactions.
Can server monitoring software be used for security monitoring?
While server monitoring software is primarily designed for performance and availability monitoring, many tools also include security monitoring capabilities such as intrusion detection and vulnerability scanning. However, dedicated security monitoring tools may be more effective for detecting and responding to security threats.


