

You may have been involved in the design and implementation of a network or maybe you came on board after the network had been built. No matter the case, one thing that becomes quickly apparent is that there is a need to make sure the network is operating as it should, and one of the ways to ensure that is Monitoring.
Network Monitoring gives administrators a clear view of the devices, services, and applications running on their network and the opportunity to track the availability/performance of these resources. This provides proactive management rather than reacting to issues as they happen.
Here is our list of the best open-source network monitoring tools:
- Nagios – EDITOR’S CHOICE A free system called Nagios Core and a paid edition called Nagios XI, this open-source package is one of the leading network monitoring systems in the world and it can also monitor servers and applications. Available for Linux, Unix, and macOS but you can run it on Windows over a hypervisor. Get Nagios XI on a 30-day free trial.
- Zabbix This attractive free monitoring tool for networks, servers, and applications has some great graphs and charts for live performance data. The core package runs on Unix, Linux, and macOS.
- Icinga A fork of Nagios that is completely free to use and can monitor networks, servers, and applications. Runs on Windows, macOS, and Linux.
- LibreNMS This free network monitoring tool includes autodiscovery and offers graph views of various performance statistics. Runs on Linux, Docker, or its own hypervisor.
- Pandora FMS This open-source package is available in free and paid versions and it will monitor servers and applications as well as networks. Runs on Linux or Docker.
While it is possible to manually monitor a network (depending on the size of the network and how critical the resources on the network are), you will probably be better off using tools specifically designed for such a purpose.

Generally speaking, there are a couple of things that network monitoring tools will/should provide for you:
- Configuration At the minimum, Windows or Linux network monitoring software will provide a way to add the hosts and services to be monitored.
- Status reports The tool should provide a means of viewing the status of monitored resources e.g. availability (up/down status), CPU usage, etc.
- Alerts and notifications Some tools are able to send alerts when an event occurs. Event Log Monitoring and Alerts could be sent via SMS, Email, etc.
- Graphs Knowing the current status of a resource is good but even more beneficial is being able to see that status over time. Such information is best displayed in graphs and most monitoring tools provide various graphs for monitored parameters.
- Reports Reports are not only important for administrators but also for management. Different tools have varying levels of reporting capability.
Network monitoring tools can be categorized in several ways, from those that only work on Windows systems to those that require a paid license to operate.
For the purposes of this article, we will focus on open-source (usually free) network monitoring tools that operate on Linux/Unix systems, although some of them have Windows versions available.
We will be discussing some of the most widely used tools in the windows/linux monitoring realm, looking at their characteristics and comparisons, to help you make a decision on which one is best for you.
Top Open-Source Network Monitoring Tools of 2026
What should you look for in an open-source network monitoring tool?
- We reviewed the market for open-source network monitoring software and analyzed options based on the following criteria:
- A service that includes autodiscovery and a device inventory
- A system that polls network devices for status reports
- Live activity feedback, shown in tables, charts, and graphs
- Integrations that enable the system to extra data from software and devices
- The ability to create a live tropology map
- A free trial or a demo for a no-cost assessment opportunity or a free tool
- Value for money from a monitor that is comprehensive and reasonably priced or a free service that is worth installing.
With these selection criteria in mind, we identified a number of open-source packages for network monitoring and we included both free and paid systems.
1. Nagios Core (FREE)
The best way to describe Nagios is the grandfather of network monitors because it has been around for so long (18 years). In fact, the company behind Nagios calls it the “Industry Standard In IT Infrastructure Monitoring”.
Note: Nagios comes in two flavors: Nagios Core (which is free and open source) and Nagios XI (paid Enterprise edition). Since this article is about open-source monitors, we will focus on Nagios Core.
Key Features:
- Industry-standard IT infrastructure monitoring
- Extensive plugin system for customization
- Supports Netflow, sFlow, and other protocols
- Large, active community for support
Unique Feature
Provides instant awareness of the mission-critical infrastructure of your organization.

Why do we recommend it?
It monitors the entire infrastructure, including systems, applications, services, business processes, and more. It also collects log data, flow data, and anything else that your organization may need.
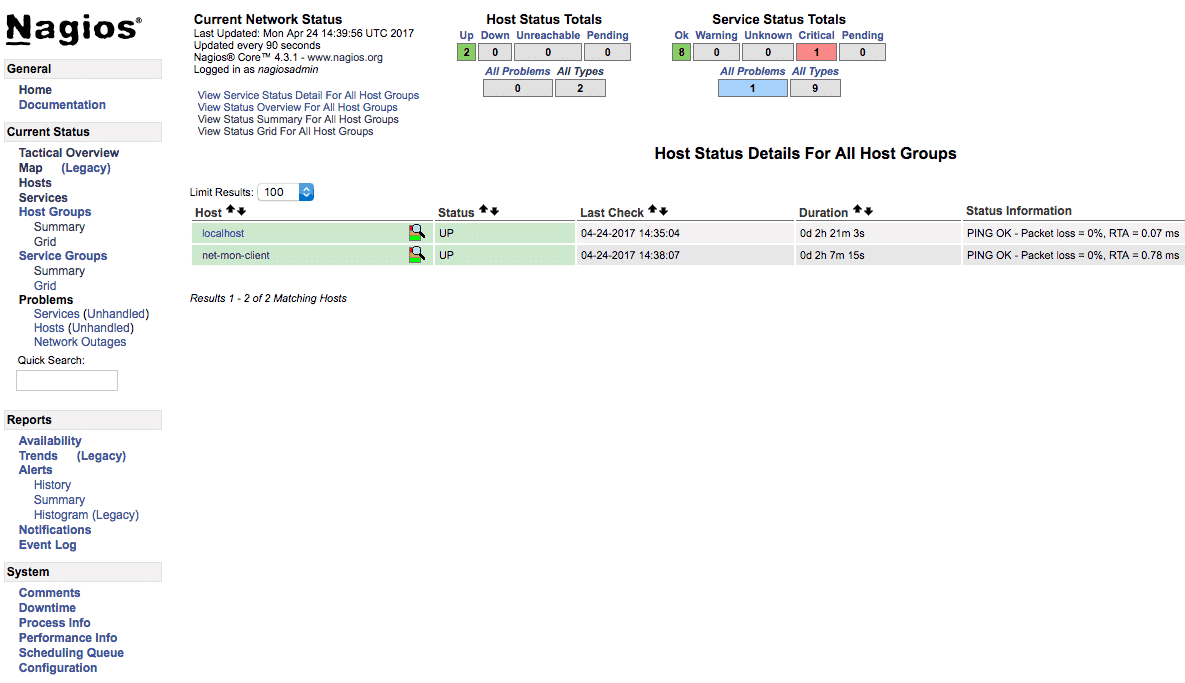
By default, all the configuration (e.g. adding hosts and services to be monitored) for Nagios is done through text files. This can take some time to get used to resulting in a steep learning curve and thus, reduces its attractiveness to new users. However, once you get past that and become familiar with the system, you can unlock the great power available in Nagios.
Out of the box, Nagios is not great – text-based configuration coupled with an outdated web interface (for monitoring). However, the numerous plugins and scripts available for Nagios make it highly customizable, with options to monitor Netflow and sFlow and other flow protocols as well. For example, Adagios is a web-based configuration interface for Nagios. It also has a large community base meaning that you are likely to find the answer to your question or a plugin that already does what you need.
Who is it recommended for?
Ideal for network administrators of devices running Linux, Windows, and Unix operating systems.
Pros:
- Open-source transparent tool
- Simple, yet informative interface
- Flexible alerting options support SMS and email
- Robust API backend makes it a great option for developers who want to integrate their own custom applications
- Very generous two-month trial period
Cons:
- Open-source version lacks the quality support found in paid products
- Installation can be technical and complex
Considering that Nagios is the most popular open-source monitoring platform, it also has a Virtual Appliance for those looking to deploy as a VM. You can find more information about Nagios on their site.
EDITOR'S CHOICE
Nagios Core is our top choice for open-source network monitoring due to its longstanding reputation and robust capabilities. As the “Industry Standard In IT Infrastructure Monitoring,” Nagios Core offers unparalleled flexibility and customization. Its strength lies in its extensive plugin system and active community, which provide solutions to virtually any monitoring need. The tool's ability to integrate with various systems and support for monitoring protocols like Netflow and sFlow make it an invaluable asset for IT infrastructure management. Additionally, its open-source nature ensures transparency and adaptability, further solidifying its position as a top-tier tool for network monitoring.
Download: https://www.nagios.org/downloads/nagios-core/
Official Site: https://www.nagios.org/
OS: Linux-based systems
2. Zabbix
Zabbix is a strong contender of Nagios. Even though they started later than Nagios, interest in Zabbix has steadily increased over time. This is probably because Zabbix is generally easier to manage than Nagios – out of the box, Zabbix already provides many of the features that you will need plugins for in Nagios.
Key Features:
- Easier management than Nagios
- Web interface with monitoring templates
- Auto-discovery feature for large networks
- Native graph support
Why do we recommend it?
Another comprehensive tool for monitoring IT infrastructure. It can stay on top of millions of metrics across servers, virtual machines, workstations, and more.

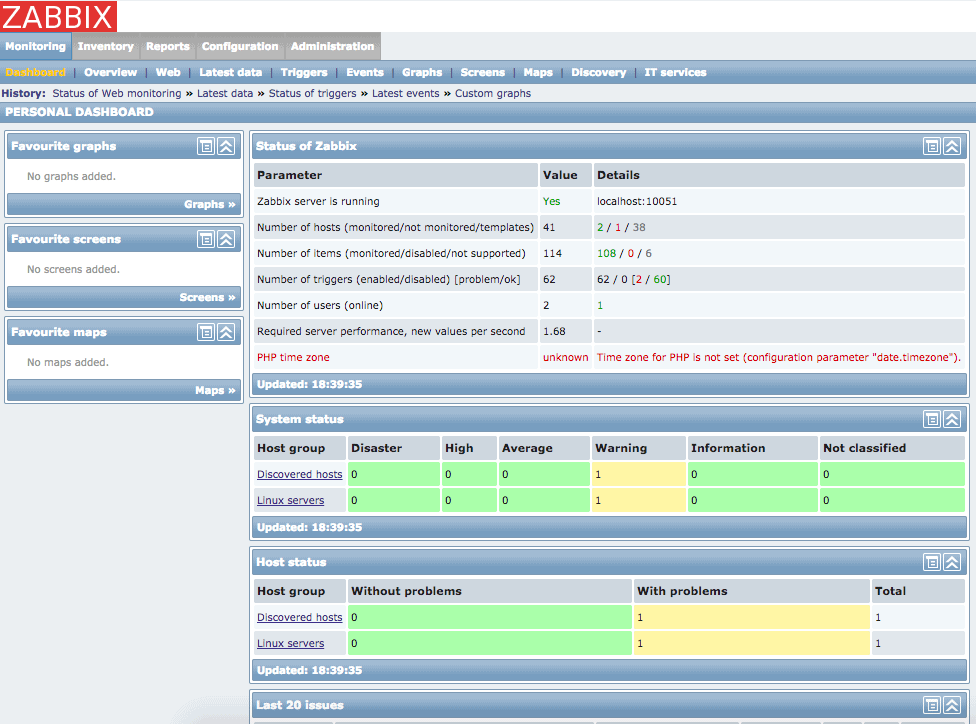
Configuration on Zabbix is done through a web interface that is definitely better than the default web interface provided by Nagios. There are also monitoring templates available through this web interface which make setting up monitoring easier and quicker.
Zabbix also has an Auto-discovery feature which is especially useful on large networks. Finally, graphs are natively supported in Zabbix unlike on Nagios. We've recently compared PRTG vs Zabbix and their strengths & weaknesses as well.
Who is it recommended for?
A good choice for organizations looking for an affordable tool to check the performance and availability of all tools.
Pros:
- Open-source transparent tool
- Uses both SNMP and ICMP for a broader monitoring range
- Can detect new devices and configuration changes immediately
- Offers useful templates for quick insights
- Robust notification system supports SMS, email, custom script, and webhook
Cons:
- The interface isn’t as intuitive as similar solutions
- Would like to see better-alerting features, specifically related to reducing false positives
Unlike Nagios, Zabbix is all free – there is no separate Enterprise edition. However, the folks at Zabbix offer several paid support services.
To learn more about Zabbix and download this tool, visit their site.
3. Icinga
Icinga started off as a fork (branched out development) of Nagios. According to those who decided to branch out, they wanted to add more functionality to Nagios Core than the owner of Nagios Core was willing to accommodate and at the same time, do this faster. As such, Icinga 1 was born. The team worked on a better user interface, added support for more databases (Oracle, PostgreSQL), and made it easier to extend the Core.
Key Features:
- GUI or DSL configuration options
- Built-in visual reporting
- Modular design for custom functionality
- Compatible with Linux and Windows
Why do we recommend it?
Continuously checks the availability of network resources. In case of issues or outages, it sends alerts immediately to the concerned employees.
Interestingly, Icinga 1 is compatible with Nagios and all Nagios plugins. However, a couple of years ago, Icinga 2 was released and in this version, the team completely rewrote the core (by Nagios Core) in a bid to make configuration less complicated and also address scalability issues.
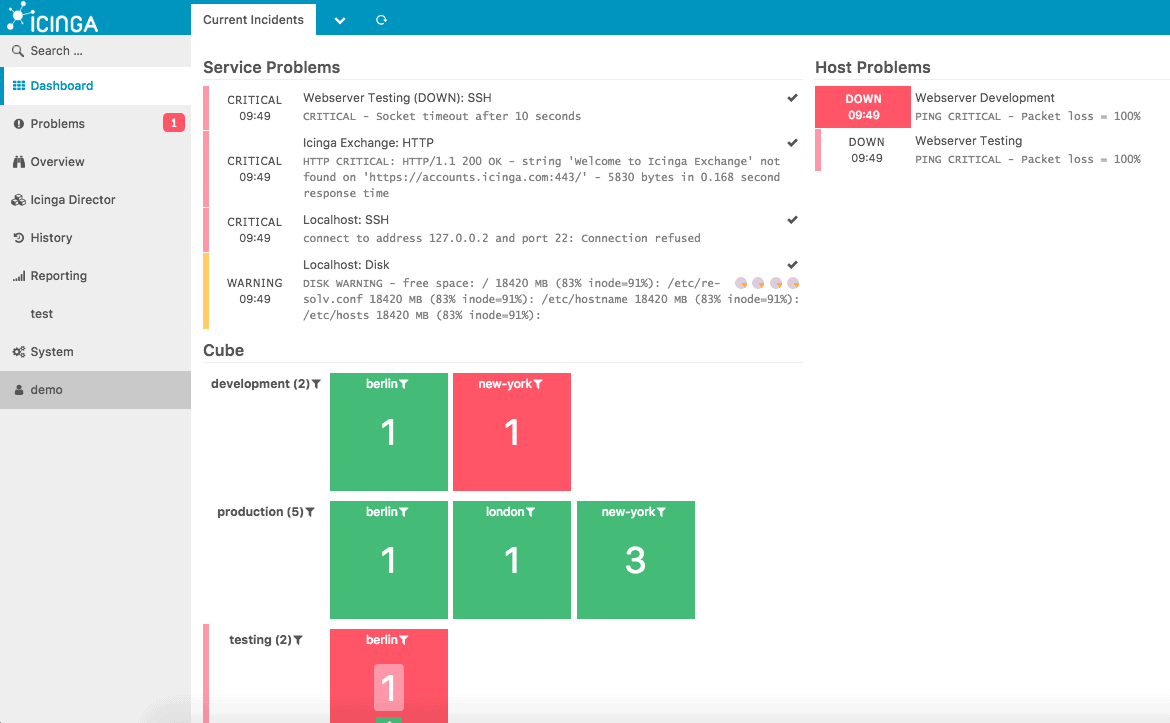
Icinga has a nice and responsive web interface although configuration is still done through text files (except you use a plugin).
The fact that you still have to use text-based configuration files coupled with the robustness of Icinga, means that there is also a steep learning curve for Icinga as with Nagios. On the plus side, Icinga has very detailed documentation to help you along the way.

Who is it recommended for?
Well-suited for organizations that want to customize monitoring and generate reports for auditing and compliance.
Pros:
- Transparent open-source tool
- Can be configured via GUI or DSL, making it a good choice for admins who enjoy CLI tools
- Supports built-in visual reporting
- Modules allow for different functionality, keeping the base installation sleek and lightweight
- Can run on Linux as well as Windows operating systems
Cons:
- Reliant upon the open-source community for support and updates
- Designed for more technical users, other options have better out-of-box features
To learn more about Icinga, visit their site. They also have an online demo that you can play around with.
4. LibreNMS

I was initially going to write about Observium; however, several users have complained about the less-than-par support they received from the guys at Observium. Therefore, I decided to go with LibreNMS which is a fork of Observium and also provides awesome graphs (which is one thing I really like about Observium).
Key Features:
- SNMP-based network monitoring
- Suitable for routers, switches, firewalls
- Web and CLI configuration options
- Built-in alerting capabilities

Why do we recommend it?
This tool works well for auto-discovering devices and monitoring them in PHP/SNMP-based networks.
One of the differences between LibreNMS and the other tools we have highlighted in this article is that LibreNMS is based on SNMP which means that devices to be monitored must have SNMP agents installed/enabled on them.
This makes LibreNMS quite suitable for devices like routers (Cisco and other brands), switches, and firewalls.
Configuration on LibreNMS can be done either through the command line interface or through the web interface. Unlike the community version of Observium, alerting is available by default in LibreNMS, making it a full-fledged network monitoring solution.
Who is it recommended for?
Works well for organizations that use Juniper, Cisco, Foundry, and other operating systems.
Pros:
- Completely free platform
- Open source transparent project
- A wide variety of plugin options for monitoring
Cons:
- Users are reliant on community forums and knowledgebases for support
- Is more technically challenging than similar application monitors
- The interface is not easy to customize
You can learn more about LibreNMS here. There is also a live demo available for you to try out before installing.
5. Pandora FMS
Pandora FMS community edition has the ability to monitor and manage many facets of your network infrastructure, including Bandwidth usage/monitoring of Switches, Routers, Modem's and other gateway and network devices.
Key Features:
- Monitors bandwidth, servers, network devices
- Plugins for Exchange, Oracle, Tomcat, etc.
- Scales beyond 10,000 servers
- Robust alerting and notification system
Why do we recommend it?
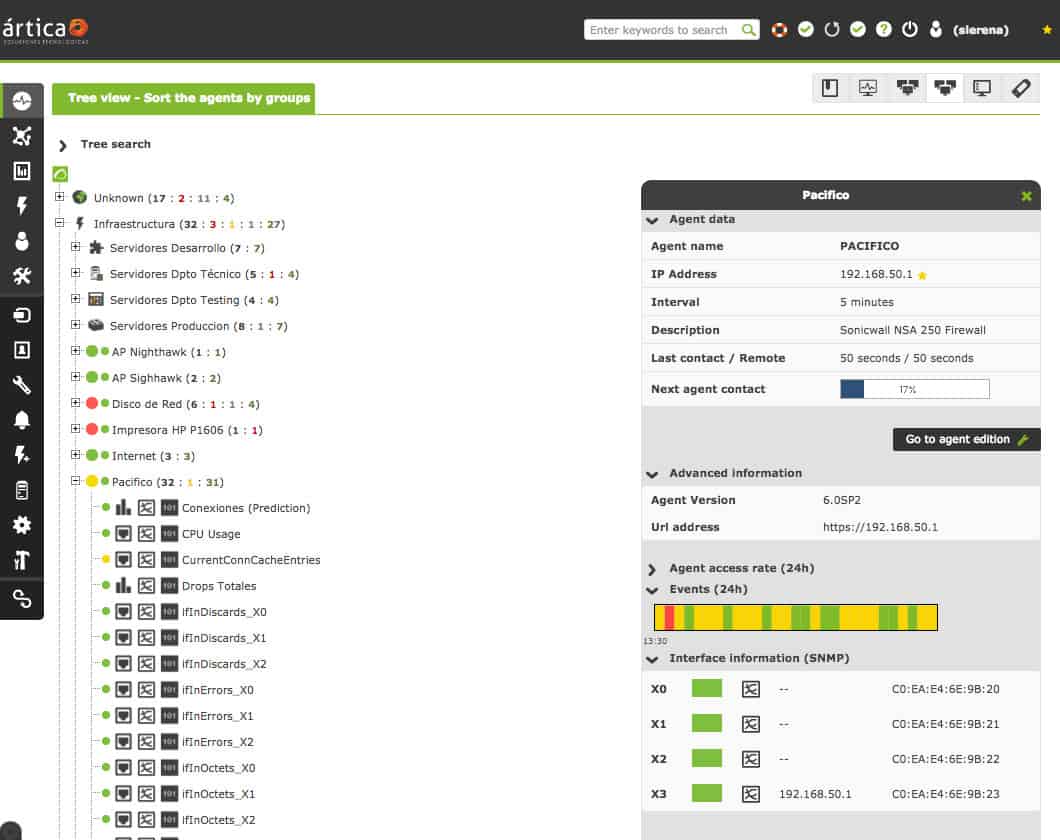
Provides a visual representation of the status and performance of a wide range of parameters, so you can have a comprehensive idea of what's happening in your network.
On top of just monitoring bandwidth usage, Pandora offers a server monitoring solution with their wide array of plugins for popular programs and systems including Microsoft Exchange Server, Oracle, Tomcat, JMV, JBOX, IIS, and SPA/R3 systems.
They even boast software agents for Android platforms as well. According to their website, Pandora can also scale beyond 10,000 Servers using the Community edition without the need for the enterprise, paid version.
Along with their wide array and support of systems/software, they can monitor, Pandora offers a robust Alerting and Notification system. Alerts and notifications can be configured using SMS, Online Applications (including Slack, Jabber, etc), Email, Syslog, and custom scripts.

Who is it recommended for?
A good choice for organizations with a distributed environment. Also, works well for network engineers who want to generate extensive reports.
Pros:
- Works alongside Pandora NMS for additional address management functionality
- Supports patch management, making it a more complete tool than other managers
- Can group LANs with other non-VPN WANs into a single group for easier management
- Open-source with paid version
Cons:
- Outdated interface, visualizations are lacking, and nested menus can be overwhelming at scale
You can learn more about the Pandora FMS Community at their official website here.
Conclusion
In this article, we have looked at several open-source network monitoring tools including Nagios, Zabbix, Icinga, LibreNMS, and Pandora FMS. Just because we focused on these tools as the “best” does not necessarily mean they are the best for your needs.
For example, there are many other open-source monitoring tools that exist such as OpenNMS, Cacti, and Zennos and you have to consider the benefits of each one from the perspective of your requirement.
Moreover, there are other tools that may be better suited for your needs that are not open source.
For example, PRTG Network Monitor is a simple-to-use network monitoring tool and is free for up to 100 sensors – you can read our full Review of PRTG here. If you are looking for specific Active Directory tools, we've compiled a list of them here for your viewing.
SolarWinds Network Performance Monitor is another Great monitoring tool that has a large community behind it and has updates almost every year.
We prefer to stick with paid monitoring solutions, as issues and problems do arise from time to time with configuration and other issues – So having a support team that stands behind their product really makes all the difference for businesses who need a complete monitoring solution.
In summary, consider your needs before choosing a network monitoring solution.
If you are familiar with Linux/Unix and need a highly configurable solution, perhaps you should consider Nagios. If you want Nagios level of customization but with a better web interface, look at Zabbix or Icinga. If your network relies heavily on SNMP then consider LibreNMS.
Open Source Network Monitoring Tools FAQs
What are the benefits of using open source network monitoring tools?
The benefits of using open source network monitoring tools include:
- Cost savings compared to commercial network monitoring tools
- Customization and flexibility to meet specific network monitoring requirements
- Access to a wide range of community-developed plugins and add-ons
- Transparency and control over the software code and functionality
What are some popular open source network monitoring tools?
Some popular open-source network monitoring tools include:
- Nagios
- Zabbix
- Icinga
- LibreNMS
- OpenNMS
What features should I look for in an open source network monitoring tool?
When choosing an open source network monitoring tool, look for features such as:
- Real-time network monitoring and alerting
- Customizable dashboards and reporting
- Support for multiple protocols and devices
- Scalability to support large networks
- Integration with other IT management systems
- Ease of use and configuration
What is a plugin or add-on in an open source network monitoring tool?
A plugin or add-on in an open source network monitoring tool is a piece of software that extends the tool's functionality, such as by adding support for new devices or services, or by providing new monitoring features.
Related Post: Best Penetration Testing Tools


